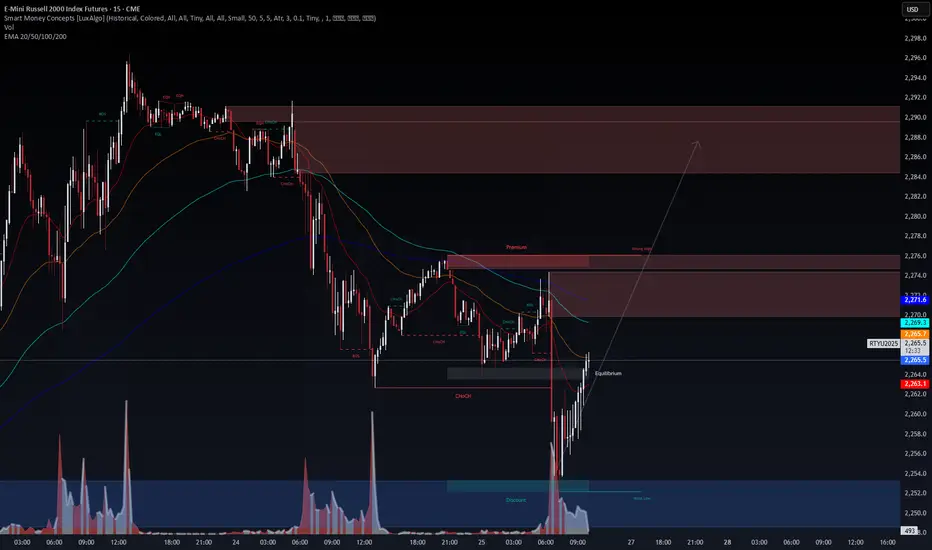
RUT vs IWM – VolanX Sees the Same PulseThe Russell 2000 (RUT) is echoing IWM’s footprint with precision. Both charts are cycling through a similar Smart Money Concepts (SMC) structure – BOS, CHoCH, and strong liquidity grabs.
VolanX reads this as accumulation in the discount zone, preparing for a premium drive toward 2,288+.
Equilibrium Pivot: Price is reclaiming balance near 2,264.
Premium Target: First reaction likely around 2,276 – 2,288 zone.
Volume Surge: Smart money volume spikes confirm stealth accumulation.
If IWM continues its climb, RUT could follow with a volatility burst into the premium zone, setting up for a momentum push into next week.
"Do you see RUT shadowing IWM’s footsteps, or is this a fake-out? VolanX bets on symmetry."
#RUT #IWM #VolanX #SmartMoneyConcepts #LiquidityHunt #TradingView
M2KZ2025 trade ideas
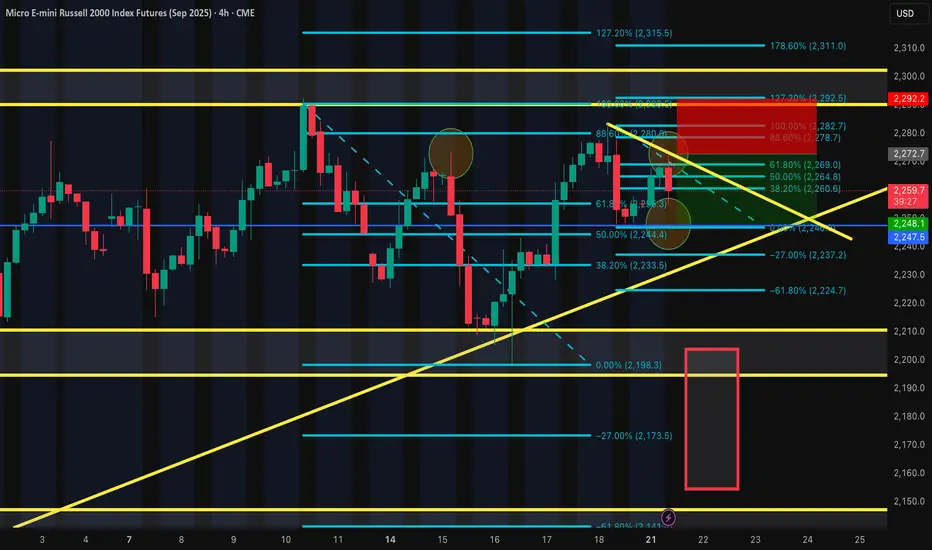
The Russell SELL Trade IdeaWe are currently SHORT on the Russell. I expect the price to hit the 2247 level within the next 24-48 hours. Let me know your thoughts.
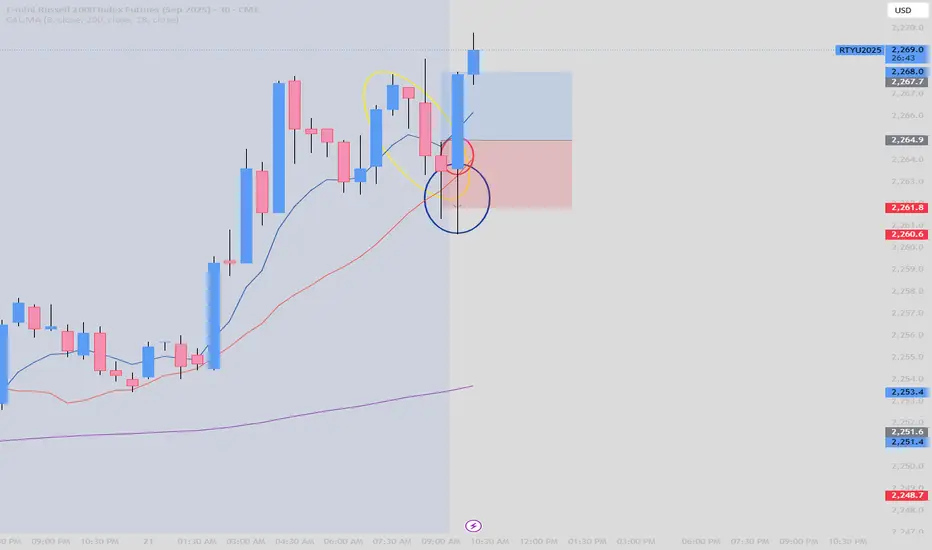
07/21 Trade for RussellPatience is key.
1. Variation (Yellow): Wait for the downside to end and the wick to confirm the rejection to the downside and buy when its on the way up.
2.Wick(Blue): I had to adjust the time frames for confirmation so I used 15min and 30min to adjust my entry.
3.Volume: I had the strength on my side so I enter confidentl
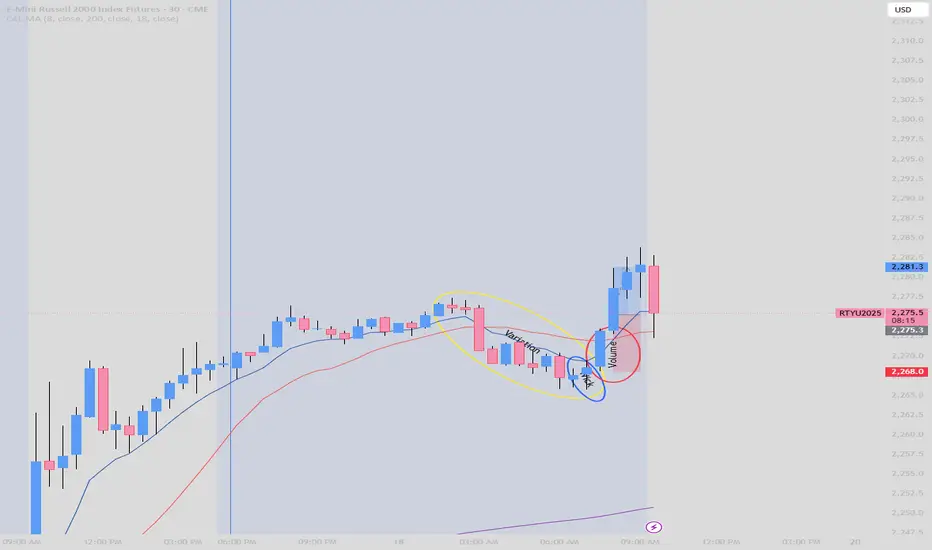
07/18 Trade Russel1. Variation: As we can see over and over again the bears(sellers) were losing momentum so I had to wait for their downfall.
Variation in this strategy in simple words is basically when you see a mix of bearish and bullish candles but on a downtrend. The whole point of the strategy is to buy when there is a trend
reversal and the only way to really confirm the reversal or at least knowing that is coming is to wait for...
2. Candle with a wick that rejects price going down further.
Usually, I like long wicks because it gives me more assurance but since this trade was before NY open
I had to take some risks but not without waiting for the final step....
3. Volume to the upside: When you see a big candle that means that the big boys (institutions like the guys handling your mama's pension) are getting their orders filled because they like to buy low and sell high to guys like me sometimes. Now, I rather buy only when they buy and use their low as a stop loss.
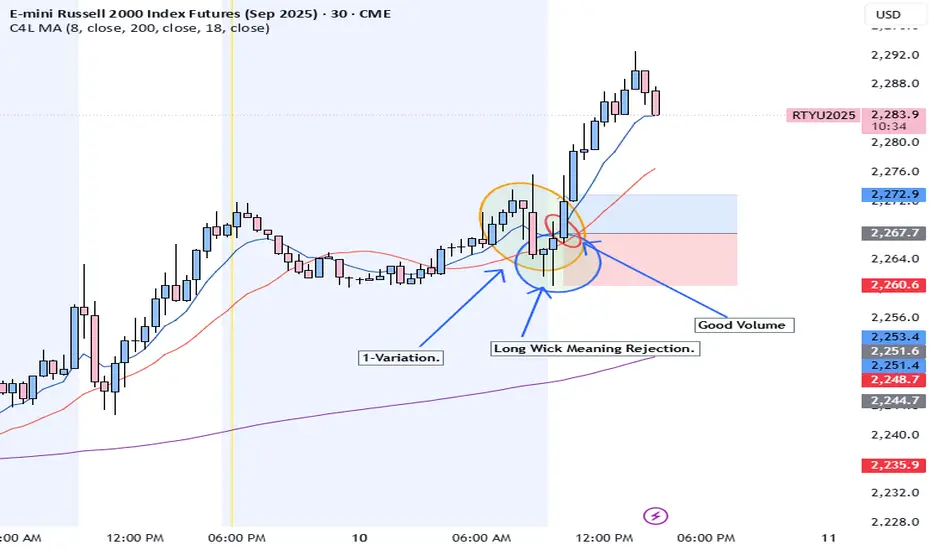
07/10 Trade with RTYUThe strategy is simple.
1. Variation: We need to wait for variation to the down side (bearish trend losing strength). As soon as I saw that the momentum with the Bears ( selling action) was coming to an end I waited for the second step in the strategy which is.....
2. Rejection Wick We need to wait for a candle to reject the bearish trend. So a bullish candle with a long wick could mean that the volume is refusing to go down further and pending buying positions start to kick in. However, we need to find another thing for the last step which is.
3. Confirmation candle: We need to find a bullish candle right after the other one with the long wick. Why? Because we need to know that the wick of the previous candle is going to work as our stop loss. So, waiting for momentum to confirm that now the Bulls are control is key to save you from headaches and fake promises. Usually 2 30 min bullish bar do the trick but sometimes the volume and the nice rejection could lead us to act quicker but proceeding with caution is key.
RUSSELL 2000 STILL IN BUY ZONE!Hey Traders so here we can see that it's building support levels and holding. So imo this is a bullish sign if Nasdaq 100 continues to rise I think it should push Russell higher as Nasdaq normally leads the market.
So if you are bullish make sure you put your stop below a good support level.
If bearish I would wait until market breaks serious support like 2030 or wait until Sept.
Always use Risk Management!
(Just in we are wrong in our analysis most experts recommend never to risk more than 2% of your account equity on any given trade.)
Hope This Helps Your Trading 😃
Clifford

28% Profits Possible for Small CapsIt appears that small caps (and major large-cap stocks) are at a crucial point currently. The price breaking out of the bump-and-run pattern to the upside, combined with a neutral Fear and Greed Index, suggests a potential continuation of the bull run. The target is approximately $2,750, regardless of interest rate decisions. News about war has not significantly impacted the market so far.

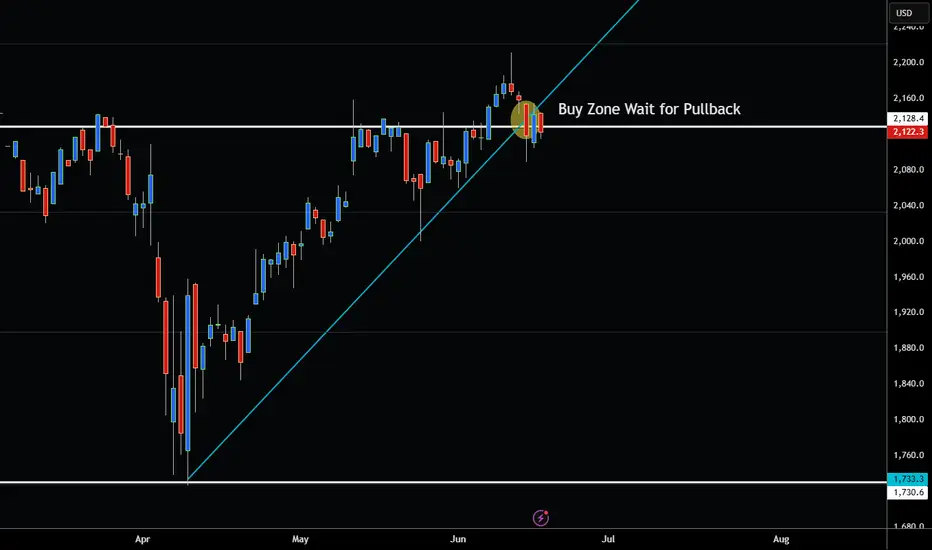
RUSSELL 2000 PULLS BACK TO TRENDLINE SUPPORT ZONE WATCHING! Hey Traders so today continuing previous chart on Russell 2000 so as you can see markets always do eventually pull back most of the time.
So what now?
Well support at 2127 seems to want to hold. FED meeting tommorow of course could change that.
Always expect the unxepected in trading!
I am bullish Russell and the other Indexes also Nasdaq 100 seems to be holding support wanting to lead the market higher. But it all depends what they say in tommorows meeting. If they are hawkish stocks could come down hard. But if dovish probably rally from here.
I do not have a trade recommendation right now but will be watching how market reacts!
Good Luck to those who are Trading Tommorow.
Always use Risk Management!
(Just in case your wrong in your analysis most experts recommend never to risk more than 2% of your account equity on any given trade.)
Hope This Helps Your Trading 😃
Clifford
Russell 2000 Breaks Above 50% Fibonacci Retracement Level!Hey Traders today was checking out the Russell 2000 again and it's bullish momentum is increasing fast.
But it's looking a little overbought now and so are the other indexes it's been an nice leg up so far and Im not saying it can't continue but remember what goes up must come down eventually. In the stock market it's called a correction for those who may be new to trading. So profit taking should bring prices back down before next leg up to all time highs hopefully.
So imo best way to trade it is look for a level that market could retrace back to before buying. the 50% retracement level is normally strong support so I think it market can retrace back to 2105 it looks like a good level to buy back in this market before the bullish momentum continues. Also this is right at the trend line and imo as a trend follower the best place you could ever buy is right at the trendline.
However when trading these indexes I notice that it's normally the Nasdaq 100 that leads the market higher. So if the Russell pulls down but the Nasdaq 100 does not. I would not take the trade but if Russell drops and Nasdaq drops also then I believe we have a good confirmation that market has corrected.
So I would just put an alert on tradingview at 2105.
Will markets always pull back?
No so you might need to make changes if bull run continues. But eventually they all will pullback trading is a game of patience.
So thats about it no indicators needed best indicator of all time is Price Action imo!
Always use Risk Management!
(Just in case your wrong in your analysis most experts recommend never to risk more than 2% of your account equity on any given trade.)
Hope This Helps Your Trading 😃
Clifford

Waiting to see how the market absorbs tariffsThe S&P 500 daily chart on Tuesday has positioned itself to evaluate how the market will absorb the 50% increase in tariffs on steel and aluminum which will begin Tuesday night.

Russell Leads Equities HigherEquity markets saw a positive day today with the Russell leading the way higher being up over 1.5% on the session. For the S&P and Nasdaq, this was the third session in a row with a higher high, and the 200-day moving average has acted as a floor in these markets since the breakout higher on May 12th. CPI numbers came out for Europe and came in worse than expected, and then the JOLTs data released later in the day was a better than expected figure and equites saw prices rise throughout the day.
Outside markets also saw movement today with Crude Oil strength continuing up over 1% on the session and closing out above the 50-day moving average for the July contract. The Crude Oil market has not seen the recovery that equities did from the breakdown in early April, and are still trading below the breakdown point. Along with Crude Oil, crypto futures had a strong day today, with XRP trading up over 4% and Solana and Ether both rising over 2.5% on the session. Tomorrow traders will get a look at ADP Nonfarm Employment Change along with manufacturing data before the critical jobs data at the end of the week.
If you have futures in your trading portfolio, you can check out on CME Group data plans available that suit your trading needs tradingview.com/cme/
*CME Group futures are not suitable for all investors and involve the risk of loss. Copyright © 2023 CME Group Inc.
**All examples in this report are hypothetical interpretations of situations and are used for explanation purposes only. The views in this report reflect solely those of the author and not necessarily those of CME Group or its affiliated institutions. This report and the information herein should not be considered investment advice or the results of actual market experience.

Russell 2000 at Important Resistance Level Hey Traders so today if we take a look at the Russell 2000 it is now at a very important resistance level 2105.
The reason this level is important imo is because it is also the 50 % Fibonacci Retracement Level from last years high. Markets normally retrace 50% of the last big move which it has now done after the big downtrend.
So if market can close above this level that would be very bullish for Russell 2000 and pullbacks would be great buying opportunities. However if Bearish I would wait for break below 1980 before shorting.
Always use Risk Management!
(Just in case your wrong in your analysis most experts recommend never to risk more than 2% of your account equity on any given trade.)
Hope This Helps Your Trading 😃
Clifford

equties FOMC 28/05/25I think rates will be held in FOMC and equities will suffer temporarily. Sells inbound

RUT RTY1! IWM: Trade⚠️ Short Bias on RTYM (E-Mini Russell 2000 Futures)
Price has rejected the premium zone with clear BOS and CHoCH formations, suggesting distribution. Currently sitting below EMA clusters with weak bullish follow-through.
Volume confirms distribution. Targeting the equilibrium zone (1981.1) as next area of interest for a potential bounce or further breakdown.
Bias: Bearish
📉 Target: 1981.1
⏱️ Timeframe: 1H
#RTYM #Futures #SmartMoneyConcepts #TradingView #Russell2000 #VolumeProfile


Russell 2000: Looking Past the Short-term VolatilityCME: Micro E-Mini Russell 2000 Index Futures ( CME_MINI:M2K1! )
On Saturday, May 3rd, Warren Buffett took the center stage of the Berkshire Hathaway annual shareholder meeting. “What has happened in the last 30, 45 days … is really nothing,” declared the “Oracle of Omaha”.
Buffett brushed off recent stock market volatility that has rattled investors over the past weeks. “This has not been a dramatic bear market or anything of the sort,” he said.
In April, U.S. stock market took a deep dive after the start of Reciprocal Tariff against all U.S. trading partners. A few days later, we witnessed spectacular rally with a record daily gain, as a 90-day tariff pause was announced. On May 2nd, the S&P 500 completed a 9-day winning streak, the longest in 20 years.
After a month-long rollercoaster ride, the U.S. stock market is back to where it started. If an investor bought stocks in the beginning of April and then slept for the whole month, he wakes up today and may not even notice any changes in his portfolio.
Sunny Days ahead after the Storm
I concur with Buffet’s assessment that the U.S. economy is fundamentally strong. The supply chain disruptions are painful and will lead to product shortage, higher prices and layoffs in affected industries. However, trade conflicts will be resolved in a few months. The U.S. will be in a strengthening position, making its economy more sustainable.
The U.S. economy contracted 0.3% in Q1 2025, the first negative reading since 2022, according to the Commerce Department. However, the underlying data is much better if you look past the headline.
The formula: GDP = C + I + G + (X - M), where:
• C is consumer spending; I is investment by private business
• G is government spending; (X-M) is the net of exports minus imports
The key driver of the negative GDP is Imports. US buyers front-run the tariffs with massive orders, resulting in a 41.3% increase in imports. We also see a 21.9% gain in investment, primarily the result of US businesses building up inventory with imported goods.
• Imports and Investment contribute -4.83% and +3.6% to Q1 GDP, respectively. Both are one-time events and should not be taken as a long-term trend.
• Consumer spending grew 1.8% in Q1, contributing to 1.21% of GDP. Government spending contracted 1.4% in Q1, contributing to -0.25% of GDP.
Real Story: Q1 constant dollar GDP is +3.5%. By using a price deflator of 3.7%, the government reports a -0.3% “Real GDP at seasonally adjusted annual rates.”
Separately, the Bureau of Labor Statistics (“BLS”) reported that total nonfarm payroll employment increased by 177,000 in April, beating market expectations. The April unemployment rate was 4.2%, in line with expectations.
The above data supports my assessment of a solid U.S. economy. Once we walk past the tariff fear, the stock market will likely resume its growth.
Small Firms May Benefit More from New Trade Policies
A global supply chain helps corporate giants source from the most efficient and lowest cost suppliers. Small businesses may not be so lucky. Take the US textile industry as an example, the BLS data shows that 80% of domestic jobs have been lost since 2000.
The "de minimis" exemption is an import loophole that allows overseas packages under $800 to come into the U.S. duty-free. According to BLS data, e-commerce giants like Amazon, Shein and Temu source 80-90% of their products from overseas.
Closing the "de minimis" loophole and enacting fairer trade deals will help domestic manufacturers. By shielding from low-cost import dumping, a revitalized US manufacturing industry may not be far fetching.
Of the four major US market index, Russell 2000 performed the worst, flat in the last twelve months. Based on my analysis above, the Small Cap Russell index may have a better growth outlook compared to blue-chip indices.
Trade Setup with CME Micro E-Mini Russell 2000 Index Futures
Traders who take a bullish view in Small Cap could buy the Micro Russell Futures (M2K).
M2K contracts have a notional value of $5 times the index value. With Friday settlement price of $2042.70, each September contract (M2KU5) has a notional value of $10,213.5. Buying or selling one contract requires an initial margin of $932 at the time of writing.
The reason for selecting the September contract rather than the more liquid June contract is the time it takes to negotiate trade deals. While some trading partners may reach agreement within the 90-day window, others may not.
Micro Russell futures (M2K, $5) contracts tap into the deep liquidity of E-Mini Russell futures contracts (RTY, $50). As of last Friday, RTY has an open interest (OI) of 457,283 contracts, while the OI for M2K is 41,563, according to data from CME Group.
The risk of long Russell futures is a decline in the index. To hedge against the downside risk, a trader could set up a stop-loss in his buy order.
Hypothetically, a trader enters a buy order of M2KU5 at $2050 with a stoploss at $1950.
• If the Russell goes up 10% to 2,255, the trade will gain $1,025 (= (2255-2050) * 5). The theoretical return is 110% (= 1025/932). This is 10 times bigger than the gain in the underlying index, thanks to the leverage built into the futures contracts
• If the Russell falls 10% to 1,845, the maximum loss with be $500 (= (2050-1950) * 5). This is less than the initial margin of $932 and the trader will not face a margin call. The loss is limited even if your view is incorrect, thanks to the stoploss feature
Happy Trading.
Disclaimers
*Trade ideas cited above are for illustration only, as an integral part of a case study to demonstrate the fundamental concepts in risk management under the market scenarios being discussed. They shall not be construed as investment recommendations or advice. Nor are they used to promote any specific products, or services.
CME Real-time Market Data help identify trading set-ups and express my market views. If you have futures in your trading portfolio, you can check out on CME Group data plans available that suit your trading needs www.tradingview.com

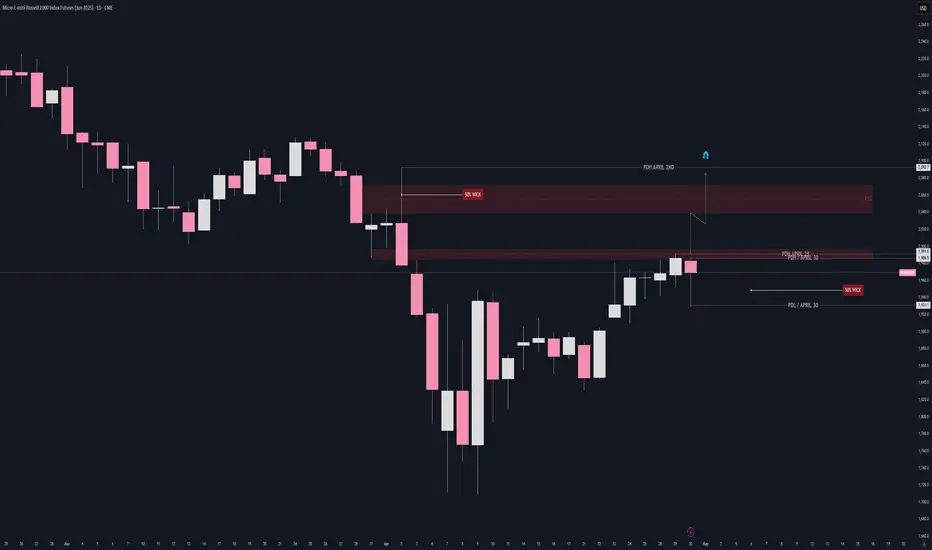
MAY 1ST - BULLISH IDEA - M2K- RUSELLThe market seems to fill the 4 hours gap, and took al liquidity acumulated, now it's has all the path free to visit the daily bearish order block.
Russell 2000: Signs of Topping as Macro Risks LoomRussell 2000 futures look sluggish heading into a week laden with macro risk events. Given the cyclical characteristics of the underlying index, any hint of weakness may amplify U.S. recession fears, increasing the risk of renewed downside for stocks.
Sitting within what resembles a rising wedge and with a possible evening star pattern forming, the risk of a resumption of the broader bearish trend is arguably growing. While bearish momentum has weakened recently, the uptrend in RSI (14) and MACD also appears to be topping out.
A break and close beneath 1917 would generate a setup where bearish positions could be established with a stop above the level for protection. The April 21 low of 1831 screens as a potential target. A break of that would open the door for a run towards the double bottom of 1712 set in early April.
On the topside, a break and close above 1994.8 would invalidate the bearish bias.
Good luck!
DS

RTY Daily UpdateSmall caps got hit hardest by the tariffs, fell the most, went up the least today, and has the furthest to go to fill the futures gap and also the all time high (ATH).
I think RTY (IWM ETF) will outperform ES/NQ (SPY/QQQ) the next 90 days as Trump unwinds all of the tariffs including the 10%. He'll more than likely repeal the China tariffs in the next week or so, which will be the next huge move up.
Trump is gaming the market, just go long with stock or long dated calls.


Russell2000 Futures ShortRTY1! Future is now net Short on the regression break.
I am not taking this trade.

Russell 2000: Squeeze Potential BuildsWith uncertainty surrounding U.S. trade policy about to be resolved and price signals turning bullish, the ingredients for a squeeze in Russell 2000 futures are now in place.
Unlike other stock indices with far larger constituents, U.S. small caps have lagged this week’s rebound—potentially due to recession concerns, which wouldn’t help unprofitable cyclical firms tied to the broader economy.
However, while fundamentals point to downside risks, recent price signals have been more constructive. Monday’s hammer candle formed after a reversal from known support. While Tuesday’s doji signaled indecision, it still closed slightly higher, with strong volumes going through.
While signals like RSI (14) and MACD remain in negative territory, bearish momentum is starting to ebb, suggesting we may be in the early stages of a turn.
Those considering bullish positions could look to establish entries above 1994.8 with a stop beneath for protection. Rallies over the past two sessions have fizzled around 2040, making that an initial focal point. If sellers there are overrun, it could encourage others to join the move, looking for a retest of horizontal resistance at 2132.5.
Good luck!
DS

Futures Gap AlertYM, RTY, and ES all have futures gaps though very small because most of it filled. It took 2 weeks to fill the down gap last time, so I'm not gonna get excited about it this week, but the gaps will fill eventually.
Just letting you know. POsting RTY because the gap is most obvious.
