RTY Daily MFI overboughtSomething I noticed while flipping through some charts, RTY1! daily MFI is overbought along with GM, PCAR, YM1! (Dow futures), Dow components like WMT, CAT, YNH, etc along with XLF (financial ETF).
Definitely not chasing a Fed pump even if my 3 hr indicators show oversold. My favorite stocks are overbought, that's a signal to take a pause. Will be shorting when 3 hr indicators go overbought.
M2K1! trade ideas
RUSSELL 2000 Heading Lower, Head and ShouldersRUSSELL 2000 Heading Lower, Head and Shoulders chart pattern will drive bearish continuation.

Russel friend of BTCThe Russell Index has a strong correlation with BTC. Many people look at SPX and Nasdaq first. But we think we need to take a look at this chart. If you overlay a chart of bitcoin on a chart of this index, you will understand everything. But this analysis is not about that. At the moment, Bitcoin, along with Russell, is at an important stage in moving forward. We see a global downward trend line, which we are now inside. The price on 1d is formed by equal highs with the liquidity pool. RSI shows weakness on 1d. At the time of writing, the price eliminates liquidity and fills in market inefficiencies. This could serve as a potential turning point. At the same time, Bitcoin is also showing signs of weakness. We believe that at the moment there is a high probability of a reversal formation. Watch the price.

Market leadership firmly switched from nasdaq/s&p to Russel/Dow 2022 is story in change in market leadership.. Dow and Russel new leaders. Pairs trade lookback.

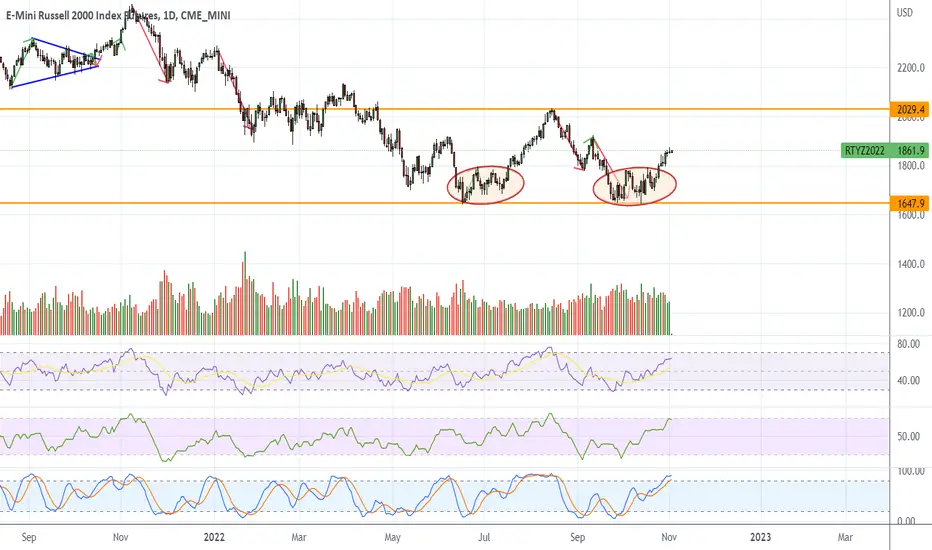
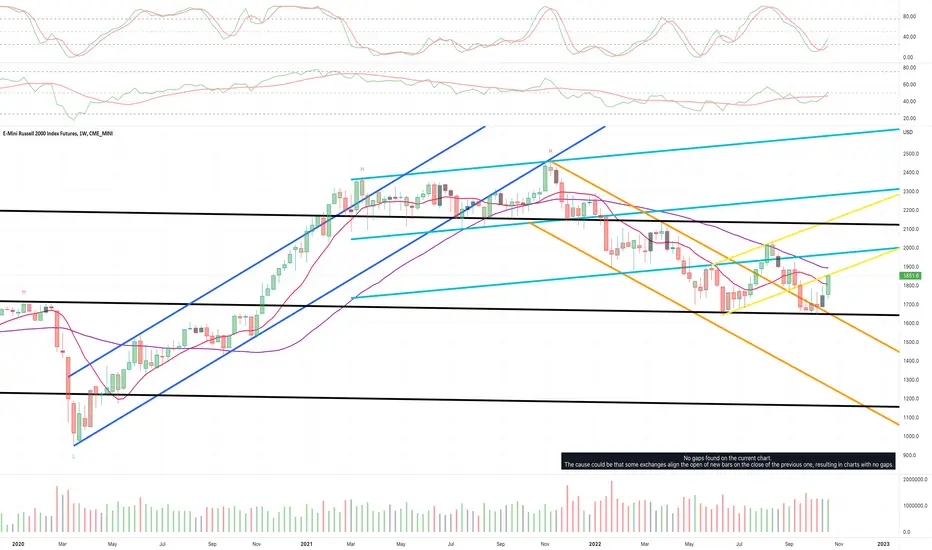
RTY1! - Weekly Market Update, 10/31Russell 2000 has overtaken its 50 day SMA and is now testing the YELLOW overhead resistance channel structure.
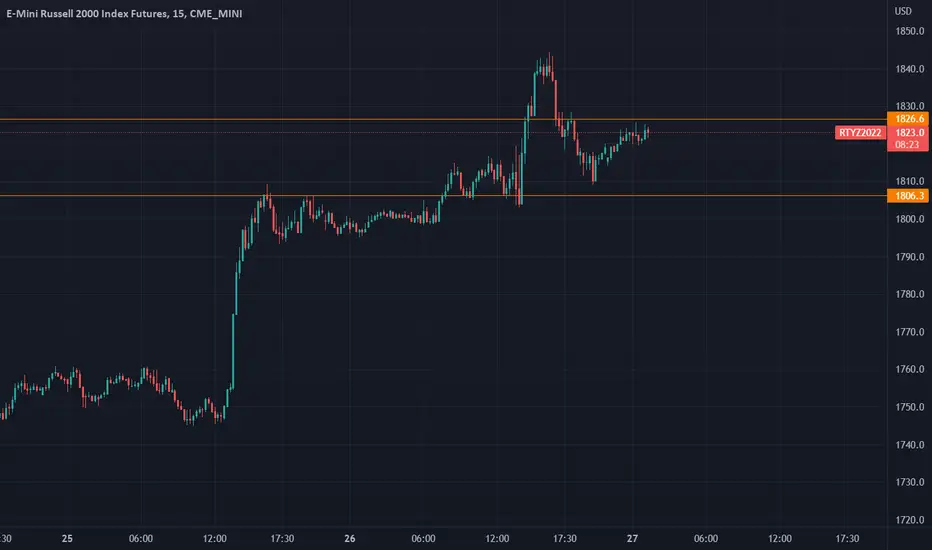
Russell1806 Target Achieved..New Pattern DevelopingTechnical & Trade View
Russell 2000 (e-mini futures contract)
Bias: Intraday Bullish Above Bearish below 1785
1806 Target Achieved..New Pattern Developing
Technicals
Intraday 1785 is primary support
Primary upside objective is 1882/92
Failure below 1780 opens a test of 1760 H4 Value Area High
20 Day VWAP bullish, 5 Day VWAP bullish

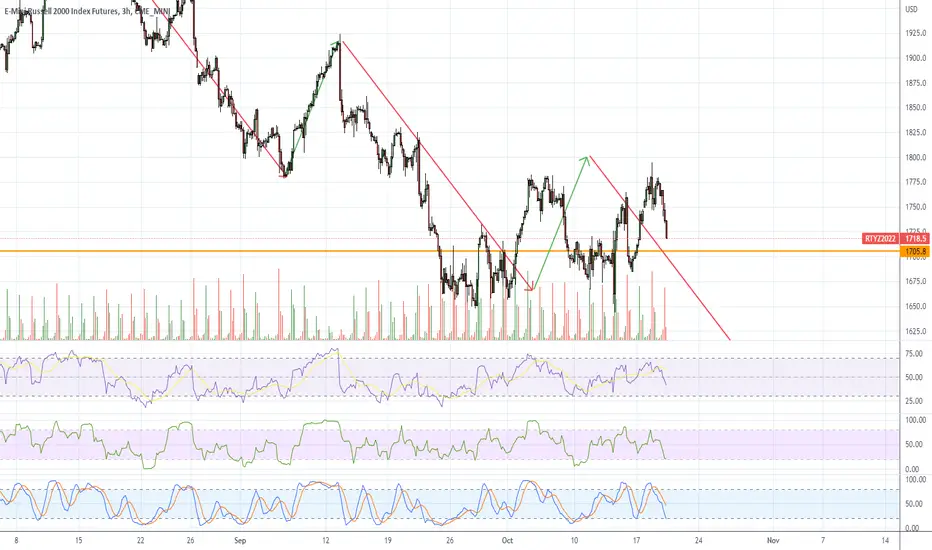
E-MINI RUSSELL 2000 INDEX FUTURES UpdateAs you can see, the price moved close to the resistance level but failed to break it at the moment
RTY UpdateWay overbought, but following my 4 day short squeeze rule as a lot of garbage stocks actually hit bottom Monday so that means short on Friday....
Just sitting around watching for now. Wouldn;t surprise me if we see a dip tomorrow though

E-MINI RUSSELL 2000 INDEX FUTURESSupport and resistance symbols are shown .
This support and resistance was very important before .

RTY1! - Weekly Market Update, 10/24Russell futures have bounced off of the long term BLACK channel supporting this rather aggressive bear market rally these past few week.
The YELLOW channel overhead will act as resistance along with the 50 day SMA.
The market these past few weeks were broadly oversold which is believed to support this relief rally.
All technical indicators point to a longer term bearish scenario at this time, at least until we start to see some technical and fundamental changes.


RTY UpdateAlgos are clearly still trying to pump the market, look at MFI.
Going to wait until MFI gets overbought before getting into any big trades. SHould happen Tuesday I think

RTY UpdateWound up being a 4 day short squeeze after all, like I said last week, I changed my focus to bankrupt companies and snagged W puts this morning. Closed out my winners and losers (from last week) and put the profits into W puts at a lower strike. Just some light trading in this weird market.
I think we could get a bounce here because ES and RTY MFI are oversold. Yields are exploding again and FDAX looks bearish so we may get a gap down tomorrow anyways.
TSLA earnings tonight. Focus should be on bankrupt companies, not gonna play the bigger companies.
will small caps save the market or fail at resistancerussel is making its high, and the question is will it print this and reverse following the rest of the market lower, or is this resistance breaking on a second touch to melt the market up with more squeeze. right now the hourly is most important. as long as were below nadaraya watson estimate it feels like price belongs toward bottom of envelope and lower horizontal, and if we bounce we should go back toward estimate or upper horizontal.

APPLE HAS BEEN ON OVER ALL BEARISH SINCE NOV.2022The continued fall in price will continue until no nearest future, leading to the current overall price target to 1333
Traders would just scroll down to lower timeframe to take the advantages not unmindful of the zones to keep off

RTY1! - Weekly Market Update, 10/17The indices had a rather wild week, the technicals are approaching being oversold. A bounce from here would not be unexpected as there is some consolidation occurring as price is currently hovering around the June low's area.
I'd like to see the market cycle back to an area of being overbought and finding a low risk confirmed area to short from. At this time I'm looking for thing's to setup again for a desirable entry.
I've adjusted support and resistance structures accordingly.

RTY LongsLooking to buy RTY for a run to the previous high. This is on the back of a bullish BoS on the 4H. Weekly bias is bearish and Daily is bullish to 1843.5.

RTY1! - Weekly Market Update, 10/10Russell futures have settled slightly above their June lows and are approaching BLACK channel support.
Support and resistance structures have been adjusted accordingly for your reference.

Likely: Russell & S&P Spread to Favor Russell ConsistentlyI think energy stock composition and dividend yields will favor the Russell in the near term based on this MACD signal, potential triangle and Elliott Wave count.


RTY UpdateThere's a good chance the market just whipsaws the next few days so watch out. See highlighted area

RTY UpdateOverbought on MFI and RSI on my short term chart, NQ and ES RSI are just barely touching overbought so gonna wait until tomorrow to short.
Slept in because I missed the long boat yesterday, lol. No positions. At this point it's a bit late to chase the pump.
