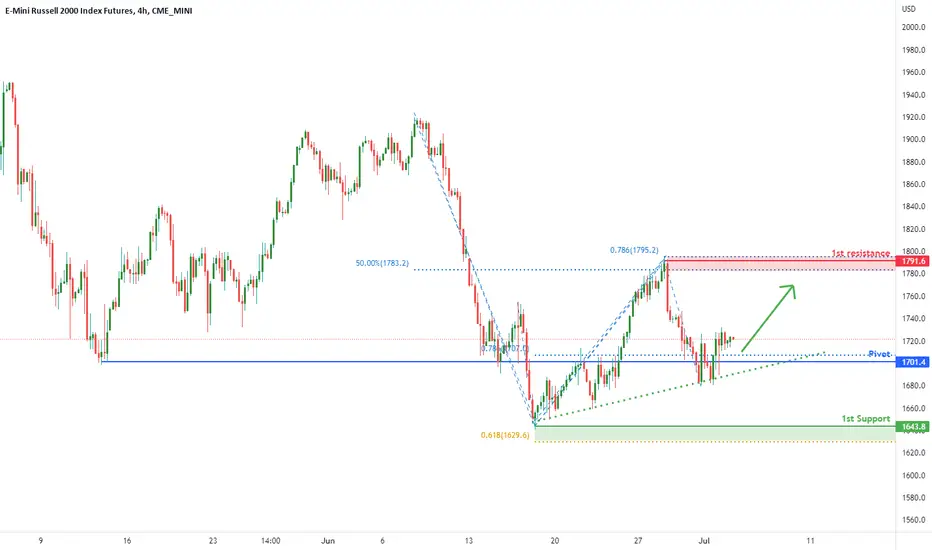
Potential Bullish ContinuationTitle: E-MINI RUSSELL 2000 INDEX FUTURES (RTY1!), H4 Potential for Bullish Rise
Type : Bullish Rise
Resistance : 1791.8
Pivot: 1701.4
Support : 1643.8
Preferred Case: On the H4, with price moving in an ascending trendline, we have a bullish bias that price will rise from the pivot at 1701.4 at the overlap support in line with the 78.6% fibonacci projection to the resistance at the swing high at 1791.6 in line with the 50% fibonacci retracement and 78.6% fibonacci projection.
Alternative scenario: Alternatively, price may break support structure at the pivot and drop to the support at 1643.8 at the swing low in line with the 61.8% fibonacci projection .
Fundamentals: No major news
M2K1! trade ideas
M2K Micro E-mini Furture Russell 2000Day Trading 2022-07-01
M2K, 1 contract, by 15 minutes period
Each point value represents 5$.
1) Before 9h30, the signals at the bottom are trending up, positioning a Buy at the open. This trade is closed under the Bollinger High Band.It is providing a move of 13.8 points * 5$, for a winning trade 69$.
2) The second trade is a Short ignated by the inversion of the signals at the pane below. It is closed just over the Bollinger Low Band concurrent with a previous support. This trade produces 22.6 points * 5$ giving +113$.
3) and 4) These trades (Long and Short) are placed during a flat trend. The trades are played between moving averages, Ma200 (orange) and combined Ma50-100 (blue and green). They give : (10.0 points +7.4 points ) *5 for 87$.
5) This last trade is a Long one as the signals at the pane below are starting up from the bottom. It offers a win of 25.9 points *5$ for 129$.
Total for trading 1 M2K contract: +398$

RTY1! - Weekly Market Update, 7/5/22Index Futures traded rangebound this past week, locked between support and resistance.
No actionable ideas at this time, while the bias remains to the short side.
I've adjusted support and resistance structures accordingly for your review.

#1 - Russell,Nasdaq & Dow jones tuning bear market Russel, Nasdaq & Dow Jones Futures are the best indicators of the economy
Russel is the fastest one
Nasdaq is the 2nd
Dow Jones is extremelly manipulated to keep people buying deep
The rainbown system with those 3 specific EMAs have been tested for years and can be used with ANY chart. The weekly one is the best to evaluate markeet direction. Daily is good for daily opeartions that are closed before the market closes. don't leave your money sitting there. Overnight manipulation is huge
Rainbown dow is formed and now prices are free to move down hard. However, Nasdaq and Dow Jones are still in process. Once all of them is formed we will see the largest falloff in the history of US stock market

Capitulation ZoneMarket has been grinding down slowly for months, breaking historical records left & right, yet there has barely been any trace of volatility ramp up or capitulation. However, we may soon be entering that zone when it makes that move that, 99% of investorsm traders, bulls, bears and pigs alike, do not see coming. In such an aftermath, only the stocks with strong foundations will be left standing.

RTY UpdateFollowed my 15 minute rule and flipped my puts. DCT was a big winner, another $3k day. Good week for me despite missing out on the Friday pump and the Tuesday dump, lol.
RSI now touching oversold with positive MFI divergence. Note how it hit my overlay target even though the chart pattern was a bit different. I told everyone earlier this week not to go long until RSI went oversold. We're there now, but I flipped my puts and did not go long. Maybe this afternoon for a small play.
100% cash now on all accounts, closed my earnings play.

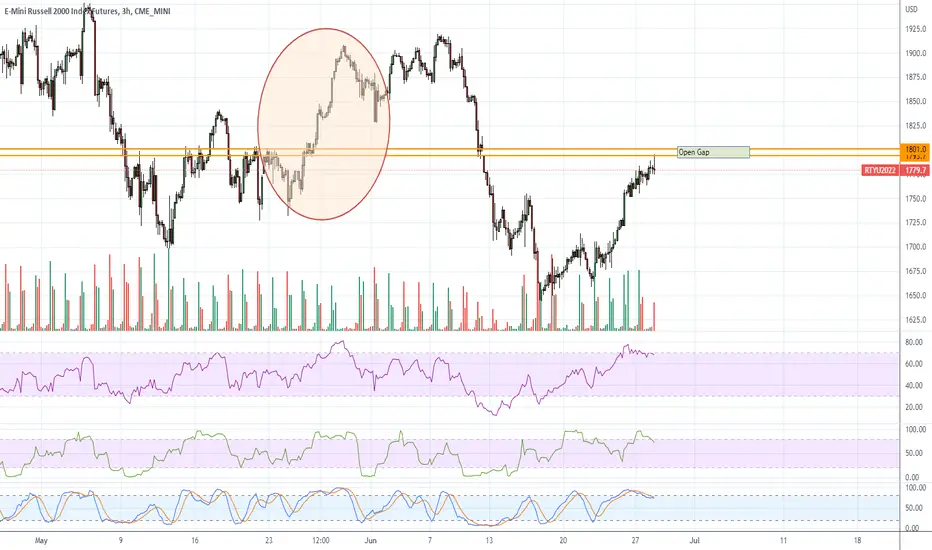
RTY New OverlayMarket tanked today on Consumer Confidence numbers released at 10am. Wasn't paying attention to the news since I flipped my calls at 9:45.
RTY didn't get the gap fill so you know it has to try again, lol. I overlaid the last gap fill pattern, down tomorrow, more whipsaw this week then another gap fill attempt next week.
Bad news won't keep the market from getting the gap fill, heck, they tried to pump it a week after the Fed said possible .75 hike in July.
We might see some serious whipsaw for the rest of the week, I wouldn't chase the market. 4th of July week is usually pretty bullish, but then again this market isn't following any rules.
Might roll into some calls again when RSI gets oversold, we'll see.

Potential Bullish MomentumOn the H4, with price moving in an ascending trendline and bouncing off the ichimoku cloud, we have a bullish bias that price wil rise from the pivot at 1702.4 at the overlap support in line with the 61.8% fibonacci retracement and 78.6% fibonacci projection to the resistance at the swing high at 1791.8 in line with the 50% fibonacci retracement. Alternatively, price may break support structure at the pivot and drop to the support at 1642.8 at the swing low in line with the 61.8% fibonacci projection.
Any opinions, news, research, analyses, prices, other information, or links to third-party sites contained on this website are provided on an "as-is" basis, as general market commentary, and do not constitute investment advice. The market commentary has not been prepared in accordance with legal requirements designed to promote the independence of investment research, and it is therefore not subject to any prohibition on dealing ahead of dissemination. Although this commentary is not produced by an independent source, FXCM takes all sufficient steps to eliminate or prevent any conflicts of interest arising out of the production and dissemination of this communication. The employees of FXCM commit to acting in the clients' best interests and represent their views without misleading, deceiving, or otherwise impairing the clients' ability to make informed investment decisions. For more information about the FXCM's internal organizational and administrative arrangements for the prevention of conflicts, please refer to the Firms' Managing Conflicts Policy. Please ensure that you read and understand our Full Disclaimer and Liability provision concerning the foregoing Information, which can be accessed on the website.

Russell 2000 Futures Next Leg Down -10%Russell 2k $RTY1! broke below the 200 EMA on weekly and failed to regain 1800 as support.
As the canary in the coal mine, the Russell 2000 comprises of the 2000 smallest stocks of the Russell 3000 (broad capitalization-weighted stock market index that seeks to be a benchmark of the entire U.S stock market) and provides a solid bellwether for forward facing trends.
Next move is a 10% markdown from 1700 to 1550. From there we will likely see a failure to regain 1600. With Q2 earnings coming and early signs of margin compression in the face of rampant inflation ($NKE earnings revealing some weakness), expecting to see 20 EMA crash below the 200 EMA with the 50 EMA following closely behind.
On balance volume reflecting a downtrend that really gained momentum in late March / early April with no sign of reversing in the near-term.

RTY MFI OversoldMFI went oversold premarket but RSI did not.
Looks to me like it's gonna whipsaw the next few days then a rally next week when NQ challenges the green channel line again.

Small Caps Russell 2000 Looks Attractive: Elliott WavesHello traders and investors, today we will talk about small caps Russell 2000, in which from Elliott wave perspective, we see a completed 7-swing complex correction from the highs.
Russell 2000 topped and completed its 5th wave of a five-wave bullish impulse already back in November 2021. Since then we can see slow, choppy and overlapped wave structure that we see it as a correction within uptrend. It's ideally a complex 7-swing A-B-C-X-A-B-C, called also a double three W-X-Y corrective pattern.
A Double three is a sideways combination of two corrective patterns. It's a complex Elliott wave that is subdivided into three minor waves W, X and Y. Its internal structure is (3, 3, 3). In effect, the number three relates to corrective waves, therefore the structure (3, 3, 3) indicates that the WXY wave pattern is composed of three distinctive corrective waves.
• A combination of two corrective structures labelled as WXY
• Wave W and wave Y subdivision can be zigzag , flat, double three of smaller degree, or triple three of smaller degree
• Wave X can be any corrective structure
Well, if we are on the right path and if Russell manages to recover back above 1920 region and resistance line of a corrective channel in current risk-on sentiment, then we can easily confirm support in place and bulls back in the game.
All the best!
If you like what we do, then please like and share our idea.
Disclosure: Please be informed that information we provide is NOT a trading recommendation or investment advice. All of our work is for educational purposes only.

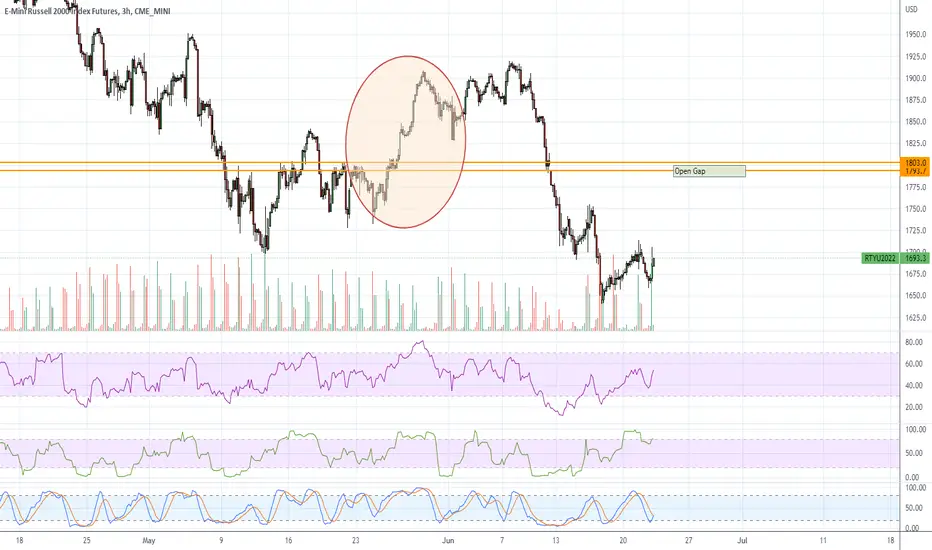
RTY UpdateRTY still hasn't filled the gap.
Just like yesterday there's a rotation from tech to small caps since it needs the gap fill. I just don't see the market tanking until this fills but i could be wrong. It has happened, lol. I was thinking about shorting retail as soon as RTY filled the gap, will be a bit disappointed if I missed teh boat here.
I'm all cash anyways after flipping my calls 15 minutes after open. Apparently that was a very wise decision.
RTY UpdateRTY still hasn;t filled the gap so despite the fact that it's overbought, I'm not feeling bearish quite yet.
As soon as this fills I think it's all over. Probably whipsaws then goes back down.

RTY UpdateMFI keeps going overbought without dropping which is usually an indicator of a melt up about to happen
NQ is already pretty close to filling the gap, but RTY needs to go pumptarded to fill its gap. I think garbage stocks are going to pop before end of next week, because there's another Fed meeting in July so they go to get that gap fill sooner than later.
Might seem odd coming out of my mouth, but go long on your favorite garbage stock, lol. BTFD!
RTY1!6.20.22 RTY1!: how to use the time frames, etc.......................................................

Market Overview RTYMarket Overview RTY
We are at a critical area where the BULL's could take control to push the pair Bullish as we have Support area and Previous Resistance cross road where the Market normally U-turn from .
Long Term we Bullish on this pair with a long term target of 3245.6 .
Monthly Take Profit Target 1: 2751.5
Monthly Take Profit Target 2: 3245.6
Stoploss : 828.8

RTY1! - Weekly Market Update, 6/20/22Russell Futures have triggered a short opportunity based upon last week's price settlement. I've detailed my ideal entry, stop loss and targeted areas on the chart.
I've also updated support and resistance structures for your reference. Wishing you a blessed and profitable week ahead!

Elliott Wave View: Russell 2000 (RTY_F) Sellers Remain in ControRussell 2000 (RTY) broke below previous low on 5/12/2022 at 1698.3 and opens up a bearish sequence favoring further downside. The entire decline from 11/8/2021 high is unfolding as a double three Elliott Wave structure. Double three structure is an 7 swing corrective structure where W, X, and Y subdivides into 3 waves. Down from 11/8/2021 high, wave ((W)) ended at 1892.4, and rally in wave ((X)) ended at 2137.7. Index then extended lower doing another double correction in wave ((Y)).
The 60 minutes chart below shows the decline from (X) on 6/7/2022 high is unfolding as an impulse Elliott Wave structure. Down from 1920.03, wave ((i)) ended at 1880.28 and rally in wave ((ii)) ended at 1905.50 Index then extended lower in wave ((iii)) towards 1690.14. Rally in wave ((iv)) finished at 1755.00 and last push lower to complete wave ((v)) and A ended at 1640.90. Then we are expecting a pullback in 3, 7, or 11 swing high in wave (B) before the decline resumes as far as 6/7/2022 pivot at 1920.03 stays intact. Potential target lower is 100% – 161.8% Fibonacci extension from 11/9/2021 peak at 1217 – 1485.

Russell 2000 trading below Quarterly and Yearly VWAP. Russell 200 trading on bottom band of monthly VWAP and below Quarterly and Yearly with bullish divergence on multiple time frames and multiple gap fills to upside. Time to go long for a bounce.

Remember December 2018?5 year yields are even higher now, plus Powell is doing 3 rate increases in a row
- 0.5%
- 0.75% (yesterday)
- 0.5 or 0.75% July
I'll let you decide where small caps are going. My guess? Same level as December 2018, and that's if we don't wind up in a recession.
Close to oversold on the weekly though


RTY MFI almost overboughtGeez, it would have been an easier trade if they left everything oversold until the Fed meeting.
All indicators neutral except RTY MFI is almost overbought. ES overlay suggests we could see another dip before the meeting tomorrow.
Flipped my COIN puts on open for a wash this time because I saw the Euros were pumping futures. Staying cash until tomorrow morning, might just wait until after the press conf to confirm the next pump, lol.
Keep in mind there is still a gap above.

Russell2000 Pivotal Equality TestIn this update we review the recent price action in the Russell200 futures contract and identify the next high probability trading opportunities and price objectives to target
