RTY MFI oversoldLooking like an inverted H&S. I would expect small caps to fill teh gap before heading up though because they usually do
M2K1! trade ideas

RTY UpdateFunny, NQ was the only index to go overbought but small caps look weak AF. Garbage stocks dropping again if you're a bearish trader.

The Curious Relationship Between the /RTY and the /NKDThe Russell 2000 futures and the Japanese Nikkei futures have correlated really well for months. I think if one breaks, the other will follow.

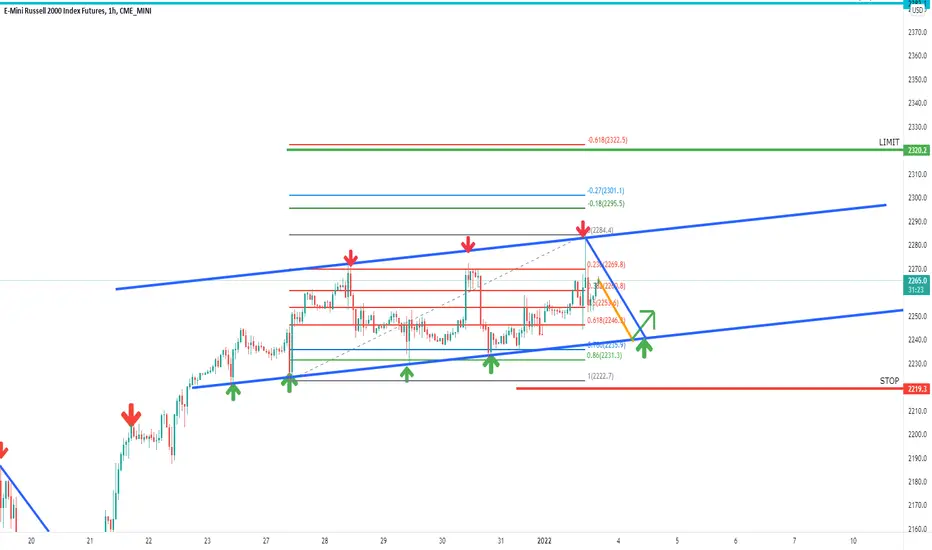
RTY One Hour Long +1,412 TicksThe RTY one hour time frame is in a down trend.
The market is making lower lows and lower highs.
The larger time frame shows the market should
push bullish towards the monthly up future
resistance price point 2314.5. It will be a good idea
to wait for the one hour time frame to break the
down trend line and enter into the buy zone
before looking for buying ideas.
Entry: Counter trend line break bullish in the
buy zone.
STOP: In the sell zone
LIMIT: 2314.5
Once or if the market enters into the buy zone.
It will be a good idea to turn to the five minute
time frame and to look for tunnel trader long /
destination trader long ideas towards 2314.5

RTY: some ways to go.Markets are getting jittery with the fed talks and all the bad news. But this also can bring in a flash rally with any optimistic news. RTY is my leading indictor to what is coming for the broader markets. Here is my thoughts on what I see now.

watching for short entry in to Tzatry watching for a short entry on Tza
god it's annoying TV requires a lengthy description. These charts are time-consuming enough.


Small Caps are Close to a Local Bottom Most Likely (2 cases)Small Caps are Close to a Local Bottom Most Likely
With 2 cases, one is more bearish/bullish than the other...

Small Caps are Close to a Local Bottom Most LikelySmall Caps are Close to a Local Bottom Most Likely
Let's see if Monday will be the day it stops sliding

RTY UpdateMFI almost overbought, much like NQ
Don;t chase the pump, probably should be looking at cashing out soon if you;re long. I would not hold a long position over the weekend
There is the chance that RSI also need to go overbought but I wouldn;t count on it

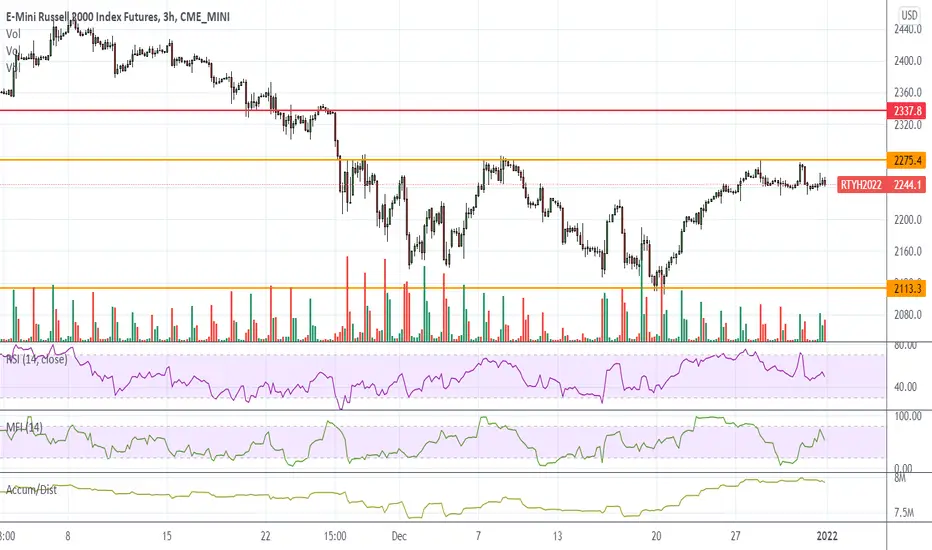
RTY - Millennium Tower IndexThe Russell 2000 continues to expend energy in a large Range which
remains in a weakened condition.
2282.50 was rejected.
There is little to support this as the Parking Lot is being vacated.
Small to Mid Caps are not faring well in the present Environment
with little reason to Position for 2022.
Slowly Sinking into a LArger Sell is ahead after the next Retracement.
___________________________________________________________
RTY / M2K will Ourperformi to the Downside.

E-mini russell 2000 buying opportunityRTY in an uptrend it will be a good idea to wait for a low price at a known level of U-turn on the trend line wants or if we get a counter trendline break we can execute our buy trade towards price point 2320.2 fib 0.618 ext.
ENTRY===counter trendlin break
LIMIT=== 2320.2
STOP===2219.3
TRADE SAFE
Best places to go long or short the RussellThe Russell is even cleaner than the Nasdaq. Two major buy / sell areas on the chart. So far the Russell has been playing the game of chop. Sweep the lows, sweep the highs and move in the other direction. The same way we had a failed breakout, we could get a failed break down.
Best place to sell 2310-2360. Resistance/Gap combo and the real direction for now is down, so it is with the main trend.
2200 & 2080 are decent for short term trades. As we go down they are good for a bounce. If they get broken they are good to put shorts if the market bounces from lower.
Best place to buy long term is 1980-2030. Extreme support combo with 1. Untested breakout / gap, 2. Key Bollinger bands, 3. 400 DMA

Meanwhile, small caps...Small caps appear to be melting up, the index tends to fill gaps and there's a gap at my red line. Note that it's an index gap and not a futures gap so there's no guarantee on this one. Also, it's tagging along the overbought zone so it can tank at any time.
I'd stay away from garbage stocks though if you;re going long


RTY UpdateMFI hit overbought, market really seems to be having issues pumping small caps with futures. Could just be an EOY thing, we'll see next year
RTY UpdateOverbought on RSI with MFI divergence but I think it goes up until MFI gets overbought. Probably a 3 day pump and short squeeze again. (Just guessing at this point) Staying out until Monday afternoon. I'd rather short garbage than go long on them.
Gonna be a ton of short opportunities next year I think

$RTY hourly lookLooks like our wave 5 PT will end up being the ATH AVWAP - from there likely get the wave 2 flush unless serious market strength busts over it. 200 extension confluence on 2260 area so that is likely the are we see a pullback imminent. Soon BTD on 3 swings for wave 3 up

RTY / Russell - A look at daily chartCount not the clearest for me here - but look at the demand zone and look at the indicators on daily here. Massive bull divergence, macd bull cross, survived demand zone retest now 6 times!! All looking good. Looks like rejection likely here at the ATH AVWAP - no surprise - this should just take us down for a 2 and then a massive wave 3 ripper will be happening. Dips on 3 swings a buy here imo

Trading Range on Nasdaq 100 FuturesWe are in Trading Range on the Russell 2000 Index Futures.
Like and Comment will be hugely appreciated, thank you so much for your support.
See other ideas below too!
RISK DISCLAIMER:
Trading Futures ,Forex, CFDs and Stocks involves a risk of loss.
Please consider carefully if such trading is appropriate for you.
Past performance is not indicative of future results.
Always limit your leverage and use tight stop loss.

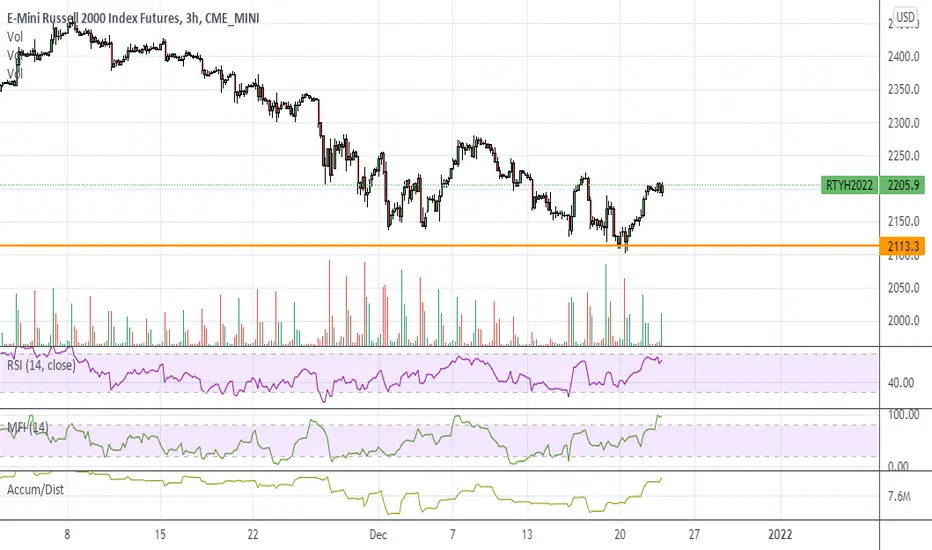
Elliott Wave View: Russell (RTY) Extends LowerShort-term Elliott wave view in Russell (RTY) shows a lower low bearish sequence from November 8, 2021 high. Decline from November 8 high is unfolding as a zigzag Elliott Wave structure where wave ((A)) ended at 2136.8 and rally in wave ((B)) completed at 2279.83. The Index has extended lower and broken below wave ((A)) suggesting wave ((C)) lower has started. The internal subdivision of wave ((C)) is unfolding as a 5 waves impulse.
Down from wave ((B)), wave 1 ended at 2196 and rally in wave 2 ended at 2227.10. Index then resumes lower in wave 3 towards 2160.10 and wave 4 ended at 2165.9 as a triangle. Final leg lower wave 5 ended at 2130.10 and this completed wave (1). Correction in wave (2) ended at 2227.60. Index then resumes lower in wave (3) as another impulse in lower degree. Down from wave (2), wave 1 ended at 2102.30. Rally in wave 2 is in progress to correct cycle from December 16 high before the decline resumes. Near term, as far as pivot at 2279.83 high stays intact, expect rally to fail in the sequence of 3, 7, or 11 swing for further downside.

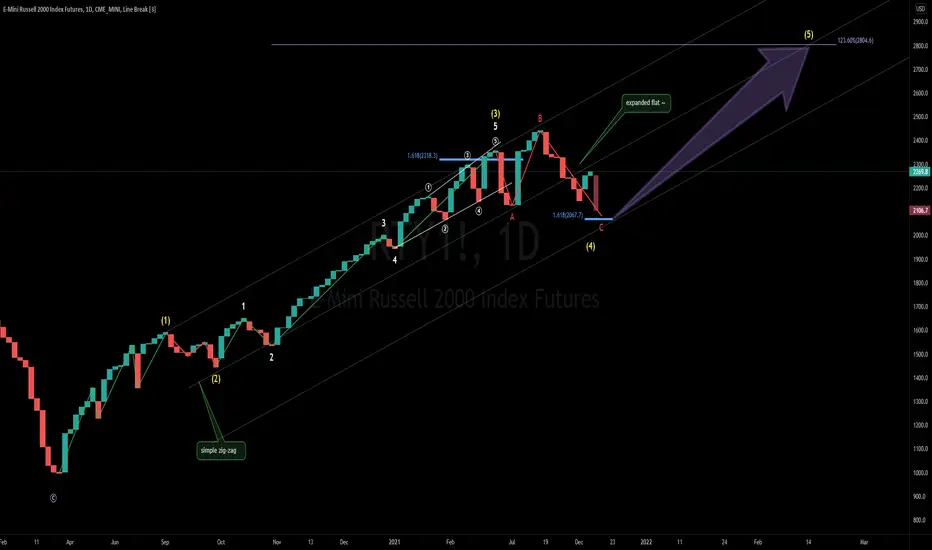
"most fear the unknown" iwm updatemost fear the unknown, and in turn they stay away from it,
i walk into the unknown with confidence, knowing there is always opportunity ahead.
----
iwm\rty (small caps) look to be on the verge of finding a big local bottom in this local region here through an expanded flat.
the law of alternation states: "if wave 2 was a simple zig-zag, then wave 4 will have to be a complex correction".
that's precisely what we're seeing here, a little complex correction phase to really shake out the weak hands out of this wicked market.
-----
wave 4 target = $2067.70
wave 5 target = $2800