M2K1! trade ideas


RTY PennantJust in case anyone missed this pennant forming. Two possible upper trendlines. Im inclined to the red one since rates are going up, but just keep your options open. Small caps ought to deflate IMO, junk that has been propped up hardest by the Fed.

New trading strategy upgrade - Russell 2000
Hi traders, this is my personal trading idea only. Please give an AGREE/ LIKE, my trading strategy is Price Auction - using Chart only, your comments are highly welcome. My chaos drawing is not to predict and guess the further, it is my plan where we are on the chart and how we shall trade on what we see. Good luck guys.

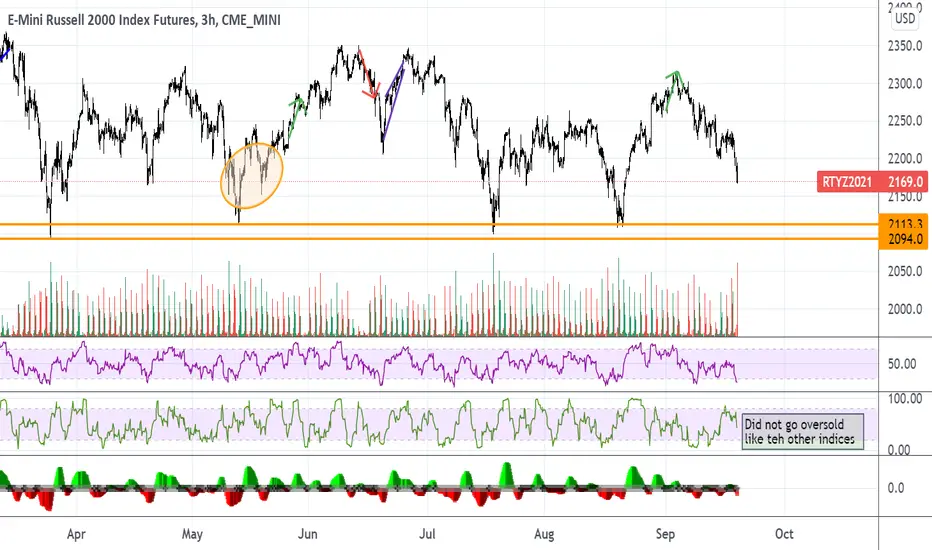
E-Mini Russel 01 OCTOBER 2021 Take a look at the daily and you will clearly see that its been stuck in equilibrium for some time (approx 23 days).
In this situation you are best to set alerts at the extremes of the trading range (as i have done with the red and green horizontal boxes). When and if an alertis triggered you can check to see if a intraday set-up is materializing.
However, there is a plethora of other options to trade. Take a look at other future. S&P is hittingh a LOT of demand and it appears as if they are positioning to the long side for another leg.
Keep your trading easy. There is no reason to make it more challenging that it already is. Trading within a trading range is higher risk and requires higher skill (IMO).. even if you are highly skilled and patient, why mess with something risky? The goal is to make money... period.
You wont get any cool points for taking more risk. Its your wallet at stake, no one else's.
Sources of education:
Richard Wyckoff
Tom Williams Volume spread analysis VSA/ Master the Markets
Pete Faders VSA*
Sam Seiden (supply and demand)
Read the ticker dot com
Wyckoff analytics
PsychFX
MentFX
Element 15 trades (bitchute/odessy)
Avoid buying into weakness/supply/resistance
Avoid selling into strength/demand/support
Avoid entry when price is in middle of a range (phase B)

RTY whipsaw continuesStill doing the rangebound whipsaw, looks to me like it goes overbought by Tuesday and drops back down.
Small caps have a tendency to fill gaps (on the index, not futures) so maybe it fills the gap then cycles back down. If anyone has a good way to predict this whipsaw, I'd like to hear your theories.

Russell200010.1.21 RTY1! found a bottom, moving higher: Bobby's Homework Assignment. Review the entry strategy.

RTY UpdateLooks to me like a reversal coming tomorrow when RSI goes oversold. Didn't think it would rally without going oversold first, and I was right...
Needs to go down tomorrow, then we get a reversal.

RTY Going OverboughtOversold > Overbought > ?Oversold again?! Probly will hit the R line at 2270 Friday IMO. Buying panic. V-shape, who knew?!
No position yet, lost enough second-guessing this move already. Sheesh!

Russell 2000 - H&S Confirmed - Fib RulerThe Russell confirmed an H&S with quick support after the break. Russell 2000 on watch in concert with NAS and the 10 Year Note.

Major Market Dashboard - in 3D The distribution is currently underway with SPX breaking it's bear flag to the downside. NAS and the Russell are showing mirrored patterns; NAS is working on saving a right inverse shoulder and Russ challenging the neckline of a H&S


Russell 2000 chartJust some levels I'm watching for long and short entries. Tried some scalps that didn't work out yesterday and today. Waiting for the next move up or down.

comparing two indexes 9.24.21 Comparing the ES and Russell2000. Also a warning about the dollar and a caution about gold.........................................

Small Cap SharkNot a big believer of harmonic trading, but there is the pattern. Money flow weakens.
These patterns supposedly result in a 50% pullback, as shown. Not advice; GLTA!

RTY in (v) of (III), in sell zoneChart says all. Sell in the band between S/R. not advice, just an idea; GLTA!

Bull trap or will it hold. RTY just completed 3 measured moves up, bringing price over first important resistance, but will it hols? This is all happening AH and PM, so I would not rule out just another bull trap.
Looking at a longer term chart almost all previous correction consisted of 3 waves down. This one we are experiencing just now had only 2 legs, so I'm still looking for a 3rd one below recent lows.
In case of a dip, I would be looking for support around 2126.

RTY UpdateAll other index futures went oversold except RTY MFI as mentioned last night. It actually hit overbought again, lol.
If you're gonna play the bounce, I suggest staying away from small caps. I'm guessing gap up and tank tomorrow for small caps, it's too close to support not to test it.
RTY Daily Range Looking For Long IdeaThe RTY daily time frame is in a large sideways
movement. The market hit resistance price point
2302.4 and is now falling towards support price
point 2113.3. It will be a good idea to look for a
bullish U-turn the closer the market gets to
the daily support price point 2113.3.
I plan on turning to the one hour time frame
and looking for a bullish trend to form near the
daily support.


RTY- the downtrend goes on.I do not barely ever hold position when Friday close over weekend. But this time I did this and I also even added to my position close to close Friday. So I carry quite big position. I do this because all my technical analyse tell me market makes big down move on futures open. I admit I won't this weekend because always there is chance I to be wrong. But it works out. I sell half my big position at 2200 and now I have for sure a big profit. As big as usual month for me. For the trade detail see link below.
Happy trading!
Ms Bunny 💕

Short Russell! Heck pick anything and short itMarkets look weak looking everywhere. I don't know in deep about markets and economics. But my tecnical analyse I know very good. And everywhere I see is weak technicals.
Volumes are weak
Trends are down
Rallys are weak
Dips are strong
Upper wicks are long
Vix are low
So right here I take a short on RTY. And we see how today is to go.
I still be in my gold trade from last idea. I will get stopped out though very soon. But I already make great money on gold. Now moving it into the index.
Thanks for following me and reading me.
Ms. Bunny

New trading strategy upgrade - Russell 2000Let's keep the previous trading plan to hold long positions. be patient to wait this correction finished
