M2K1! trade ideas


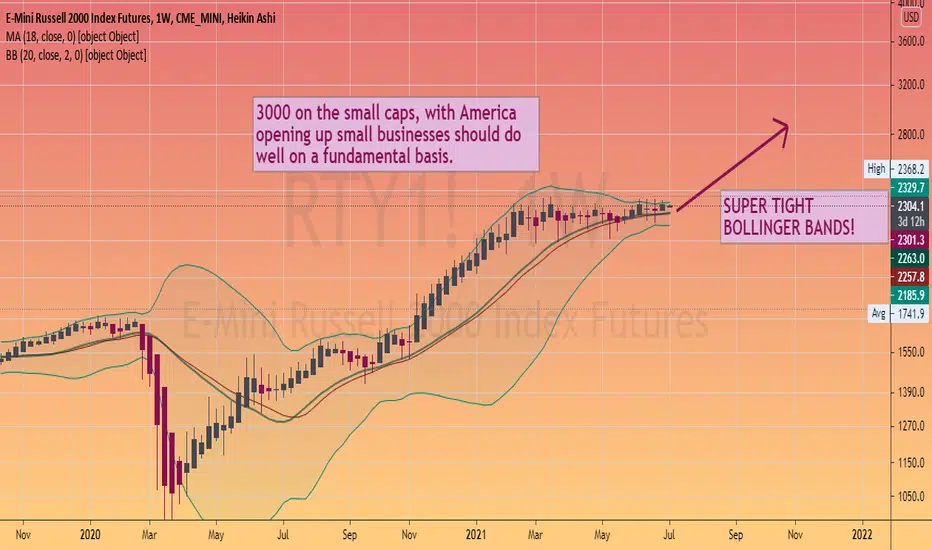
Fresh Faces from Reconstitution Headed into High GrowthTransformational change in our infrastructure is coming. Energy storage, transfer, and usage will drive this trend. The Russell is primed to make its next push up to the 2.618 extension around 3,000. Looks like September is going to be the ramp up. I hold several names added in the reconstitution.

The Money Shift and Volatility is in RTY Russell 2000 today Using Volatility Index measures we can steer away form quite markets and go where there is money being moved. A day traders longevity relies heavily on MOVEMENT! Track movement with the CBOE Volatility Indexes!

Small Caps, #russel2000 index - #US #stocksIs this poised to break out to new all-time highs
a major move is imminent
probabilities should be up
RTY UpdateThis is the only index that surprised me a bit. I expected small caps to rally with the rest of the market. Looks to me like it wants to go oversold again.
I probably would have traded this week had I known, but whatever. I predicted the ES and NQ meltup correctly, just thought small caps would go with...

Elliott Wave View: Russell (RTY) Looking for Further UpsideShort term Elliott Wave suggests the rally from March 25, 2021 low is unfolding as a leading diagonal. Up from March 25 low, wave 1 ended at 2298.3 and pullback in wave 2 ended at 2112.6. Index then resumes higher in wave 3 towards 2350.30 and pullback in wave 4 ended at 2206.20. Wave 5 is currently in progress with internal subdivision as a 5 waves impulse in lesser degree. Up from wave 4, wave (i) ended at 2287.30 and dips in wave (ii) ended at 2258.80.
Index resumed higher in wave (iii) towards 2342.80 and pullback in wave (iv) ended at 2330.30. Final leg higher wave (v) ended at 2346.70 and this completed wave ((i)) in higher degree. Wave ((ii)) pullback ended at 2284.70 with internal as a double three Elliott Wave structure. Down from wave ((i)), wave (w) ended at 2299.40 and rally in wave (x) ended at 2328.80. Index then extended pullback in wave (y) towards 2284.70. This completed wave ((ii)). Expect the Index to extend higher while above 2284.70, and more importantly above 2207.16. As far as June 21 pivot low at 2207.16 stays intact, expect dips to find support in 3, 7, or 11 swing for further upside.


RTY hit oversold overnightRTY went oversold, NQ went overbought so probably a counter rotation, lol.

RTY Daily Bullish ChannelThe RTY daily time frame is in an up channel.
The market is at a high price hitting the top
of the channel. According to the research, it will
be a good idea to stay out of the market and to
wait for the market to give a low price near a
known level of U-turn either at the bottom of
the channel or above the the channel. There is
an up Fibonacci extension above the live market
price point 2588.1 about +2,531 ticks away. As
of now, I am out of the market wishing to be
in.

RTY Touching OverboughtRTY touching overbought, but probably heads higher so it can get that triple top.
I can;t imagine retail breaking out, but if it does it;s just an opportunity to short earnings.

RTY, +1,000 Tick Bullish PushThe RTY Daily time frame is in an up channel. The
market is moving from the top of the channel
towards the bottom of the channel. As long as
the market stays above the bottom of the Channel.
I am expecting the market to U-turn bullish towards
the top of the channel price point 2356.3 about
+1,126 Ticks away.
It will be a good idea to turn to the one hour
time frame and to look for the market to
enter into the buy zone.


RTY MFI oversoldMFI oversold before Powell talks. Has not hit my target, but I'd be wary about holding a short position before the world's biggest pumper talks.

RTY pre-market with fibonacci.Fibonacci is primarily used to find support in this context so this graph is designed to give you more of a bullish perspective. Keep in mind the whole world thinks it is time for markets to tumble.
It is summer and we are talking about inflation a lot recently. I don't like it when markets get slashed. The only people who benefit are the ultra-rich. Markets always go back up eventually, and all that movement doesn't get taken advantage of by the average investor.
Most people don't care about that kind of thing because they are otherwise occupied with life events, but as a market watcher person, it's something I wish the average person cared about a little more. Kind of like going green: I don't really know what the effects are going to be if everyone reduces their carbon footprints, but I am pretty sure it would be a good thing. Whenever I think about this I always get led back to thinking education, regardless which discipline, is really the way to go. Hopefully all the money the .01%'ers absorb during the bear months will get back into the education system. That is what I will tell myself when I'm at my computer. That's not what the world will tell me when I go outside.
Why do I get myself all bummed out right before trading? I'm legitimately more tired now.

RTY [$IWM] | Rising Wedge PatternThe Russell is trading within a large rising wedge pattern. I will be watching the price reaction if/when price breaks the lower trendline. Current direction is unclear.

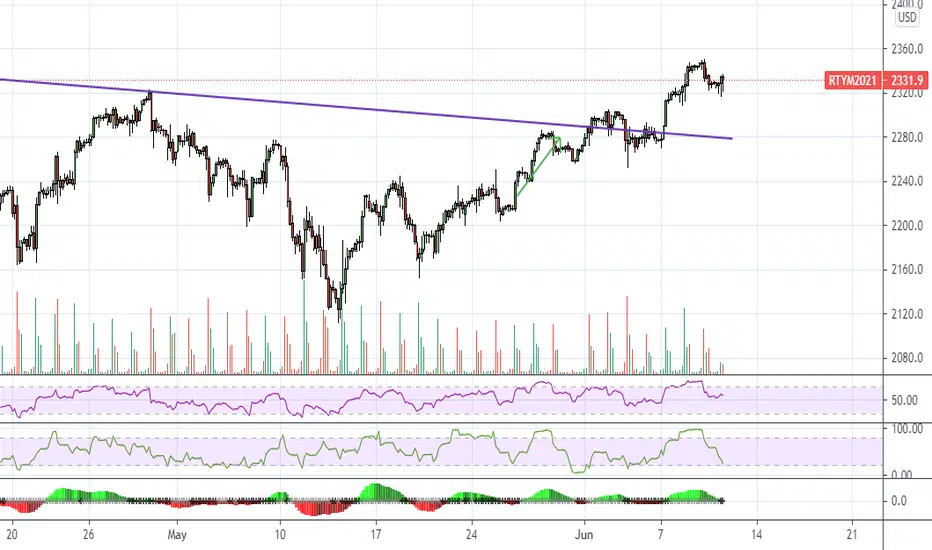
RTY OverboughtMFI dropping on all other indices but RTY went overbought? I think it backtests tomorrow.
Also, keep an eye on FDAX, it backtested the wedgie and it's dropping, see plot from last week.

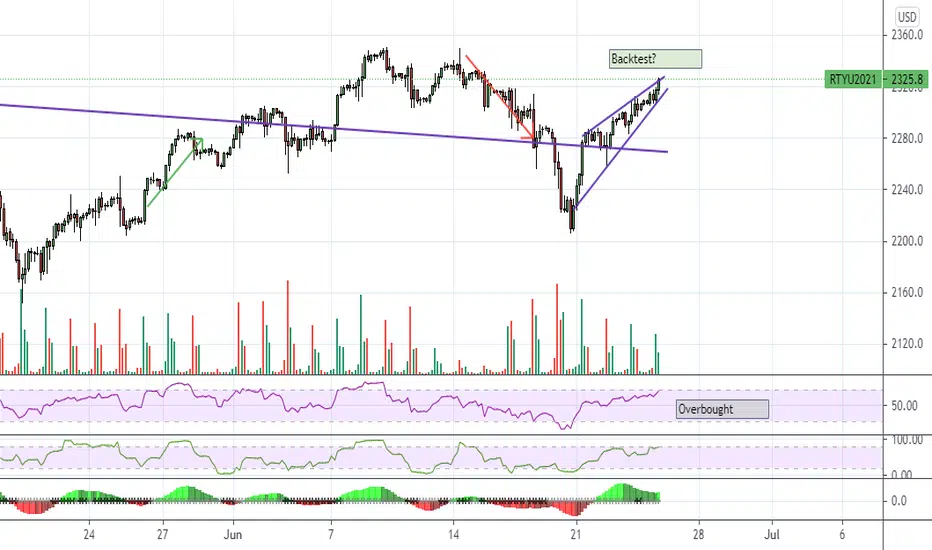
RTY1! 13 JUNE 2021 2153 hrsTentative plan will be to see if that trendline has anything left for a push to that key resistance level.
Supply pressure look pretty light so it may only be a shallow pullback, will see.
Pretty uniform accumulation events off of that trend line. W's. You cam also see teh uniformity of teh RSI and how the re-accumulation events took place below the mean. That will be another pattern to look for. Wait for the rsi to at least touch the median line. This starts to give you space from any potential supply.


Tutorial | CFDs & Continuous Futures ContractsThis post is a follow-up to my 15-minutes of TradingView fame from a video I uploaded last week explaining how to get real-time futures data into TradingView for charting, analysis, and demo/paper trading. Thanks for all the comments and engagement (See Link to Related Ideas).
So here's a Part 2 of sorts covering CFDs, an alternative set of products and symbols that are pretty darn close in price to the CME futures prices for stock indices and commodities.
DM me if you'd like the Watchlists I highlight in the video.