M2K1! trade ideas

Elliott Wave View: Support Areas for Russell 2000Short Term Elliott Wave View suggests the rally from September 25 low in Russell 2000 (RTY) is unfolding as a 5 waves impulse Elliott Wave structure. In the 1 hour chart below, we can see wave 3 of this impulsive rally ended at 2032.3. Wave 4 pullback is in progress with the internal subdivision as a double three Elliott Wave structure. Down from wave 3 high at 2032.3, wave (a) ended at 1993.2, wave (b) pullback ended at 2006.70, and wave (c) ended at 1946.60. This completed wave ((w)) in higher degree as a zigzag.
Up from there, wave ((x)) bounce ended at 1997.60 as another double three Elliott Wave structure in lesser degree. Wave (w) ended at 1987.4, pullback in wave (x) ended at 1958, and wave (y) ended at 1997.60. This completed wave ((x)) in higher degree. Wave ((y)) lower is currently in progress as a zigzag where wave (a) ended at 1920.5. Expect wave (b) bounce to fail below wave ((x)) high at 1997.60 and Index to turn lower 1 more time in wave (c) of ((y)) towards 1857.31 – 1911.16. This last move lower should end wave 4 in higher degree. From there, Index should resume to new high or bounce in 3 waves at least.

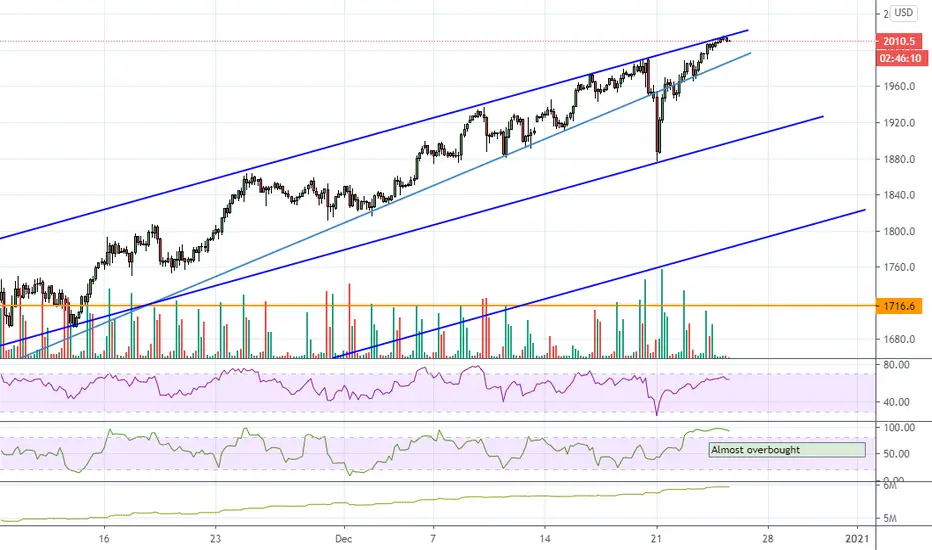
RTY One hour up ChannelRTY One hour time frame is in an up channel. I am looking for the market to form a low price and push bullish towards the top of the channel. The low price could be now or it could be near the bottom of support. It may be a good idea to use a counter trend line break bullish to find the potential low price.


RTY Still overboughtOther that RTY MFI being overbought, indicators for all other indices are neutral with no direction.
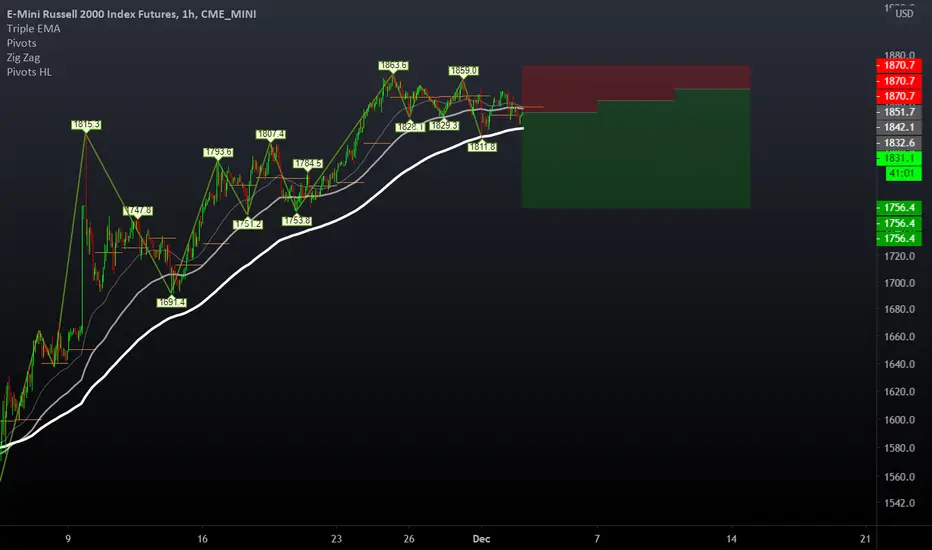
I'm guessing light profit taking today....
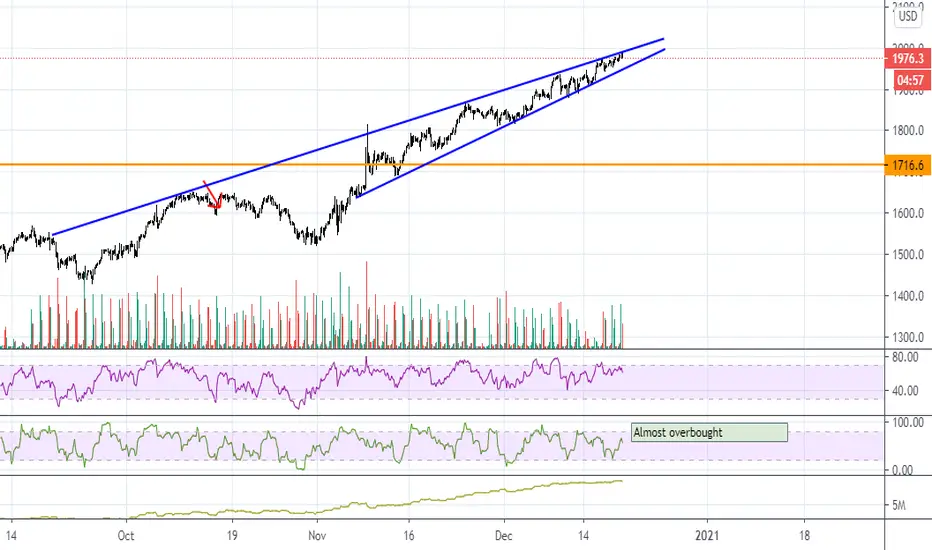
How much more of a spread can there be?Since the lows in March the Russell 2000 index has out preformed the SP500 by almost 40%! It is even up over 20% from the range highs in October. It has been a truly historic run but is now a good time to hedge or take profits? We are long equities broadly but have been hedging into the new year to preserve gains. You can never lose by protecting yourself. The Russell might be the best instrument to use give its huge outperformance. Yes financials and other key sectors in the index have been strong and yes their strength may continue but nothing moves in a straight line forever.

RTY UpdateMFI obviosly overbought, loos like RSI hits overbought tomorrow, so possible pump and dump coming.

Down russell, down boy. USING KISS method to this chart. Says volumes... yesterdays little dip gave birth to this Beautiful pattern. Tomorrow might be the day this bad boy finally listens and sits down. Mega long rising wedge on the daily chart complete with nice overbought conditions.
This is my spec find yours

IWM, Russell 2000 retracement?The Measured move of this triangle has been reached. I had a good strangle trade on IWM with calls/puts purchased before election. Strangles are terrific strategies when you know a big move is coming and the leverage of options can 5-10x or more in these type of moves. I'm now hoping for a pivot down in the market.. it could be mild- I don't know. We could melt up until end of 2022 but I'll be patient for retracements.

RTY OverboughtRSI overbought on 3 hr, daily, and weekly
Somethings gotta give... no volume at all today.
Hard for me to get bullish when I'm expecting this to drop

RTY - ATHs
Look at today Volume Profile on the RTY shows value was lower today than yesterday but they pumped the price to all time records.
The Russell is without a doubt defying gravity - but sober look shows where the 5 day and 20 averages are.
Congrats to all those who are long that said.
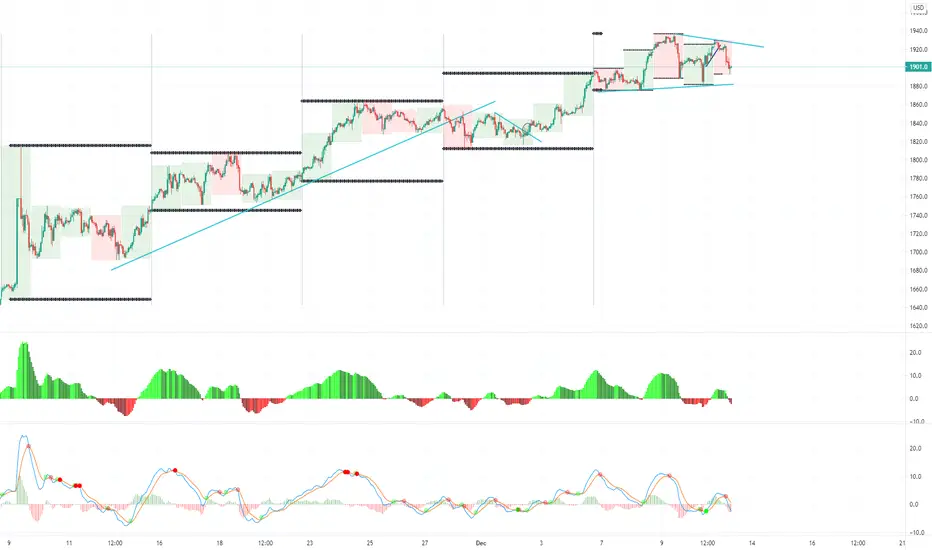
Interesting tool from the public library may show us whats going on under the hood.
The trend volume accumulations (TVA) indicator allows determining the current price trend while taking into account volume , with blue colors representing an uptrend and red colors representing a downtrend.


RTY [$IWM] | Bearish Head and Shoulders: Potential Gap FillWatch for a strong breakdown of the neckline. Target is Sunday gap fill.
Good luck

RTY MFI overboughtJust saying.... I wouldn't buy the dip today even though I expect an afternoon bounce.

RTY - Up, Up and .... This four hour chart has the answer.
When this trend line breaks - which looked like it was today - but not just yet.
Suspect this will be violent. However timing this is tough ( I have been wrong on this one) - best watch for trend line break . They will prop this up as long as "big money'"chooses, that's clear.
The USD falling really is responsible for this rally - the DXY is at levels not seen since April 2018. When its decided to reverse the USD the rally is done. Watch for divergences in the Euro - this may tip us off.
IWM calls made up 24% of the option volume and puts made up 76% of the volume today. The Commitment of Traders show that commercials are very short and large speculators as well as retail are very long as of last Friday.


RTY OverboughtNot sure there's an opportunity to short, but I certainly wouldn;t chase it from here.

RTY1! at 200 Hullmalooks very tired.
Disclaimer, this is only for entertainment and education purposes and doesn't serve by any means as a buy or sell recommendation.
Personally I hold both long term long positions and occasionally short term short position, for disclosure purpose.

RTY Test 6+1 Trend trading
+1 High time frame (1H ~)
+1 Candle Trading
+2 Using the moving average
Strategy Quality 5 / 10