RTY Ascending Wedge - Short IdeaRTY is looking good for a short if the market doesn't keep rallying. It'll be one of my top watches for short setups. I included a path for longs as well, but this chart is bearish for now so I'd expect the bearish path.
M2K1! trade ideas

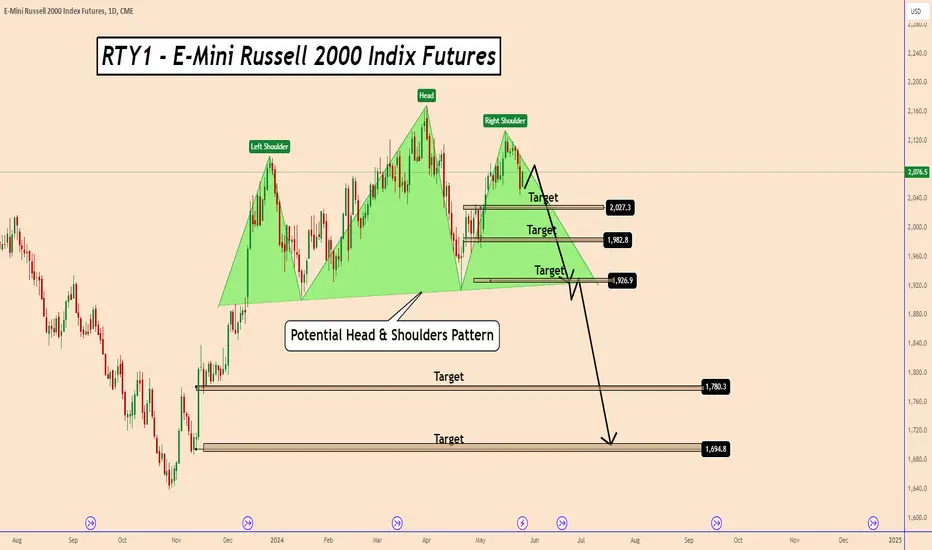
Russell 2000 Looks Almost Ready For a Change In TrendRussell 2000 Looks Almost Ready For a Change In Trend
Price looks ready to complete the Head & Shoulders pattern.
We have to be careful as it is not a complete pattern but it shows the possibility that the price may complete the right shoulder near 1925 over the next few days.
If the price manages to break out of the neckline of the model, then we should look at Russel 2000 moving down near to 1780 and 1700.
You may find more details in the chart!
Thank you and Good Luck!
❤️PS: Please support with a like or comment if you find this analysis useful for your trading day❤️
RTY: Measured Move, Riding with other indicesLooking at potential MM, Sympathy with other US indices.

RTY Bull Flag - Doom After?RTY retested its major ascending channel it fell out of before the sell off last month. Currently has a short term bull flag that I could see it getting broken to the upside, but then it'll have to contend with that major trendline again and may lead to a failure. On top of that, it also forming an ascending wedge. Seems bearish to me.

How To Stay up to date with Market NewsHey traders so today I wanted to make a quick video about where to go to find out about Ecomonic Releases. These market data reports can really make a difference when trading.
Enjoy!
Trade Well,
Clifford


Why Large Firms with Huge Cash? Small Firm Are Leading...Berkshire Hathaway, an investment company is not investing. What is the signal?
Why are they hoarding cash?
• Not much good investment opportunity ahead
• Preparing for tougher time
E-mini S&P 500 Futures & Options
Ticker: ES
Minimum fluctuation:
0.25 index points = $12.50
Micro E-mini S&P 500 Futures & Options
Ticker: MES
Minimum fluctuation:
0.25 index points = $1.25
Disclaimer:
• What presented here is not a recommendation, please consult your licensed broker.
• Our mission is to create lateral thinking skills for every investor and trader, knowing when to take a calculated risk with market uncertainty and a bolder risk when opportunity arises.
CME Real-time Market Data help identify trading set-ups in real-time and express my market views. If you have futures in your trading portfolio, you can check out on CME Group data plans available that suit your trading needs www.tradingview.com

RTY/IWM DAILY CHART WEEK OF PPI, CPI, POWELL- Price still consolidating around the breaker. Price will need to close above 2087 to start making its way back above 2100.
If not, we can see price push to the FVG lower at 2035 and lower.
- RTY are full of small/mid cap stocks that work with small balance sheets and deal in leverage. They are the most sensitive to rates since most of CASH POOR. If we get a hot CPI report signaling a delay in rate cuts, this indice will sell heavy
- Flip side, if CPI comes in COOL or inlines , we can see this indice rally hard on the notion it will get some relief for the companies involved

RTY/IWM PPI, CPI, Powell- Price still consolidating around the breaker. Price will need to close above 2087 to start making its way back above 2100.
If not, we can see price push to the FVG lower at 2035 and lower.
- RTY are full of small/mid cap stocks that work with small balance sheets and deal in leverage. They are the most sensitive to rates since most of CASH POOR. If we get a hot CPI report signaling a delay in rate cuts, this indice will sell heavy
- Flip side, if CPI comes in COOL or inlines , we can see this indice rally hard on the notion it will get some relief for the companies involved

RTY1! 6/1/2023RTY1!
I sometimes wonder if people realize how bad things are going to get.
Daily chart analysis
RTY1! Reached all-time highs after the fake money covid pump. It then spent all of 2021 moving sideways in what turned out to be a Distribution stage.
It entered a downtrend (under 200ema) to start 2022 and found support by mid-year.
Now over the last 12 months, price has pulled back to 200ema and has been moving sideways in form of a Double Top.
This possible “Double Top” pattern has formed a nice tight “build-up” of price at support. This is very bearish as bears are showing strength by containing price in a small range at support level.
Want high probability trades? Trade patterns that coincide with the trend.
Double Top pattern (Bearish pattern) + Downtrend (Bear market) = High probability short trade
The neckline has yet to be broken but the current build-up of price at support level gives us a nice risk/reward entry.
This is my cue to enter trade short.
Entry: 1769.8
Stoploss: 1913.2, -8.10%
Target #1: 1363.8, +22.94%, 2.83 RR ratio
Target #2: 973.2, +45.01%, 5.56 RR ratio


My TradingView symbol says not TradeableIn this video we will explain the reasons why you are not able to route live orders on your Tradingview platform with AMP Futures, and what steps are required to resolve this issue.

RUSSELL 2000 Bottom of Channel Up. Buy signal.Russell 2000 reached the bottom of the (1d) Channel Up on a symmetric -9.20% bearish leg, like the one before.
It is holding above the MA100 (1d), same with August 25th 2023, which was also a -9.15% decline but the rebound failed to close over the MA50 (1d) and resumed the downtrend.
Trading Plan:
1. Buy on the current market price and as long as daily candles are closed over the MA100 (1d).
2. Sell if a daily candle gets closed under the MA100 (1d).
Targets:
1. 2230 (+13.61% rise like the bullish leg before).
2. 1830 (-15.63% decline from the top, like the March 24th 2023 low).
Tips:
1. The RSI (1d) is on a pattern consistent with -9.20% declines. It is approaching the 30.00 oversold limit.
Please like, follow and comment!!

RTY Monthly time frame testing SupportThe RTY Monthly time frame pushed bullish last month and closed above resistance (Around price point 2000.00). This month the market has had a bearish dip and appears to be testing the price of the old resistance level which can now act as support and push the market up.
This is pretty normal when the market breaks out of a sideways range. If the market can stay above price point 2000.00 I am expecting the market to push bullish towards the new up monthly Fibonacci extension price point 2380.2 about +3,246 ticks above the market. If the market closes below the monthly support price point 2000.00. Then I would expect the recent bullish push to be a false bullish breakout and the market to push back down towards the old consolidation low around price point 1638.00.
According to the research, as long as the market stays above 2000.00. It will be a good idea to turn to the daily time frame to look for low prices in the buy zone before looking for long ideas.

Follow up on the dollar4.10.24 If I had taken the dollar trade I would have lost money with a small stop... so it was losing trade... but it turned into a two-bar reversal to go long and that would have made up for the loss of money on the first trade and then some. Markets can certainly have a two bar reversal that will entice you to take a trade in one direction but if the market doesn't really start to move and it turns into a two-bar reversal in the other direction... that's telling you that the markets likely to trade that direction.... which is perfectly okay as long as you have small stops. Talk about the Russell on that video.... but the Russell because of the pattern is a much more reliable pattern and I want you to see what that looks like.... in addition without a doubt it has much more volatility than the dxy. I tried to run the numbers for you for the Russell even if you made an opening price trade to go long but then it turned into an opening price trade to go lower.... and now you have a market that can move thousands of dollars even with a mistake and create a good return..... using basic techniques.

Daily Chart UpdateWe may move down today! But don’t think we can’t retrace on Friday! I would expect this direction change to take some time.
Enter near the lines and best of luck!

RTY Monthly time frame bullish breakoutThe RTY Monthly time frame has been sideways. The market was able to close above resistance (The top blue level) that has pushed price down several times. If the market can stay above resistance (the top blue line) I am expecting a the market to have a bullish push towards all time highs near target price point 2455.9 about +4,000 ticks above the market give or take. As long as the market stays above resistance, it should be a good idea to turn to the smaller time frame and look for buying ideas in the buy zone.

RTY UpdateNot overbought yet, probably gets there tomorrow.
ES and NQ MFI still oversold, hasn't moved. Really strange day. Gonna stay cash, figure it out next week.

Break up or break down?We’re about to be making a big decision! Look at the 4 hr time frame and get ready!
Good luck and make sure to enter at the lines! This move could take until Friday to confirm direction!
Be ready to hold your ground :)

Today was a bad day! That’s ok!Today I did not follow my rules. I got greedy and I lost 6k. That’s why it’s so important to stick to the rules!
Tomorrow is a new day and I won’t make the mistakes of today tomorrow!
This month is still a positive month for me but it’s always a sad day when the market wins!
Good luck everyone! Enter at the lines to reduce risk!

Daily Chart UpdateSo glad I held over night! Normally I try to make sure to be out of the market by 5pm each day or earlier.
However, it turned into a huge win this morning!
Once again, entered near my lines, waited for the move in my direction, and then took out when I wanted to.
You never need a reason to exit your trade!
There will always be new times to enter!
Good luck tomorrow!

Step into the heart of real-time action with our live trading We achieved our goal 85.11% of 2023 in the first 30 minutes from the market open. Dive in and seize the opportunity! Join our live trading session where we'll trade in the live stream until we reach our goal! Watch a review of what we did this morning!

Sunday Chart Ready!Are you ready to trade Sunday?
There’s always chances to enter the market and Sunday could be your day!
Enter near the lines and always keep in mind the overall direction the market is currently headed!
Good luck!
