Neutral environmentThe Friday close on the S&P 500 daily chart created a neutral environment going into a weekend with the least high tension situation. Be prepared for the potential for high volatility.
MES1! trade ideas

Quo Vadis - "Where we have come to"Here is is a daily bar chart of the MES1! showing where we have come made up from TV Community scripts. (No coding required.) But the question of course is where do we go from here in light of all the current circumstances: Middle East War, Tariff, Interest Rates, etc Will we see a new All Time High in the S & P 500? This chart does not show a reversal yet. I am staying LONG until the market and the chart says something different.

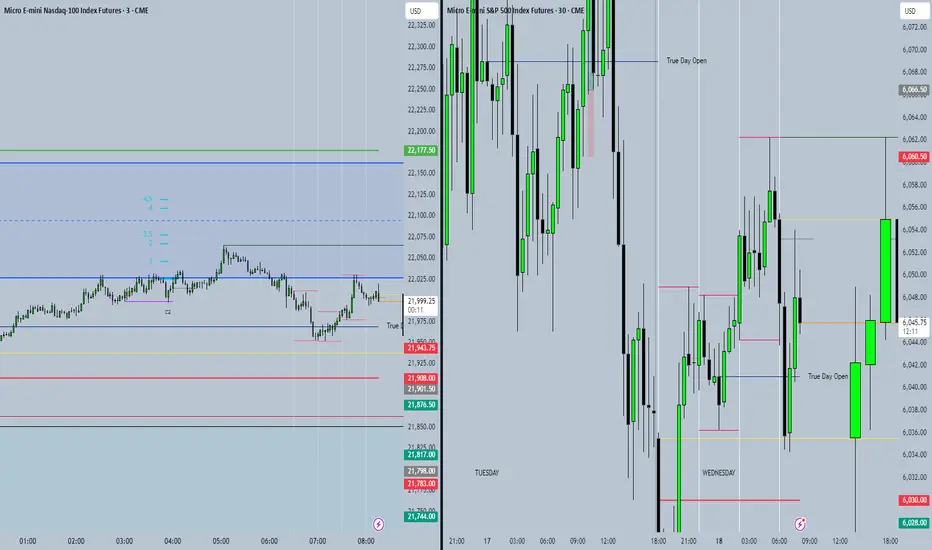
ES - LONG @ London OpenBuyers from 6000 options level, floor. We've got weak liq. above to squeeze. After London open FIND on smaller timeframes the auction/finished business (risk) and test of pivot/poc (entry)

Sellers maintaining controlSellers maintain control in their shortened S&P 500 daily session. Further movement to the downside would be expected however we are approaching levels the buyers have entered this market previously. So be careful on the short side of this market.


LONG ES after London Open*I like the long better for london open.
From 6000, weak liquidity built up above, Finished business below, macro SMAs buy bias...
HOWEVER there is also a good case for shorts as we are heading up into futures open, SMAs and there is LVN space below to squeeze into. So... I will be looking for finished business RISK and test/acc ENTRY as outlined there and targeting the weak liquidity above. Given the SMAs above etc, i doubt price will rush up, so take your time and get that test to confirm.
And as always if its not there DONT chase. Patience.

06/18/25 Trade Journal, and ES_F Stock Market analysis
EOD accountability report: +521.25
Sleep: 5 hours (bad sleep)
Overall health: My Ultrahuman Ring is saying I might be getting sick. 9 need to recover sleep and take care of body today and tmr. I think my lack of exercise this week is catching up to me.
**What was my initial plan? **
Looking at things premarket, things looked a bit weak as it was about sell off in the morning with bearish structure and DHC. Went in for a short at 1 min MOB but it didn't react and just broke thru, so flipped to bullish side and took it to the next resistance.
overall plan for the day was to look for chop zones to scalp b4 fomc, but that actually didnt happen until after fomc.
** VX Algo System Signals from (9:30am to 2pm)** 4/5
— 9:50 AM Market Structure flipped bullish on VX Algo X3! :check:
— 10:52 AM VXAlgo ES X1 Sell Signal :check:
— 12:10 PM VXAlgo ES X1 Buy signal (Double signal) :x:
— 12:11 PM Market Structure flipped bearish on VX Algo X3! :check:
— 1:40 PM VXAlgo ES X1 Buy signal (Double signal) :check:
Next day plan--> Above 6015 = Bullish, Under 6005= Bearish

Inside day for ThursdayWith the shortened trading session in the S&P 500, the expectation is that Thursday will trade within Wednesday's range.

ES1! Futures
Looking at the 3D ES futures. Does it look bullish? Will it make ATH? Just look at that RSI!

Sellers have returnedSellers have returned to the daily chart in the S&P 500 on Tuesday. The expectation for this type of structure is further movement to the downside but without fundamentals driving the market a smaller range lower is expected for Wednesday.

06/17/25 Trade Journal, and ES_F Stock Market analysisEOD accountability report: +1,337.50
Sleep: 9 hours
Overall health: Good, was averaging 40k steps the week before, now around 20k avg,
need to get it up to 25k steps min per week.
**What was my initial plan? **
Went into the market pretty neutral today with the mindset that it should be the calm before storm (fomc tomorrow), There was a string defense of 1 min MOB in the morning and that gave me the belief that early part of the day was going to be bullish so i took a few stabs at support and made my money.
** VX Algo System Signals from (9:30am to 2pm)** 4/4
— 9:34 AM Market Structure flipped bullish on VX Algo X3! :check:
— 10:30 AM VXAlgo ES X1 Sell Signal (double signal) :check:
— 11:36 AM VXAlgo ES X3 Sell Signal (double signal) :check:
— 1:00 PM Market Structure flipped bearish on VX Algo X3! :check:
Next day plan--> Above 6015 = Bullish, Under 6005= Bearish
Video Recaps -->https://www.tradingview.com/u/WallSt007/#published-charts

06/16/25 Trade Journal, and ES_F Stock Market analysisEOD accountability report: +450
Sleep: 7 hours
Overall health: Good
What was my initial plan? I knew today was contract rollovers and decided not to trade it, but after noticing that the x1 signals were working pretty good today, i decided to take some plays at the soft support and resistances.
**Daily Trade recap based on VX Algo System from (9:30am to 2pm)**
Lot of X7 buy signals (usual signal that market is bullish)
— 10:40 AM VXAlgo ES X1 Sell Signal (triple signal)
— 11:56 AM VXAlgo ES X3 Sell Signal
— 12:30 PM Market Structure flipped bearish on VX Algo X3!
— 1:20 PM VXAlgo ES X1 Buy signal
Next day plan--> Above 6010 = Bullish, Under 5965= Bearish
Video Recaps -->https://www.tradingview.com/u/WallSt007/#published-charts

Wave 5 up in a Diagonal could be hours away The chart posted is the sp 500 futures back in april 10 th I labeled the low at 5102 as wave B or 2 both called for sharp rally to as high as 6147 in which wave 1 or a x 1.168 = 3 or c for a wave B top . since then I saw the high at 5968 as the end of wave 3 top and then looked for a drop back to 5669 we saw 5667 and so far all rallies have taken a 3 wave formation in which Most but Not all times this is occurring in an ending diagonal and in each wave we saw so far .887 the preceding wave . I have traded in and out and I am waiting for a final push up to 6083/6147 midpoint 6100 to take a short position . The alt is a small series of 4/5 4/5 4/5 if this were the count we would then break ABOVE 6147 and then reach 6330 . I am waiting to confirm .Best of trades WAVETIMER

SPY 5 Wave Impulse The broader equity market has staged a significant rebound from the panic-induced tariff lows seen in April, reclaiming the previously established value area with notable strength. Generally, when price reclaims a value range, it can be common for price to oscillate within the value area high, and low, to build strength for the next move.
From a structural standpoint, I interpret this advance as a five-wave impulsive sequence, with the current rally toward the 6100 level representing the fifth subwave within a larger third wave of the broader Elliott Wave framework. According to this interpretation, we may be approaching a final "blow-off" move to the upside—commonly labeled as Wave 5 of 5—which is often characterized by its velocity, magnitude, and the psychological impact it has on retail participants, frequently triggering a surge of FOMO-driven buying.
However, I urge caution: this concluding leg may offer a strategic opportunity to reduce equity exposure, particularly as August has historically exhibited bearish seasonality. A swift corrective decline could follow the completion of this wave, potentially sparking short-term panic. While unsettling, such a correction would likely represent a healthy rebalancing within the broader uptrend and could provide an advantageous entry point ahead of a year-end rally.
Furthermore, it's worth noting that many hedge funds and CTAs have remained underexposed throughout this powerful ascent. Should valuations reset to more attractive levels, sidelined liquidity—particularly capital currently parked in money markets—may be incentivized to re-enter the market with a longer-term outlook.
The key indicator which I will be following is the VIX risk sentiment in the market. Once we reach elevated levels above approx 30/40 , this would be a good time for me to analyze potentially dollar cost averaging back into the market.
Good luck!

S&P 500 | Short Setup | into Resistance | (June 16, 2025)ES (S&P 500) | Short Setup | Pump into Resistance | (June 16, 2025)
1️⃣ Short Insight Summary: The S&P 500 (ES) pumped nearly 2% today, pushing into major resistance and approaching all-time highs. Now I’m watching for signs of exhaustion and a potential reversal toward key value levels.
2️⃣ Trade Parameters:
Bias: Short
Entry: Watching for rejection around 6152–6166
Stop Loss: Just above the all-time high or intraday spike
TP1: Previous month’s value area high
TP2: Mid-channel zone (aligned with Fibonacci confluence)
Partial Exits: Consider exiting partially if momentum stalls at key zones
3️⃣ Key Notes: Price is currently breaking out of a power channel. On the 30-minute chart, several limit orders suggest selling interest near this resistance. A reversal here could send ES back into the value range. Also watching ETH, SOL, and other majors for correlation, especially with ongoing geopolitical tensions like news out of Iran.
4️⃣ Optional Follow-up: I’ll keep monitoring for clear reversal signals. If we see sharp rejection with high volume, I’ll post a follow-up.
Please LIKE 👍, FOLLOW ✅, SHARE 🙌 and COMMENT ✍ if you enjoy this idea! Also share your ideas and charts in the comments section below! This is best way to keep it relevant, support us, keep the content here free and allow the idea to reach as many people as possible.
Disclaimer: This is not financial advice. Always conduct your own research. This content may include enhancements made using AI.

ES1!/SP500 Targeting Weekly Range Resistance***QUOTING SEP CONTRACT FOR JUNE CONTRACT OR CASH US500 EQUIVALENT LEVELS SUBTRACT ~52 POINTS***
***WEEKLY ACTION AREA VIDEO TO FOLLOW AHEAD OF NY OPEN***
WEEKLY BULL BEAR ZONE 6090/6100
WEEKLY RANGE RES 6150 SUP 5914
DAILY RANGE RES 6090 SUP 5972
DAILY VWAP BULLISH 6019
WEEKLY VWAP BULLISH 5923
DAILY BALANCE - 6064/5965
WEEKLY ONE TIME FRAMING UP - 5965
MONTHLY ONE TIME FRAMING UP
GAP LEVELS 5843/5741/5710/5339
Balance: This refers to a market condition where prices move within a defined range, reflecting uncertainty as participants await further market-generated information. Our approach to balance includes favoring fade trades at the range extremes (highs/lows) while preparing for potential breakout scenarios if the balance shifts.
One-Time Framing Up (OTFU): This represents a market trend where each successive bar forms a higher low, signaling a strong and consistent upward movement.
One-Time Framing Down (OTFD): This describes a market trend where each successive bar forms a lower high, indicating a pronounced and steady downward movement.
GOLDMAN SACHS TRADING DESK VIEWS
Weekend Cross-Asset Dislocations (15-Jun-2025)
Oil Options Positioning Reaches Extreme Levels
On Friday, call buying in oil pushed the put-call skew to one of its most extreme levels in over 25 years. This indicates that investors are positioning for significant upside asymmetry. Notably, the shift in the put-call skew far exceeded the movement in near-term oil futures, compared to similar past episodes.
AI-Related Capex Remains Steady
Our analysts report that capex spending for 2025 and 2026 by the six largest hyperscalers has remained stable over the past few months. Bearish investors might interpret the absence of upward revisions as a sign of slowing momentum in the broader AI sector. Conversely, bullish investors could view the rebound in stock prices as a signal of growing confidence in hyperscalers and other AI-exposed companies to generate revenue sufficient to support planned capex.
Sector-Specific Divergences in Put-Call Skew
Friday saw notable divergences in put-call skew across sectors, highlighting the varied impact of global events. Increased call-buying pressure in energy aligns with the extreme shift in oil’s put-call skew. Meanwhile, rising put-call skew in Materials and Financials reflects heightened downside concerns, with Materials put-buying signaling fears of a broader economic slowdown.
Balanced Positioning in Single Stock Put-Call Skew
Despite sector-specific disparities, single-stock positioning remains balanced. The average stock’s put-call skew has returned to levels seen in March 2025, before the US tariff announcements.
IG Credit Spreads Tight Relative to Equities
Investment-grade (IG) equity investors appear more cautious than their credit counterparts, likely due to elevated uncertainty around US interest rates. A potential rate increase could disproportionately impact IG equity valuations.
Retail Investor Activity Remains Stable
Retail investor volumes have aligned with their five-year average, suggesting they remain engaged but have not been a dominant driver of equity performance in recent weeks. For single stocks, retail investors have been in a holding pattern, having shifted from net buyers earlier this year to small net sellers recently. This suggests they may be waiting for a broader market dip to resume buying.
SPX Daily Options Pricing Reflects Steady Volatility
SPX options are pricing daily moves between 0.9% and 1.2% over the next four weeks. Notably, options for this week’s FOMC meeting are pricing a relatively low ±0.9% move. While a ±1.2% move is priced for July 7, uncertainty remains regarding the volatility impact of the tax bill and the end of the 90-day tariff pause.
Professional Investors Maintain Cautious Stance
Entering 2025, professional investors significantly reduced their demand for leveraged equity exposure through futures, swaps, and options, signaling potential downside risks. While this trend has continued, the pace of selling has slowed in recent weeks, making the cautionary signal less alarming.
Wednesday marks the VIX expiry, which we believe has been supporting the market. Thursday is a market holiday, and Friday brings option expiry, likely leading to a high out-of-office session as risk-taking eases. The market may challenge crowded trades, with "short oil" being noted as particularly crowded.
1. Positioning (i): Hedge funds have been buying U.S. equities for six consecutive weeks, with net leverage exceeding 50% after reaching a five-year low in April. Despite a generally bearish outlook, investors are positioned bullishly due to limited alternatives.
2. Positioning (ii): Sector flows show increased risk aversion, with strong demand in utilities and significant supply in consumer discretionary sectors.
3. Positioning (iii): The systematic community remains long on stocks and is unlikely to sell significantly unless conditions worsen. The key level to watch in the SPX is 5800, both medium-term and short-term.
4. Flows (i): The long-only community has finally turned to buying stocks after three weeks of selling imbalances, ending $10 billion better to buy across all sectors.
5. Flows (ii): As the June expiry approaches, SPX call open interest is at an all-time high with 8.7 million contracts.
6. Trades (i): In derivatives, there have been buyers of VIX puts extending to July, with a significant premium built into the VIX curve. SPX realized volatility is at 12, while July VIX is nearly double that. Outright puts are intriguing, and some VIX puts were traded contingent on SPX falling below a certain level.
7. Trades (ii): Our cash desk believes the AI theme is gaining momentum. Callahan notes the increased visibility around GenAI as the biggest takeaway from the week. The Ellison earnings transcript highlights "astronomical" demand.
8. Trades (iii): The Goldman Sachs house view and consensus suggest that gold will continue its rapid rise. A July 97% put costs 100 basis points, representing the maximum loss premium paid.

S&P Sellers got LIQUIDATED we are Bullish again.Good day Trader :)
Here’s another market breakdown for you, focusing on the S&P futures and where I believe this week's candlestick is likely to expand.
Late last week (Wednesday), I mentioned the potential for a retracement, not a reversal , and at the start of this week, we saw exactly that. Sellers were quickly liquidated, and the market has resumed its bullish momentum.
Looking ahead, my expectation is for price to expand toward the 6,075 level.
In this analysis, I’ll walk you through a quick review of last week’s price action and provide an in-depth breakdown of why I believe this target is within reach.
Let’s dive in... OneCandlestickAtATime
Referenced Idea

Expect a Retracement... BUT not a Reversal in S&P Hi Trading Community,
Just a quick update on what I expect price action to look like for the ES over the next couple of days.
As you know, I've been bullish on this move — and I still am. However, there is some justification for a potential retracement to key levels. In particular, my attention is on the 5928 area.
It's too early to call this a full reversal, but let’s stay sharp in our trading and continue learning.
#OneCandleStickAtATime

MES Long - HVN, RejectionMES long trade idea.
Price went down after heat up of middle east conflict between Iran and Israel.
Rallied slowly afterwards for the whole day and created a HVN near the bottom.
I can think of a revisit of that area and a bounce to the upside.
Since the conflict is heating up further my risk will be reduced, and depending on the market open and a possible gap the idea might be invalid.

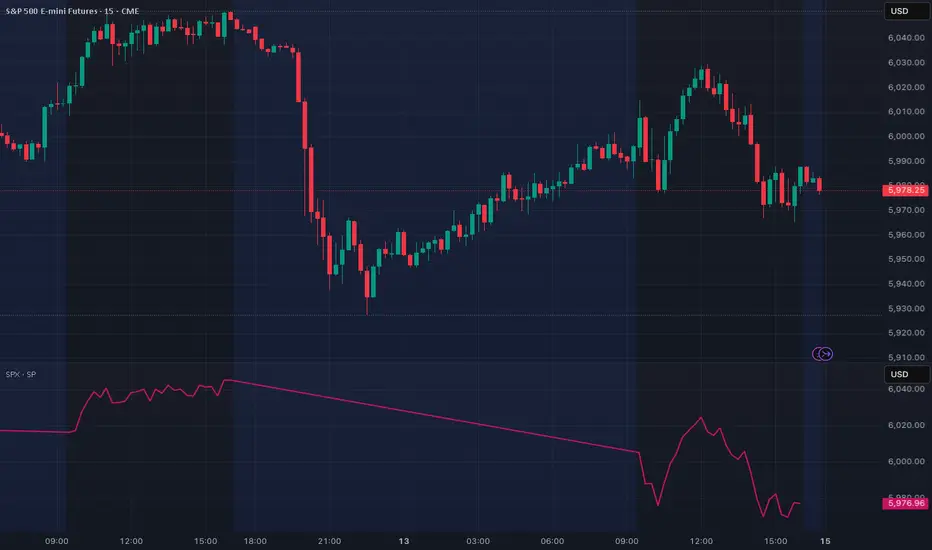
SPX Futures - Sunday Night Must Watch (bookmark this chart)This chart displays the price action of the S&P 500 E-mini Futures (ES), a stock market index futures contract that is traded on the Chicago Mercantile Exchange's Globex electronic trading platform. The S&P 500 index is a capitalization-weighted index that tracks 500 of the largest U.S. companies, making it a key benchmark for the overall health of the U.S. economy and stock market. This particular chart visualizes the ongoing battle between buyers and sellers, with the candlesticks representing the open, high, low, and close prices for each period. By analyzing the patterns and trends on this chart, traders and investors can speculate on the future direction of the S&P 500 index. This analysis is often supplemented with various technical indicators that can provide further insights into market momentum, volatility, and potential turning points. Lower pane is the actual SPX which will be live only during market hours.
Buy OIL & GOLD, Sell Stocks Indices When Missiles Are Flying!In this Weekly Market Forecast, we will analyze the S&P 500, NASDAQ, DOW JONES, Gold and Silver futures, for the week of June 16-20th.
When missiles start flying in the Middle East, investors become reactively risk averse. Money goes from stocks to safe havens and oil. That's it. Expect oil prices to rise, Gold to reach new highs, and the equity markets to see more sellers than buyers.
This environment may last a few days or a few weeks. Keep an ear to the news.
Enjoy!
May profits be upon you.
Leave any questions or comments in the comment section.
I appreciate any feedback from my viewers!
Like and/or subscribe if you want more accurate analysis.
Thank you so much!
Disclaimer:
I do not provide personal investment advice and I am not a qualified licensed investment advisor.
All information found here, including any ideas, opinions, views, predictions, forecasts, commentaries, suggestions, expressed or implied herein, are for informational, entertainment or educational purposes only and should not be construed as personal investment advice. While the information provided is believed to be accurate, it may include errors or inaccuracies.
I will not and cannot be held liable for any actions you take as a result of anything you read here.
Conduct your own due diligence, or consult a licensed financial advisor or broker before making any and all investment decisions. Any investments, trades, speculations, or decisions made on the basis of any information found on this channel, expressed or implied herein, are committed at your own risk, financial or otherwise.

A cool off dayA cool off day is expected in the S&P 500 daily chart for Monday, June 16. This would be reflected as a day that would trade inside the range of Friday's daily chart. It will take new information to create volatility and directional up or down movement beyond the midpoint of Friday's daily chart.
