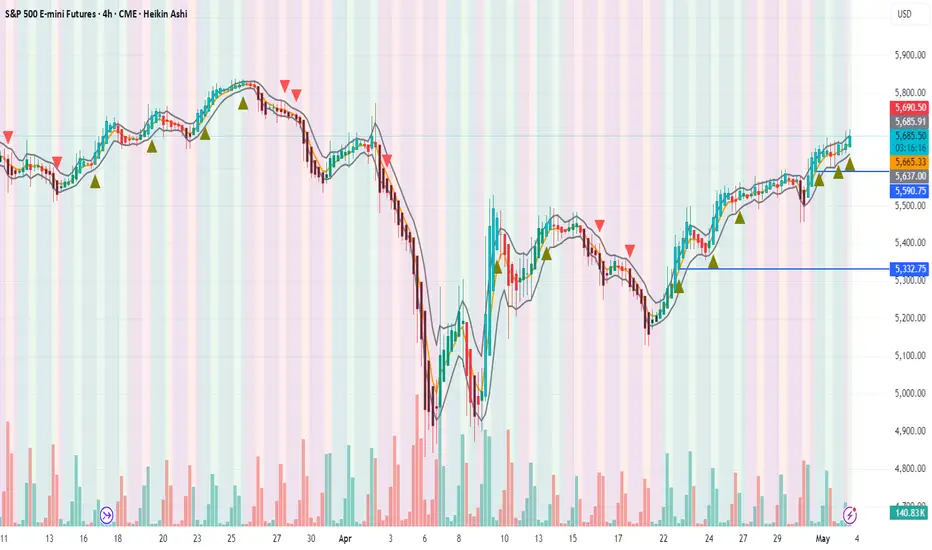
Cautious Optimism: What’s Next for the S&P 500US500 My Outlook for the Next Week:
Given the relentless bullishness on the chart and the current backdrop, here’s how I see the next week playing out:
Short-Term: The S&P 500 may continue to consolidate or experience mild pullbacks as investors digest recent gains and await fresh catalysts. Sector rotation could create choppiness, especially if tech underperforms.
Catalysts: Watch for key economic data (inflation, employment, Fed commentary) and any major earnings surprises. These could trigger renewed momentum or a sharper correction.
Risk/Reward: The risk of a sharp correction is rising, but the underlying trend remains bullish unless there’s a significant negative surprise. A shallow pullback or sideways action would be healthy and could set up the next leg higher if fundamentals remain intact.
In summary: The S&P 500’s relentless bullishness is being tested by mixed sentiment and cautious analyst forecasts. Fundamentals are still supportive, but risks are rising. For the next week, expect consolidation or mild volatility, with the potential for renewed upside if economic data and earnings remain strong. Stay nimble, watch for sector rotation, and be prepared for both short-term pullbacks and longer-term opportunities.
Not financial advice.
MES1! trade ideas

Everything Ready for a Bullish Implulse toward 5770Dear traders. As you may notice as explained on the chart, everything is ready for a bullish move towards 5770 and beyond. Let's See!

S&P 500 – iSpark Catches Clean Breakout from 5330 to 5700📢 The iSpark Indicator caught a strong breakout on the S&P 500 Index (4H chart) around the 5330 level , which was followed by a sequence of bullish moves — now reaching the 5700 mark.
🔍 Currently, price is testing the 10 EMA at 5710 , which is acting as a short-term resistance . A clear break and sustained move above 5710 could trigger the next leg higher toward 5750–5775 .
🎯 Holding positions? Stay in with a stop-loss at 5600 to manage risk.
📉 Fundamental caution: As always, keep an eye on macro headlines — unexpected global turmoil or sharp trade commentary (e.g., tariffs) may influence momentum
💡 This entire setup was captured early using the iSpark Indicator , designed to detect high-conviction breakouts across timeframes.
📬 Premium users interested in testing the iSpark Indicator can DM me for a hands-on walkthrough.
#SP500 #ES1! #Breakout #iSpark #TechnicalAnalysis #TradingStrategy #EMA #TrendFollowing #SPX #TradingView #SNP500
$6 Trillion Rollercoaster: Trade War Jitters Clash With FedThe index swung wildly as Trump’s 145% China tariffs and hints of an 80% reduction collided with Fed Chair Powell’s cautious stance on rates. Despite a midweek rally, the S&P 500 ( NYSE:ES ) closed the week down 0.46% at $5,684 reflecting investor paralysis ahead of U.S.- China trade talks.

It depends on this weekend.The movement in the S&P 500 daily chart on Monday depends on what happens in the trade talks between China and the US over the weekend in Switzerland. The S&P 500 is going into the weekend in a neutral position with a bullish bias.

May 9th Trade Journal & Stock Market AnalysisEOD accountability report: +440
Sleep: 6 hour, Overall health: :thumbsup:
I have been traveling the last few days and didn't have a chance to trade. just finally catching up on things again and getting hte videos out.
Daily Trade recap based on VX Algo System
— 9:44 AM Market Structure flipped bearish on VX Algo X3!
— 10:30 AM Market Structure flipped bearish on VX Algo X3!
— 1:10 PM VXAlgo ES X1 Buy signal
— 2:09 PM Market Structure flipped bullish on VX Algo X3!
— 2:10 PM VXAlgo NQ X1 Sell Signal
Next day plan--> Over 5650 = Bullish, Under 5650 = Bearish
Video Recaps -->https://www.tradingview.com/u/WallSt007/#published-charts

Most Unde-rated and Important Level of the week Previous Weekly Close level. Is a key level for the week for BIG trades whcich translate to big profits.
In the above video we will describe how to utilize and create a trade idea off this level.
This level will always give great risk /reward trade.
Dont fall asleep on this level.

Friday as an inside day.Friday on the daily chart in the S&P 500 implies training inside the range of Thursday. The ideal objective to the upside is still 5750.

Daily SMT Not sure if we're going to deviate higher, or have a PB here based on STDV, will have to let this week print.

May 8th Trade Journal & Stock Market AnalysisEOD accountability report: +463
Sleep: 6 hour, Overall health: :thumbsup:
I have been traveling the last few days and didn't have a chance to trade. just finally catching up on things again and getting hte videos out.
**Daily Trade recap based on VX Algo System**
— 10:20 AM VXAlgo ES X1 Buy signal (2x signal)
— 11:30 AM Market Structure flipped bullish on VX Algo X3!
— 12:30 PM VXAlgo ES X1 Sell Signal (2x signal)
— 2:11 PM Market Structure flipped bearish on VX Algo X3!
— 3:00 PM Market Structure flipped bullish on VX Algo X3!
Next day plan--> Over 5650 = Bullish, Under 5650 = Bearish
Video Recaps -->https://www.tradingview.com/u/WallSt007/#published-charts

Intraday Playbook ES Futures: Trade Setup & Context CME_MINI:ES1!
Big Picture Context
Please see related trade idea.
In this analysis, we refine our intraday levels to identify potential trade setups. We also review recent price action and present a high-probability long trade example that frequently offers favorable risk-reward dynamics when it plays out successfully.
See chart image below reviewing yesterday’s long trade opportunity.
Example Trade Setup: SFP Long
Time frame: 1 hour or 30 mins
• Entry: 5612
• Stop: 5595.50 (below SFP candle)
• Target: 5682 (mCVAH — confluence with recent highs)
• Risk: 66 ticks
• Reward: 280 ticks
• Risk/Reward Ratio: 4.2 R
Note: Past performance is not indicative of future results.
________________________________________
Intraday Market Structure Review
What has the market done?
• ES Futures have rallied and reclaimed a key technical level.
• Currently trading above:
o March 2025 low
o 2025 mid-year level
o Developing Value Area Low (VAL) for the 2025 Volume Profile
What is the market trying to do?
• Recover prior months' losses.
• Price action is climbing steadily, establishing higher lows.
How well is it doing?
• Despite headline risks, ES futures show resilience.
• Price has painted green candles in the full session for the past 10 consecutive days—a strong bullish structure.
________________________________________
What Is More Likely to Happen from Here?
Scenario 1: Pullback and Continuation Higher
A pullback toward the 0.618 Fib retracement and mCVAH confluence could offer another long setup, targeting the April 2nd high. This is further supported by NQ already reclaiming those highs, with ES still lagging but showing strength.
Example Trade Idea:
Time frame: 1 hour or 30 mins
• Entry: 5688
• Stop: 5680
• Target: 5724 (May 2 High)
• Risk: 32 ticks
• Reward: 144 ticks
• Risk/Reward Ratio: 4.5 R
Target may be adjusted if relative volume and delta support strong momentum toward April 2nd highs.
________________________________________
Scenario 2: Further Consolidation
• Sellers push prices back into last week's balance/value area.
• Market consolidates and builds energy for a likely next leg higher.
• No short setup is presented, as current risk and stop placement do not justify initiating short positions.
Important Notes:
• These are example trade ideas not intended to be a recommendation to trade, and traders are encouraged to do their own analysis and preparation before entering any positions.
• Stop losses are not guaranteed to trigger at specified levels, and actual losses may exceed predetermined stop levels.

OTEUM EXPERT CALL: SP500 – Pre‑FED Crumb‑ChaseOTEUM EXPERT CALL: SP500 – Pre‑FED Crumb‑Chase 🍞🚀
Market’s in grind‑up mode ahead of the FED 💹, squeezing what’s left toward those major swing targets & looming resistance walls 🧱. Only a few tasty crumbs remain on the upside—grab ‘em quick, trail tight, and don’t overstay the party 🎉⚠️.

Follow through to the upside is expectedFollow through to the upside is expected on the daily chart in the S&P 500 with an upside objective of 5750.

CME Gap Fill IdeaShort until the gap, then long.
Daily S&P E-mini futures chart, a failure to remain above the 200 EMA and failure to reach the 200 MA, now pushing on the 50 EMA and MA and a confirmed death cross.
We have a CME gap between 5332-5355 (so approx 5345ish as a target).
Scenario here is a move down to the gap to act as a springboard to get back above the 50/200 EMAs and MAs and have it cross back over.
Resistance area aligns with 200 MA.
Pattern formed looks like an inverted HS or possibly a quasimodo.

How to Set Up and Use OCO Orders on TradingViewThis tutorial video explains what OCO (Order cancels orders) are, how they work, how to place them in Tradingview, and how they relate to bracket orders.
You'll learn how to add them to new entry orders as well as existing positions.
There is a substantial risk of loss in futures trading. Past performance is not indicative of future results. Please trade only with risk capital. We are not responsible for any third-party links, comments, or content shared on TradingView. Any opinions, links, or messages posted by users on TradingView do not represent our views or recommendations. Please exercise your own judgment and due diligence when engaging with any external content or user commentary.

ES_F | Daily Chart | 07 MAY 2025Scales
- S: 4916 to 5481 completed G>Y
- M: pending at 6131 min., 6884 max
- L: pending at 4789
Forecast & Targets
- ST: limited upside to 5764.29 min, 5971.85 max
- MT: bearish to 4789.57
- LT: rally to 6884.94 max (SEP 2026)
#ES #SPX #SP500 #ES_F

Waiting for the FedThe S&P 500 structure on the daily chart is set up for the Fed comments on Wednesday. A break lower with a shadow at the lows would be typical behavior.

ES (2025/05/06)In line with my previous analysis.
But at this moment, I am seeing trivial fluctuations so I do think there will be more up space in the near term. Target price is still quite far, and I am seeing strong volume when there are "Buying the dip" opportunity vs. very weak trivial volume when it comes to dumping.
Patiently waiting for TP to reach, so that I could close out some of the longs to realize.
MES1!/ES1! Day Trade Plan for 05/06/2025MES1!/ES1! Day Trade Plan for 05/06/2025
📈 5625 5638 5650
📉 5614 5602 5590
Thanks to all my followers! Truly appreciate the support!
Please like and share for more ES/NQ levels Tues & Thurs 🤓📈📉🎯💰
*These levels are derived from comprehensive backtesting and research and a quantitative system demonstrating high accuracy. This statistical foundation suggests that price movements are likely to exceed initial estimates.*

ES weekly trading plan for May 6 - May 9ES closed bullish last week. I expect the high of previous weekly candle to be taken out. 15M structure is bullish and in discount zone. I expect manipulation in London open on Tuesday, reversal and move to previous week high

#ES1! "E-Mini S&P500" Index Market Bullish Robbery Plan🌟Hi! Hola! Ola! Bonjour! Hallo! Marhaba!🌟
Dear Money Makers & Robbers, 🤑 💰💸✈️
Based on 🔥Thief Trading style technical and fundamental analysis🔥, here is our master plan to heist the #ES1! "E-Mini S&P500" Index Market Heist. Please adhere to the strategy I've outlined in the chart, which emphasizes long entry. Our aim is to escape near the high-risk YELLOW MA Zone. It's a Risky level, overbought market, consolidation, trend reversal, trap at the level where traders and bearish robbers are stronger. 🏆💸"Take profit and treat yourself, traders. You deserve it!💪🏆🎉
Entry 📈 : "The vault is wide open! Swipe the Bullish loot at any price - the heist is on!
however I advise to Place buy limit orders within a 15 or 30 minute timeframe most recent or swing, low or high level. I Highly recommended you to put alert in your chart.
Stop Loss 🛑:
Thief SL placed at the Nearest / Swing low level Using the 3H timeframe (5440) Day/Swing trade basis.
SL is based on your risk of the trade, lot size and how many multiple orders you have to take.
🏴☠️Target 🎯: 5730
💰💵💸#ES1! "E-Mini S&P500" Index Money Heist Plan is currently experiencing a bullishness,., driven by several key factors. .☝☝☝
📰🗞️Get & Read the Fundamental, Macro Economics, COT Report, Geopolitical and News Analysis, Sentimental Outlook, Intermarket Analysis, Index-Specific Analysis, Future trend targets with Overall outlook score... go ahead to check 👉👉👉🔗🔗🌎🌏🗺
⚠️Trading Alert : News Releases and Position Management 📰🗞️🚫🚏
As a reminder, news releases can have a significant impact on market prices and volatility. To minimize potential losses and protect your running positions,
we recommend the following:
Avoid taking new trades during news releases
Use trailing stop-loss orders to protect your running positions and lock in profits
💖Supporting our robbery plan 💥Hit the Boost Button💥 will enable us to effortlessly make and steal money 💰💵. Boost the strength of our robbery team. Every day in this market make money with ease by using the Thief Trading Style.🏆💪🤝❤️🎉🚀
I'll see you soon with another heist plan, so stay tuned 🤑🐱👤🤗🤩


