ES : Short levelThe level has been activated, so you can short it. I have slightly edited it since last time. It is best to scalp or pip it; I cannot promise any significant movement. Be careful when trading on news or at market close/open.
MES1! trade ideas
The market is concernedThe structure of the S&P 500 daily chart implies a market that is concerned. Although many of the fundamentals released on Thursday were basically meeting market expectations, there is concern about the impact of the tariffs there is concern about geopolitical factors and there is concern about how the market will absorb Friday's economic numbers. Sellers are here but will they have a reason to follow through to the downside as we go into the weekend.

**07/31/25 Trade Journal, and ES_F Stock Market analysis **
EOD accountability report: +
Sleep: 5.5 hours
Overall health: Good
** VX Algo System Signals from (9:30am to 2pm) **
— 9:00 AM Market Structure flipped bullish on VX Algo X3
— 9:30 AM VXAlgo ES X7 Sell signal
— 9:32 AM Bullish market structure got cancelled
— 11:40 AM VXAlgo NQ X1 Buy Signal
— 12:40 PM VXAlgo NQ X1 Sell Signal
— 1:00 PM Market Structure flipped bullish on VX Algo X3!
— 1:22 PM if we lose 6415 and stayy under it . Bullish Market structure is cancelled.
— 1:55 PM VXAlgo NQ X1 Buy Signal
What’s are some news or takeaway from today? and What major news or event impacted the market today?
Today marked the 4th day of the structure signals being iffy as they try to tip the volumes bullish just to cancel it right afterwards.
I was starting to get a bit tilted today as I had a bunch of orders at area that didn't get filled and eventually just gave up trying to have a green day and walked away.
looking at some of the other charts, i also we are getting a doji on the longer time frames and it is starting to look like bear's wet dream.
However, Mag 7 stock earnings were really great, the only downside was rate cut isn't happening.
News
*U.S. STOCKS END LOWER, VIX JUMPS AS S&P 500, NASDAQ RETREAT FROM RECORDS DESPITE MONSTER META AND MICROSOFT EARNINGS
What are the critical support levels to watch?
--> Above 6415= Bullish, Under 6403= Bearish

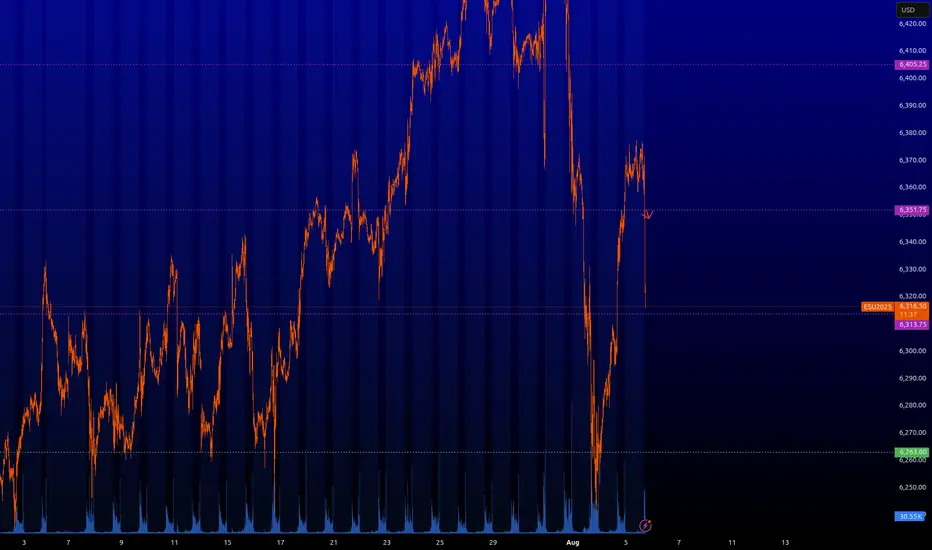
Retail Used Indicators. You Used Structure. You Got Paid.MES printed a textbook quant setup today, delivering a high-confidence breakdown that played out almost mechanically. Price action first broke down from a well-respected rising trend channel, then pulled back into the 50% Fibonacci retracement zone at 6,426.75, drawn from the recent swing high at 6,457.50 to the low at 6,395.75.
The retracement also aligned with a heavy volume node, which acted as a clear supply zone. What followed was a rounded retest structure that resembled a teacup formation not as a bullish setup, but rather as a liquidity bait, luring in breakout buyers before delivering a clean rejection from the equilibrium zone.
This type of structure a trend line break + fib pullback + rounded retest + expansion move is one of Staakd’s high-probability short patterns, historically completing the measured move back to 0% (6,395.75) over 70% of the time. That target has now been hit, and with price currently consolidating below the broken structure and inside a low-volume area, we could now see a secondary move toward 6,375 if 6,395 fails to hold. If instead we see a relief bounce, the optimal re-entry zone sits between 6,410 and 6,420, just beneath the broken fib and previous channel floor.
This is one of those trades where structure, volume, and historical probability all lined up. The teacup retest served its purpose: trap liquidity, reject from the midpoint, and release pressure into the lower range. Unless MES reclaims 6,430, the bias remains firmly bearish.
These setups tend to show up 9–14 times per year on MES alone, especially during high-volume NY sessions or post-news volatility. What you’re looking for is a strong, clean trending structure that finally breaks then watch for a pullback to the 50–61.8% retracement zone, ideally aligning with a volume node or prior support. Often, this retest forms a rounded “teacup” shape a trap zone that attracts late buyers just before the breakdown. Once that zone rejects with momentum, price tends to expand cleanly toward the 0% fib level, or even extend further.
Track this pattern. Log it. It’s one of the most repeatable, mechanical moves we see in futures and when it shows up, it usually pays.
My recommendation is simple: ditch the clutter. Most retail traders are buried under recycled YouTube strategies, lagging indicators, and overcomplicated systems. The truth? Price structure, volume, and basic fib geometry are more than enough to build consistent trades. Go back to basics. Read the chart, not the noise. You'll be surprised how quickly your trading improves when you stop outsourcing your bias to indicators and start trusting clean, mechanical setups like this.

NQ GC ES, Daily Orderflow and Weekly OutlookCME_MINI:NQ1! COMEX:GC1! CME_MINI:ES1!
Time for the final AMDX

07/29/25 Trade Journal, and ES_F Stock Market analysis EOD accountability report: +734
Sleep: 5 hours
Overall health: Been struggling with sleep due to heat waves
VX Algo System Signals from (9:30am to 2pm)
— 8:00 AM Market Structure flipped bearish✅
— 9:30 AM VXAlgo NQ X3 Buy Signal✅
— 9:36 AM Market Structure flipped bullish on VX Algo X3! ❌
— 11:49 AM VXAlgo ES X1 Buy signal✅
— 11:59 AM VXAlgo NQ X1 Buy Signal❌
What’s are some news or takeaway from today? and What major news or event impacted the market today?
Today was one of the few short the resistance day and refreshing to see after we been grinding ATH (all time highs)
News
— 1:30 PM
🇺🇸🇨🇳 *CHINA SAYS IT AGREES WITH US TO EXTEND TARIFF TRUCE
What are the critical support levels to watch?
--> Above 6395= Bullish, Under 6374= Bearish

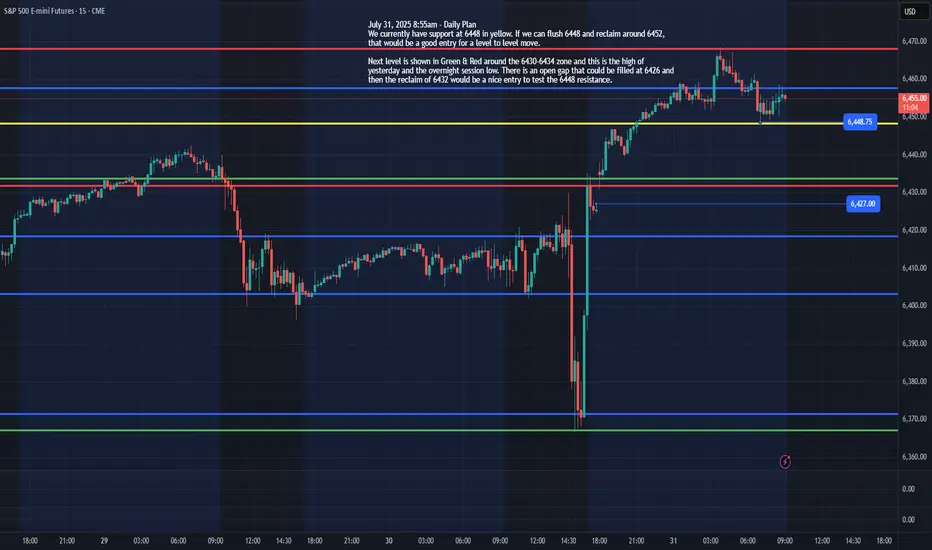
ES - July 31st Daily PlanJuly 31, 2025 8:55am - Daily Plan
We currently have support at 6448 in yellow. If we can flush 6448 and reclaim around 6452, that would be a good entry for a level-to-level move and target 6460, 6468.
Next level is shown in Green & Red around the 6430-6434 zone, and this is the high of yesterday and the overnight session low. There is an open gap that could be filled at 6426 and then the reclaim of 6432 would be a nice entry to test the 6448 resistance, could then continue to move higher to 6460, 6468+.
Those are the areas I will be looking to grab some points today!
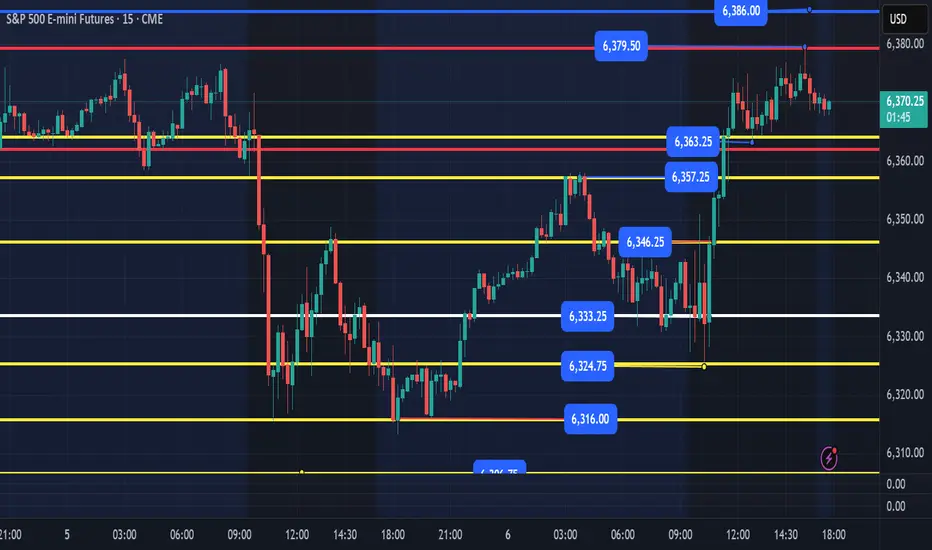
ES - August 6th Evening Open / August 7th Daily Trading PlanWe held the 6324 level today and institutional buyers stepped in at this level and we rallied to our targets for the day. We currently have our first support down at 6363 level and an ultra-bull case for tomorrow is to build a flag and break out above 6380 with targets of 6386, 6402+
Ideally, we would pull back overnight and flush 6344, 6323 or the 6315 level and reclaim for a nice move up the levels. Either way, trend is still up, and short-term bulls need to hold 6315 level, or we will probably retest the levels below at 6297, 6280, 6252 and then the Friday's low of 6240.
I will update my August 7th trading plan tomorrow am as we need to see what price does in the evening session. My lean is we don't lose 6344, but any flush and recovery of levels outlined we should continue up higher.
Potentially more volatilityThe daily chart in the S&P 500 implies the possibility of additional volatility as more fundamental news is revealed on Thursday and Friday. The bias currently is for continuation to the upside.

Choppy all day till 11AM PTLooks like it'll be one of those days until 11 :(
What are your thoughts?
Call trade nasdaq? Curious to know how other sectors are. I only track Mes
ES - August 4th, 2025 - Daily Trade PlanI am providing my plan for the session and will update before 8am EST with overnight session price movement and what I am looking to do during the 9:30am EST session. All levels below are labeled or colored.
6:07pm EST - Opening Session Overview for August 4th, 2025 - Daily Trade Plan
We could very well dip to 6230-40 range and then move back up the range to retest the 6375 level. The key levels I will be looking to reclaim and take some points from are as follows:
Resistances – 6297, 6315, 6330, 6350, 6370
Supports – 6240, 6225, 6190.
Ideally, we lose Fridays low of 6239 and reclaim it for a level-to-level move. If not, we need to continue to build structure between 6296 and 6240. 6275 was rejected 2x on Friday late and if we clear 6275, a back test of this would be a good place to grab points to 6296 and then possibly continue to 6315, 6330, 6350, 6370.
I will not be shorting or engaging in any level below 6240, unless structure builds at the 6225, 6190 lowest it would want to go.
Update will be provided by 8am EST for 9:30am EST Session open.

Nq & Es Key Levels & Daily Bias 08-08-2025Today’s bias is once again bullish, aiming for those all-time highs.
When the market opens at 09:30, I’d like to see price dip into discount zones or take out some lows first — that would set up a nice rally upward and a potential long opportunity.
If that doesn’t happen, I’ll stay on the sidelines. No chasing longs in premium territory.
Enjoy the day no matter what happens, and keep learning so you’re sharper tomorrow.
We’ll check back later to see how it played out.
Long ES.. Probably a long in play if we cross/close above CISD as marked.. target the internal BSL as our target.. we sweep to ERL .. If you think i have drawn these incorrectly, i am happy to learn. Thank you

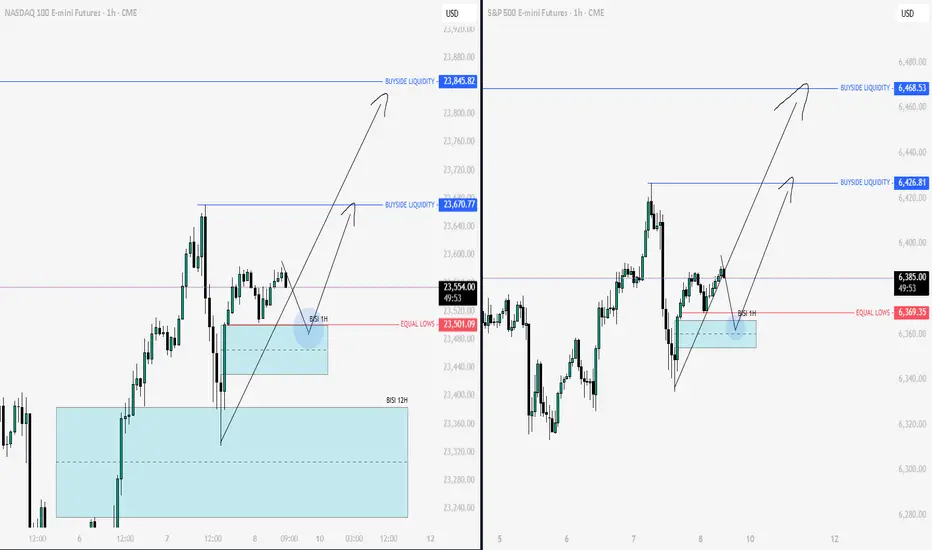
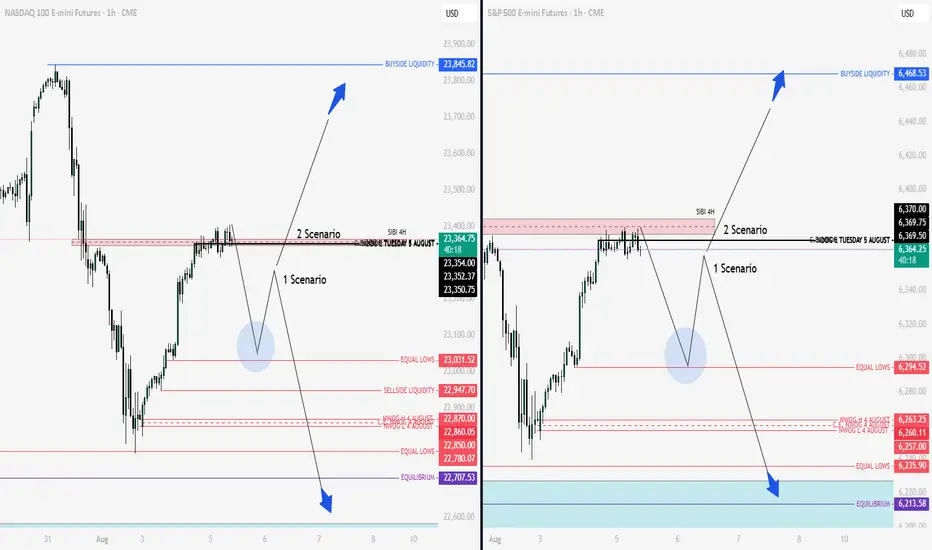
Nq & Es Key Levels and Scenarios 05-08-2025 We are currently positioned in a premium zone. This suggests that the price is likely to seek lower levels within discount areas. Therefore, upon the market opening, it will be crucial to observe price action in light of the increased volatility expected to enter the market.
The prevailing bias is that prices are likely to decline toward the predefined zones indicated on the chart. Depending on how price reacts at these key levels, we will be able to assess whether the downward movement will continue or if significant support will emerge, potentially leading to a full reversal to the upside.
In summary, there may be initial shorting opportunities, followed by potential long setups depending on the market’s reaction. Two scenarios have been outlined.
Wishing you all successful and well-considered trades.
Potential transitionThe S&P 500 daily chart has gotten down to levels that buyers have entered this market previously. This means be cautious on the short side and be aware of the fundamentals that will be released on Wednesday.

Futures reject at supply, bear flag forming?The market has sold off big time to round out last week and has been chopping around in a recovery for the past few days.
I decided to make a little channel from the bottom to the recent lows and it looks like we broke the bottom of the channel and then managed to get back into it, of course if we can break out above the channel that is hyper-bullish because a ton of shorts will be trapped after the initial break.
On the other hand, a false break on a channel is less likely than a follow-through, so odds would indicate bearish sentiment.
I checked the volume profile of the previous sessions and it looks like supply/demand has acted as a good spot for support and resistance levels. Today we bid right up to the supply level and sold off all the way to the demand level, supply acted as resistance and demand acted as support and we ended roughly in the middle of the two zones.
Overall, it doesn't really tell you much, but the coming days will paint the picture better.
If we can break below 6340 I would expect an attempt at 6250 and possibly lower.
If we can break above 6425 then we can go to new all time highs.
Overall I am leaning slightly bearish, but watching for price action confirmation.

Day 4 — Trading Only S&P Futures — +$207, Patience Pays OffWelcome to Day 4 of Trading Only S&P Futures!
After two tough losing days, I took a morning yoga session to clear my mind and approach the market calmly. I started trading late but found a strong A+ setup near 6355, aligned with a major gamma zone and RSI signals, which led to a $200+ profit.
📈 What you’ll learn
The importance of mindset and mental clarity in trading
How to identify strong setups using market structure and gamma zones
Reading RSI on multiple timeframes for confirmation
Managing risk and knowing when to call it a day
⏰ Timestamps
0:00 — Intro & Day 4 Overview
0:30 — Mindset Reset & Trade Recap
1:30 — VX Algo Signal Recap & Setup Breakdown
3:00 — Market News & Impact
3:30 — Key Levels for Tomorrow
4:00 — Closing Thoughts & Next Steps
🔔 VX Algo Signals (9:30am – 2pm EST)
9:39 AM Market Structure flipped bullish on VX Algo X3!
11:20 AM VXAlgo ES X1 Buy signal (triple buy)
11:52 AM VXAlgo ES X1 Buy signal
12:40 PM VXAlgo ES X1 Sell signal
📰 News Highlights
U.S. jobless claims rose to 226,000 vs. estimate 221,000, signaling increased layoffs.
🔑 Key Levels for Tomorrow
Above 6332 = Remain Bullish
Below 6315 = Bearish

After the morning forecast 07-08-2025As we saw, it finally happened, the price dropped, giving us shorting opportunities and now we probably have to look for Longs... tomorrow we'll meet here at 09:00 Am NY Time.

Nq & Es Key Levels 04-08-2025 After MarketClosing exactly at the level I gave this morning...Incredible Accuracy...Just see the previous post to understand

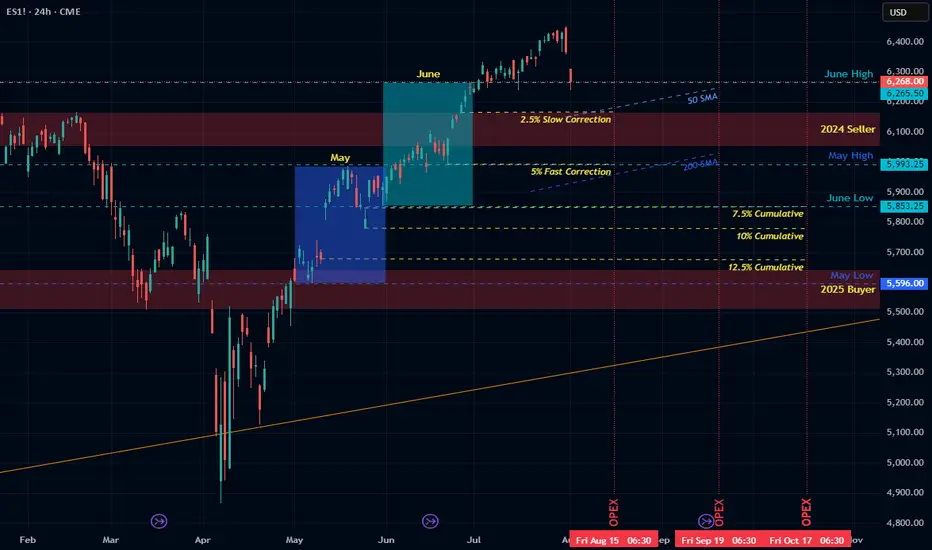
Path into Q3Outlook for the Next Few Months
• Now–August OpEx: -2.5% to -5% slow correction
• August–September OpEx: potential 5–7.5% additional decline
• By late Q3: cumulative 10–12.5% drawdown (target S&P ~5700).
• October: possible bounce — or acceleration if data worsens
• End of Year: risk of deep drop à la Oct–Dec 2018 if trends continue
Macro Backdrop
• Watch for margin compression, CPI surprise, and unemployment uptick
• Private data shows more fragility than government numbers
• QRA-driven liquidity tightening may amplify downside risk
Political Timing and Fed Policy
• Administration may welcome controlled decline to enable early 2026 rate cuts
• If market doesn’t decline soon, blow-off top/melt-up into midterms possible
Neutral close with the bullish biasThe structure of the daily S&P 500 chart implies a neutral structure from Thursday with a bullish bias based on the last three trading sessions. If buyers are here a close above 6425 is the objective for Friday

SP500 E-Mini Futures will pump to 6,442.00 and then dump hardSP500 E-Mini Futures is showing in the lower timeframes a possible continuation at least more 6,30% reaching the 6,442.00 mark and at the same time with some bearish divergences in the higher time frames that if the price gets there could iniate a pullback between 30% and 40% to bring the price back slight below 4,000.00 at the end of next year possibly.

07/28/25 Trade Journal, and ES_F Stock Market analysis EOD accountability report: +405
Sleep: 5 hours
Overall health: meh
VX Algo System Signals from (9:30am to 2pm)
— 9:00 AM Market Structure flipped bullish❌
— 10:04 AM VXAlgo ES X1 Buy signal! ✅
— 11:21 AM Under 6424, the structure is bearish. Don't avg down! ✅
— 11:40 AMVXAlgo NQ X1 Buy Signal! ✅
— 12:40 PM VXAlgo NQ X1DD Sell Signal! ✅
— 1:30 PM VXAlgo ES X3DD Sell Signal! ✅
What’s are some news or takeaway from today? and What major news or event impacted the market today?
Today was one of the few short the resistance day and refreshing to see after we been grinding ATH (all time highs)
News
Eu trade deal over the weekend,
& china tariff extension.
What are the critical support levels to watch?
--> Above 6395= Bullish, Under 6374= Bearish
