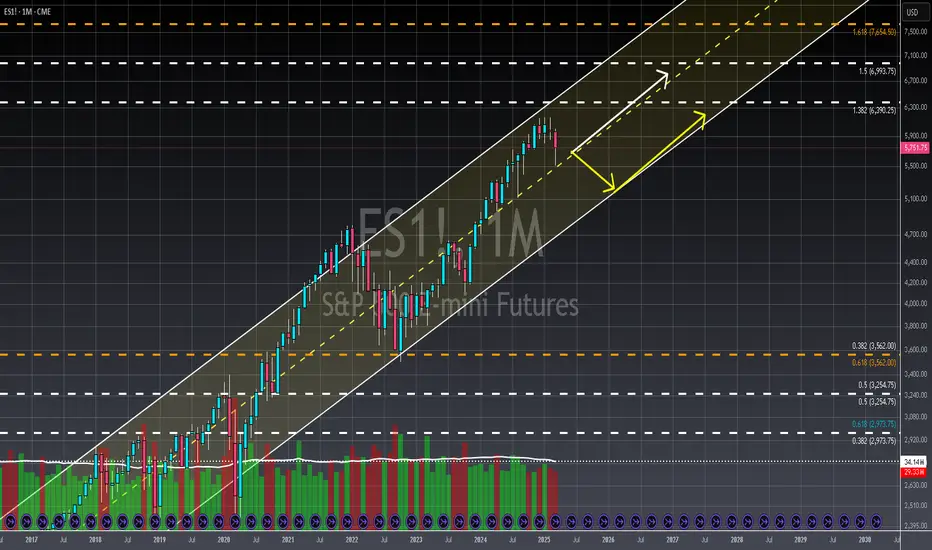
ES1! - Monthly - Grand Scheme of ThingsClick Here🖱️ and scroll down👇 for the technicals, and more behind this analysis!!!
________________________________________________________
________________________________________________________
..........✋NFA👍..........
📈Technical/Fundamental/Target Standpoint⬅️
1. Long-Term Perspective: While recent market volatility may induce panic, it's crucial to acknowledge the S&P 500's overarching upward trend. Periods of consolidation are inherent to sustained rallies, allowing the market to build momentum for further advances. However, given prevailing economic uncertainties—including inflation, tariffs, and signs of rally exhaustion—a healthy correction towards Q1-Q2 2024 price levels is plausible.
2. Short- to Medium-Term Outlook: A near-term retest of the 6,000 level is anticipated, followed by a subsequent retracement. In this period of heightened uncertainty, a cautious approach is recommended for bullish positions.
3. Technical Considerations: Current weekly and monthly chart patterns remain in development. In light of this, prioritizing the preservation of existing gains is paramount, a strategy that appears to be underemphasized in current market discussions.
==============================
...🎉🎉🎉Before You Go🎉🎉🎉…
==============================
Leave a like👍 and/or comment💬.
We appreciate and value everyone's feedback!
- RoninAITrader
MES1! trade ideas
New tariffs on China push the S&P 500 lowerThe possibility of a trade war with China increased as the US added another layer of tariffs on China bringing the total to 104%. This new uncertainty implies continued downward pressure in the S&P 500. I am looking for a sideways price movement.

ES Update, 104% China Tariff Edition, lol.As you can see, MFI hit overbought before open. Unfortunately, I didn't have time to post before work.
Stupid algos pumping before bad news again, they even pumped China, so I bought some MCHI (China ETF) puts in the morning. WHy would anyone pump CHina before a tariff announcement?!?!
I don't see Xi or Trump backing down, if anyone falters, it'll be COngress. The issue is that it will take a 2/3 majority in both houses to override a veto, so they probably won't be able to muster up enough support until next week at the earliest Then Trump can sit on the bill for 10 days before he vetos.
There's not a parts supplier in China that's gonna pay 104% tariff, which means stop ship on everything. And we're looking at bare minimum of 11 days before tariffs can be repealed, probably gonna be at least 3 weeks. Even at that pace, it's gonna create a shipping backlog, empty shelves, parts shortage, and temporary layoffs at manufacturing plants just like COVID did.
What's this all mean? IF YOU NEED ANYTHING THAT'S MADE IN CHINA, GO SHOPPING RIGHT NOW! I'm not kidding. It may cause issues even with stuff like frozen dinners because China makes all of the containers.
ANyways, the algos screwed up again. RSI probably goes deep into oversold again. We get a huge ass bounce when COngress gets their shit together in a week or two. Even then, some companies will have lingering effect because I can guarantee there will be a shipping backlog when the tariff is lifted.

VPO charts with MAsI have added the US02Y treasury to my RSI and WOW.
I set up some volume templates using CC colors. Kept it very minimal. Sessions in light blue teal. Days in blue. Weeks in yellow. Months in purple. Could add more or change as desired.
I turned off boxes for most but I like the weekle box. In fact the more I can turn price into boxes the better. Let me now finish talking to Grok and I'll send some examples.

ybr 4-7-25wealth building yellow brick road for 4-7-25 collecting $76.50 with $923.50 risk breakeven 419.23 ... 39 days to expire ... roi year 76%

The Trump PatternWhen Donald Trump took office in 2017, the U.S. stock market experienced dramatic fluctuations—marked by steep declines followed by eventual rebounds.
This pattern, which we'll call the "Trump Pattern," repeated itself during his presidency and is now emerging again as a point of interest for investors.
While the specific causes of these market shifts varied, key factors—particularly tariffs, inflation concerns, and Federal Reserve (FED) actions—played critical roles in the market's rise and fall during Trump’s presidency.
The Trump Pattern: The Market Fall and Recovery
🏁 1. The Start of the Trump Presidency (2017)
When Donald Trump was elected in 2016, the market responded with a combination of excitement and uncertainty. Initially, the market surged due to tax cut expectations, deregulation, and optimism about a business-friendly administration. But as Trump's presidency fully began in January 2017, concerns over trade wars and tariff policies began to dominate investor sentiment.
The market initially dipped after Trump began pursuing a protectionist trade agenda, especially with China.
As concerns about tariffs escalated, stock markets reacted negatively to potential trade wars.
💶 2. The Tariff Crisis of 2018
The first major example of the "Trump Pattern" emerged in 2018 when Trump began implementing tariffs, particularly on Chinese imports, and announced new tariffs on steel and aluminum. This caused major market disruptions.
The S&P 500 fell dramatically during this period, dropping by as much as 8.6% from its February peak in 2019.
Companies that relied heavily on international trade, like Apple, General Motors, and Ford, experienced significant stock price declines. In fact, Apple’s stock fell 9.5% on days when new tariffs were announced, as their costs for manufacturing overseas rose.
The uncertainty surrounding the global economy, combined with rising tariffs, created fears of a trade war, leading to sharp market declines.
📈 3. Market Recovery: FED Rate Cuts and Tax Cuts
Despite the tariff-induced volatility, the market didn’t stay down for long. After significant market falls, the Federal Reserve (FED) began implementing interest rate cuts to combat slowing economic growth. These actions helped stabilize the market and even fueled a rebound.
FED rate cuts made borrowing cheaper for consumers and businesses, stimulating economic activity and boosting investor confidence.
Additionally, tax cuts, a cornerstone of Trump’s economic policy, provided further support, particularly for corporations.
As a result, after the initial market drop in 2018 and early 2019, the market rebounded, continuing to climb as investors reacted positively to these fiscal and monetary policies.
🎯 The 2024 and 2025 "Trump Pattern" Emerges Again
Fast forward to 2024 and 2025, and we’re seeing echoes of the "Trump Pattern" once again. New tariffs, introduced in 2025, have reignited concerns about a trade war. These tariffs, particularly on Chinese imports, have once again caused market volatility.
The stock market has fallen in recent months due to concerns about these tariffs and the impact they might have on global trade. For example, when new tariffs were introduced in early 2025, the market saw a sharp sell-off, with the S&P 500 falling by over 1.8% in a single day.
Companies that rely on international trade, like Tesla and Ford, have seen their stock prices drop in response to concerns about increased production costs.
The broader market decline, much like in 2018, was driven by fears that tariffs could slow down the global economy and hurt corporate profits.
However, there is optimism that the same pattern will unfold, where the market eventually recovers after these initial drops.
⚠️ 4. FED Rate Cuts Again?
As inflation concerns persist, the Federal Reserve is likely to step in once again. Like previous cycles, we expect the FED to cut interest rates to stimulate the economy. This would be aimed at reducing borrowing costs, encouraging investment, and helping businesses weather the impact of higher tariffs and global uncertainty.
The FED’s actions are typically a key driver of market recovery in the "Trump Pattern." Investors have come to expect that a market downturn triggered by political or economic disruptions can be offset by the FED’s supportive monetary policies.
⚖️ Navigating the Trump Pattern: What Should Investors Do?
The "Trump Pattern" highlights that during periods of heightened uncertainty, especially due to trade policies like tariffs, the market will often experience short-term declines followed by long-term recovery. Here are a few strategies investors might want to consider:
Stay Diversified : During periods of volatility, having a diversified portfolio can help cushion against the risks posed by market swings.
Invest in Domestic Companies : Companies that rely less on international supply chains might fare better during periods of trade policy changes and tariff uncertainty.
Focus on Growth : Once the initial market decline subsides, look for sectors that stand to benefit from a recovering economy, such as tech or consumer discretionary stocks.
Look for Inflation Hedges : Given the potential for inflation, consider investments that tend to perform well during these times, such as real estate or commodities like gold.
📝 Conclusion: The Trump Pattern in Action
The "Trump Pattern" demonstrates how the market tends to react in cycles during the early months of each presidency. Typically, the market falls at the start due to the uncertainty surrounding Trump’s trade policies, particularly tariffs. However, after these initial drops, the market often rebounds thanks to FED rate cuts and other policies aimed at stimulating the economy.
Looking ahead to 2025, we're already seeing signs of this pattern in action as tariffs are back on the table and market volatility has followed. However, history suggests that patience might pay off. Once the FED steps in and cuts rates, a market rebound is likely, following the same trend we saw in 2017-2019.

ES (SPX) Intraday ChartBTW, what the hell kind of intraday chart is this? Strangest trading day I've ever seen.
Did anyone else look at the chart and just laugh? Algos run amok trying their best to prop up the market.
ES UpdateLike I said over the weekend, the algos are definitely on, explains the whipsaw Fri and today. Everything is oversold so they had to pump it and try to get their money back.
Problem is, Trump is gonna announce 50% tariff on China tomorrow. CHina ain't backing down, not their style.
QUote:
"Therefore, if China does not withdraw its 34% increase above their already long term trading abuses by tomorrow, April 8th, 2025, the United States will impose ADDITIONAL Tariffs on China of 50%, effective April 9th."
Source:
www.cbsnews.com
Might have to short something tomorrow morning, lol.
A catch your breath dayAfter the volatility over the last three sessions, the market structure implies an inside day for Tuesday to catch its breath.

Paradigm Shift or Panic Selling? ES Futures Weekly PlanCME_MINI:ES1!
Macro Update:
The escalation of reciprocal tariffs and China's countermeasures have sent shockwaves through markets, with widespread selloffs across asset classes, including gold. Fund managers and investors were forced to liquidate positions to cover margin calls. The likelihood of a global recession has surged, with Goldman Sachs raising the probability of a US recession to 45% from 35%. Meanwhile, JPMorgan increased its global and US recession odds to 60%, up from 40%, due to intensifying tariff tensions.
The March 2025 Federal Reserve’s SEP projections suggest slowing growth amid rising inflation concerns, pointing in the right direction. Is this a paradigm shift, or was it already set in motion earlier in the decade? Or is this simply panic selling, with the expectation that US administration policy will soon stabilize markets?
If it is a paradigm shift—as seems more likely based on recent developments—the current environment could prove historic, aligning with Ray Dalio's concepts on the changing world order, debt crises, and how nations go bankrupt.
Investor Confidence: ES futures are currently down over 20%, entering bear market territory for the first time since the 2020 pandemic crash. The big question now is whether we’ll see a relief rally or continued sell-offs with occasional pullbacks, or if markets are establishing a new value range based on auction market principles.
• 2024 YTD mCVAL: 5379.75
• 2022 CVAH: 5376
• March 2025 Low: 5533.75
• August 5th, 2024 Low: 5306.75
• Neutral LVN: 5191.50 - 5156.25
• April 4th, 2025 Low: 5074
• 2024 Yearly Low: 5016.25
• CVPOC 2022: 4610.50
Scenario 1: Further Downside The key downside level for ES Futures is 4610.50, where the most volume has been transacted since 2022. Currently, ES Futures are trading above this level. If the market establishes a value range between 4900 and 4500, further selling with brief pullbacks and consolidation above the 2022 CVPOC seems likely.
Scenario 2: Relief Rally For a rally to take hold, ES Futures faces key resistance levels: the 2024 Low at 5016.25 and the pWeek Low at 5074. If markets sustainably stay above these levels, we could see a rally toward the 2022 CVAH at 5376. However, the sustainability of such a rally remains in question given the mountain of uncertainties ahead.
It is important to note that uncertainty tends to create highly volatile market regimes. Traders should adjust the expected daily range accordingly. A good indicator to measure this is “Daily Average True Range”, many traders also rely on close-to-close standard deviation bands to gauge range on a given trading day. As such, we could see moves of 3% or more in either direction on any day.

ES where?📉 ES1! - S&P 500 E-mini Futures (Daily)
We’re approaching a critical point on the long-term trendline.
🟠 Price has bounced sharply after a steep pullback, reacting right at the dynamic support that’s held since the 2022 lows.
🟢 Two possible scenarios:
Bullish Continuation: support holds, the index regains momentum and pushes back toward the highs.
Bearish Breakdown: trendline breaks, signaling a potential structural shift with downside targets possibly below 4000.
📊 Momentum indicator is in extreme territory → wait for confirmation, don’t anticipate.

This is Wyckoff Volume Spread Analysis Gotcha Bar with No DemandIn this short video, Author and Trader, Gavin Holmes explains a Wyckoff Volume Spread Analysis Gotcha Bar followed by No Demand on the four hour chart of the E-Mini S&P Futures contract.
This set up appeared last week and again today and is a clear indication of market weakness.
As I type this the headline on BBC News is "Global Markets Plummet as US Tariffs Take Effect.
Panic selling is often an opportunity for the chart readers who can identify a Shakeout, not here yet but watch, I will keep You all posted. Best wishes, Gavin Holmes

4,840 on ES/MES and then an opportunity for bullsim expecting a drop to 4,480 on ES/MES in the morning session. from there i suspect bulls will step in and have a chance to send us up. i will be playing it by ear from there depending on how the bulls respond.
Knowledge is power

Yearly PivotsYou can't make this stuff up. Yearly pivot levels give you a heads up in advance where inventory will be bought and sold. The rest is up to you.

SP500 Weekly Action Areas & Price Targets 07/04/25In this update we review the recent price action in the emini SP500 futures and identify high probability action areas and price targets fort he trading week ahead!


Using Put Options to Protect Your Stock PortfolioCME: Options on E-Mini S&P 500 Futures ( CME_MINI:ES1! )
Last week’s bloodshed of global financial market made history. Nearly all major asset classes fell into a market turmoil driven by tariffs and retaliations.
Let’s focus on the US stock market:
• Dow Jones Industrial Average dropped 7.76% in the week of March 31st to April 4th, making it the 4th worst weekly performance on record
• S&P 500 slipped 8.77%, the 4th worst week in history
• Nasdaq Composite fell 9.18%, the 2nd worst week
• Russell gave up 9.34%, the 3rd worst week
All four stock index futures were in negative territory year-to-date. On Sunday evening, E-Mini S&P 500 opened 178 points lower to 4,932, losing 17.1% YTD.
All parties ultimately come to an end. After two years of double-digit gains, the unstoppable US stock market finally cracked. As more tariffs and retaliations are expected to escalate, I am afraid that we are only seeing the beginning, rather than the end.
For stock investors, this is a good reminder of market risk, something we always talk about but seldomly pay attention to. The “return of investment” should be focusing on the repayment of your money, a safety issue. Only after that should we talk about the gain from the investment. It is a necessity to protect your portfolio to achieve long-term growth.
Trading with Options on E-Mini S&P 500 Futures
For investors with a diversified portfolio, Put Options on the E-Mini S&P 500 futures are effective and cost-efficient tools. Investors who long the stocks will lose money, should stock prices fall. Put options would gain in value, providing a hedge to the portfolio.
The following illustration shows a hypothetical example, given:
• An investor has a $250,000 portfolio holding a diversified pool of U.S. stocks
• CME E-Mini S&P 500 futures ( NYSE:ES ) have a contract size of $50 times the index value
• The June contract (ESM5) was quoting at 4,935 Sunday evening Friday, making the notional value of 1 contract $246,750, approximately equal to our portfolio value
• Assuming the portfolio moves closely in line with the S&P 500
• The investor wants to limit the loss of his portfolio to 12%. If the S&P 500 index is currently around 4950, a put option with a strike price of 4350 would roughly correspond to a 12% decline
Hedging trade illustration:
• The investor buys 1 put option on the June futures with the strike price of 4,600
• CME quote on that Put option is 223. As the contract is $50 times the index, the premium upfront for one put option contract is $11,150 (223*$50), ignoring any commissions
• The put premium is calculated as 4.46% of the $250K portfolio
If S&P drops to 4,200 (-15.15%) by the end of April:
• Without the put, the portfolio lost $37,879, assuming the same loss with the S&P
• The 4600-strike put is now 400 points in-the-money
• The investor sells the put and receives $20,000 (= 400 x 50)
• The loss of portfolio will be 37879+11150-20000 = $29,029
• With an E-mini S&P put protection to mitigate loss from the stock portfolio, the investor lost 11.6% (= 29029 / 250000), which is 3.5% lower than the S&P loss and with the preset loss limit
If S&P drops to 4,000 (-19.2%) by the end of May:
• Without the put, the portfolio lost $47,980, assuming the same loss with the S&P
• The 4850-strike put is now 600 points in-the-money
• The investor sells the put and receives $30,000 (= 600 x 50)
• The loss of portfolio will be 47980+11150-30000 = $29,130
• With an E-mini S&P put protection to mitigate loss from the stock portfolio, the investor lost 11.6% (= 29,130 / 250000)
As we can see here, when the S&P falls sharply, the investor will be able to cap his loss to 11.6%. In a “protective put” strategy, we would consider the option premium an insurance contract for owning stocks. If the index rises, the portfolio return would be lowered a little because of the premium upfront, that is, the cost of insurance. However, the protection is a lifesaver if the index falls.
Before jumping into action, the investor needs to run a correlation analysis using the daily value of the portfolio against the S&P 500 closing prices. Here is how:
• Some trading software has correlation feature built in already
• If not, pull 1-year daily portfolio balance and 1-year S&P closing prices, export them to Excel. Run correlation test with these two data series using Excel data analysis tool.
• Alternatively, we could drop the data into ChatGPT and ask AI to do the work for us.
If the correlation is greater than 50%, it means that S&P 500 is a good fit to hedge the portfolio. If it is not, we could try the correlation analysis using the other stock index closing prices, such as the Dow, the Nasdaq 100 and the Russell 2000. Then replace E-Mini S&P 500 futures with the stock index futures contract best fit the portfolio.
Happy Trading.
Disclaimers
*Trade ideas cited above are for illustration only, as an integral part of a case study to demonstrate the fundamental concepts in risk management under the market scenarios being discussed. They shall not be construed as investment recommendations or advice. Nor are they used to promote any specific products, or services.
CME Real-time Market Data help identify trading set-ups and express my market views. If you have futures in your trading portfolio, you can check out on CME Group data plans available that suit your trading needs www.tradingview.com

ES1 - Took Profit on Shorts, Now Time To Go LongS&P Fear & Greed index hit a deep low of 4 on Friday close.
The herd are in extreme panic and the media have been blaring fear based news so everyone "knows" that its time to sell.
S&P Futures and CFD have gapped down to open the week.
The gap hits a 1:1.618 Golden Window extension.
We haven't yet had any bounce more than a limp 0.382 retracement where a 3 wave continuation pattern topped out as Trump's tariffs came into effect.
And so with no significant bounce, this extension is very deep and there is a decent chance that a significant bullish pivot will print in this area; perhaps tidily within this Golden Window band; between the 1.618 - 1.786 overshoot.
...
The 2022 market top support intersects tidily within the Golden Window.
There will be plenty of short sellers taking profit at this very significant support.
This will be an area of very high liquidity and the market makers love to trade against high liquidity.
...
The Week RSI has gone significantly oversold for the first time since the 2020 Pandemic Crash.
And the day RSI just went sub 18.
The day RSI is actually lower than any time since 2015!
And notice that on the Futures chart above there is a very large gap to open the week.
Considering the aforementioned, there is decent chance that it is an Exhaustion Gap that would precede a bounce.
...
So all of this sets up a nice contrarian trade here.
Even with all these technicals, it is a dangerous positional entry in high volatility chart.
I think we will likely see another bearish wave following a bounce to complete a high time frame correction with a minimum of 3 correction waves.
But a bounce is due really...
I have taken profit on stock shorts positions on Friday, sold my crypto short positions as stock index Futures / CFD opened with this detail.
Now I am positioned long S&P CFD.
Even if it continues to slump, I think this will be due a bounce soon enough.
But a tidy Golden Window catch would be ideal.
Not advice

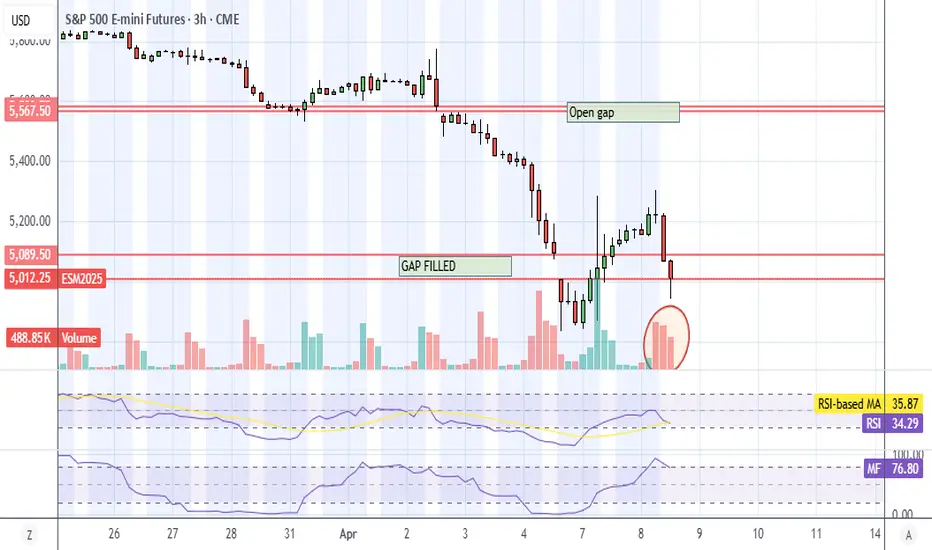
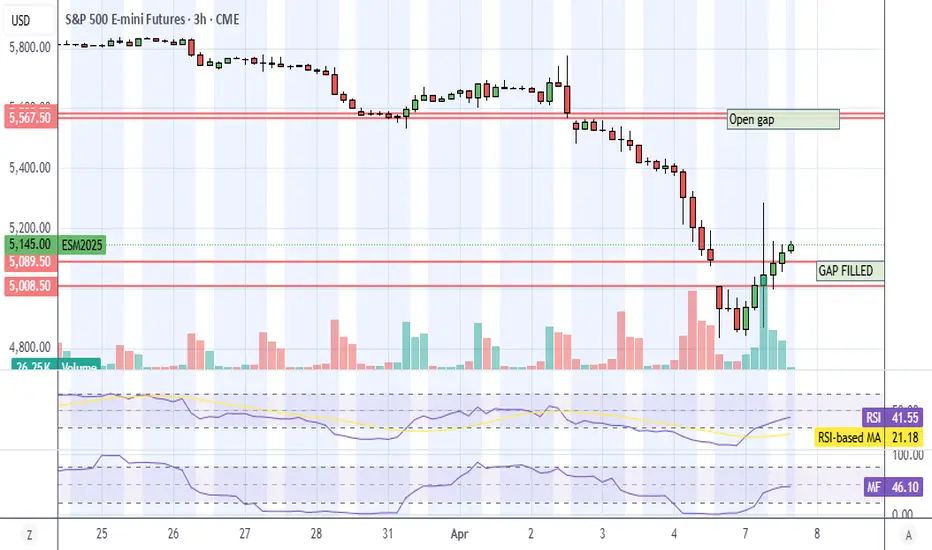
ES1! Open Gap AlertAll futures gaps will fill... but who knows when? We already had an open gap above.
This time around, virtually everything has an open gap. Gold futures have a small open gap, BTC futures have a big ass one, Nikkei, FDAX, the rest of Europe and Asia, oil, silver, and other commodities as well.
XLF will complete the H&S pattern tomorrow, so maybe we get a bounce Tuesday, who knows? Everything's oversold with open gaps, but there's farther to drop if the tariffs aren't reversed somehow. The GOPs in the House aren't ready to cross Trump, so it's up to negotiations or the court system. That's gonna take weeks or months.
Pay attention to the news. Unfortunately, I can't update during the day, and barely have time to read the news myself anyways. Good luck, sorry that I'm not more help.

Weekly Market Forecast: Short Term Buys, Then Sells! In this video, we will analyze the S&P 500, NASDAQ, AND DOW JONES Futures for the week of April 7 - 11th.
The Stock Market Indices may find support at current levels for a Bear Market Rally. Wait for the market structure shift to the upside before taking any buys. Let the market confirm it's intended direction first, then look for valid buy setups for a short term countertrend play.
Enjoy!
May profits be upon you.
Leave any questions or comments in the comment section.
I appreciate any feedback from my viewers!
Like and/or subscribe if you want more accurate analysis.
Thank you so much!
Disclaimer:
I do not provide personal investment advice and I am not a qualified licensed investment advisor.
All information found here, including any ideas, opinions, views, predictions, forecasts, commentaries, suggestions, expressed or implied herein, are for informational, entertainment or educational purposes only and should not be construed as personal investment advice. While the information provided is believed to be accurate, it may include errors or inaccuracies.
I will not and cannot be held liable for any actions you take as a result of anything you read here.
Conduct your own due diligence, or consult a licensed financial advisor or broker before making any and all investment decisions. Any investments, trades, speculations, or decisions made on the basis of any information found on this channel, expressed or implied herein, are committed at your own risk, financial or otherwise.

New World Order?Blue line would thrust us into a new paradigm as we are supposed to be in a ''bull cycle'' part of the big cycle established since 1945. According to my analysis, we shouldn't break 4300 for this recurring 5 years bull and 2 years bear cycles that have been happening for decades.
So red line is the most expected outcome if things are to keep happening as usual.
Either way, the FED put will save us all, so bid 4.5k or 2.7k you'll be fine in a 20-year time horizon.

S&P 500 Futures Plunge: Bearish Dominance Unabated in MarketBearish/Bullish Trend Analysis
Trend Condition:
Bullish Trend Condition: 0
Bearish Trend Condition: 14
Analysis: The market remains strongly bearish as indicated by all 14 trend lines being red. There are no bullish trends present, suggesting persistent downward pressure.
Price Action and Momentum Zones
Closing Price and Change:
The S&P 500 E-mini Futures closed at 4,902.50, down by 194.25 points (-3.81%).
Daily Market Behavior:
Today's sharp decline is consistent with the ongoing bearish trend, with no signs of a reversal or slowdown in the selling momentum.
Momentum Zones:
The market is trending downwards sharply, breaking past previous support levels, which may now act as resistance on any potential rebounds.
Fibonacci Retracement Levels
Current Position Relative to Levels:
The index has fallen below the 50.00% Fibonacci retracement level and is approaching the 61.8% level.
Key Fibonacci Levels:
23.6% → 5,584.26
38.2% → 5,385.65
50.0% → 5,144.15
61.8% → 4,903.11
Interpretation:
The significant drop below the 50% level shows a robust continuation of the bearish trend, with the 61.80% level being the next critical marker to watch for potential support or further decline.
Overall Market Interpretation
The market's continued movement in a downward trajectory with all indicators pointing to a sustained bearish outlook suggests that investors remain cautious and are likely divesting, leading to the observed price declines.
Summary
Today’s significant downturn in the S&P 500 E-mini Futures highlights the ongoing bearish dominance in the market. With the index quickly approaching the 61.80% Fibonacci retracement level, it's crucial to watch for either a stabilization and potential buying opportunity or further declines if this level fails to hold. The lack of any bullish signals currently suggests that caution is warranted, and traders should prepare for possibly extended bearish conditions.
