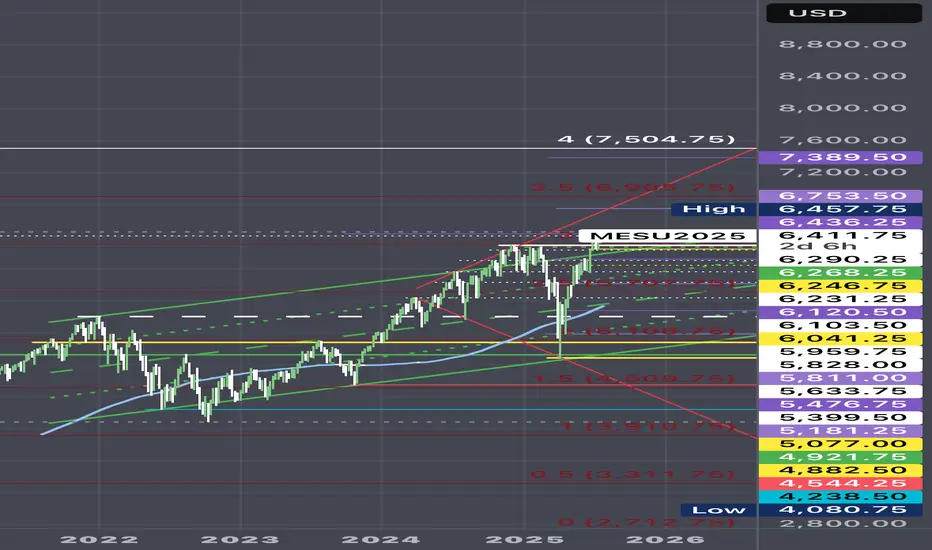
/ES held its main channel!ES held its main channel in the early 2025 dip. Now currently inside the red megaphone with a breakout target of 7500.
MES1! trade ideas
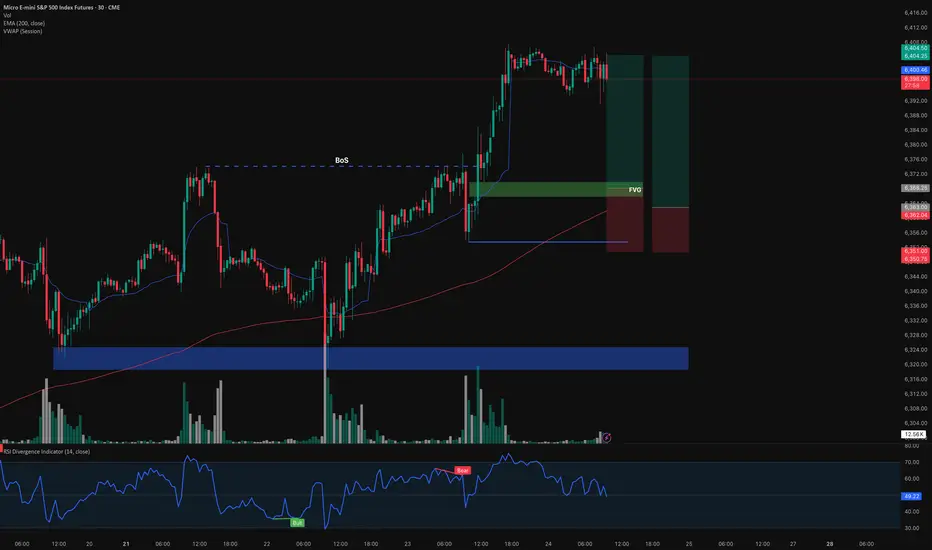
Tech Earnings & Fed Meeting - July 30th - ES 100pt drop?I trade ES Futures and have identified an important support shelf that if broken could accelerate lower.
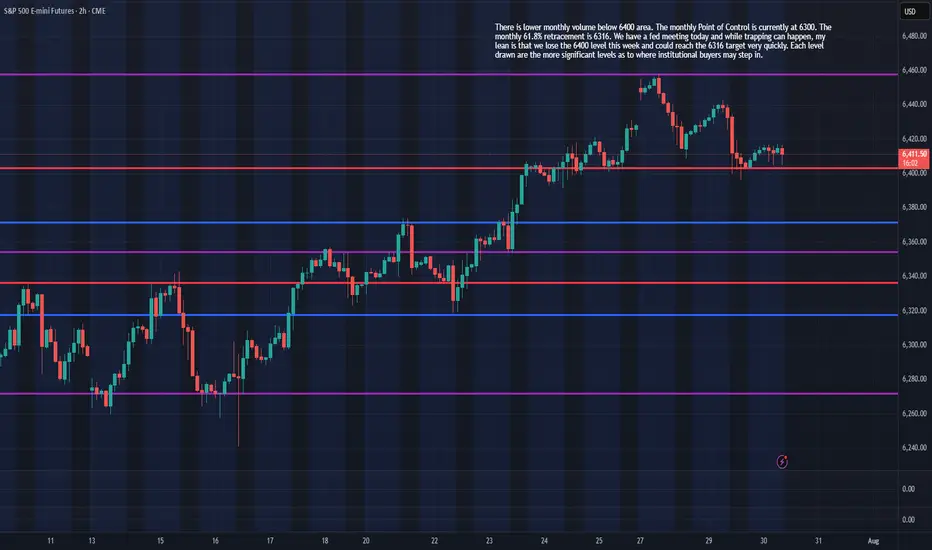
There is lower monthly volume below 6400 area. The monthly Point of Control is currently at 6300. The monthly 61.8% retracement is 6316. We have a fed meeting today and while trapping can happen, my lean is that we lose the 6400 level this week and could reach the 6316 target very quickly. Each level drawn are the more significant levels as to where institutional buyers may step in.
Stock Index Matrix: ES, NQ, YM Weekly BiasES: $6,323.25
NQ: $23,171.50
YM: $44,504
Bearish for all markets mentioned

ES Scenario 2 29-07Finally, scenario 2 was realized today, touching and perfectly respecting the levels that we had previously indicated, rising upwards to the equilibrium point and then continuing downwards. While the Nasdaq was more bullish at the beginning, it also fell quite a bit.

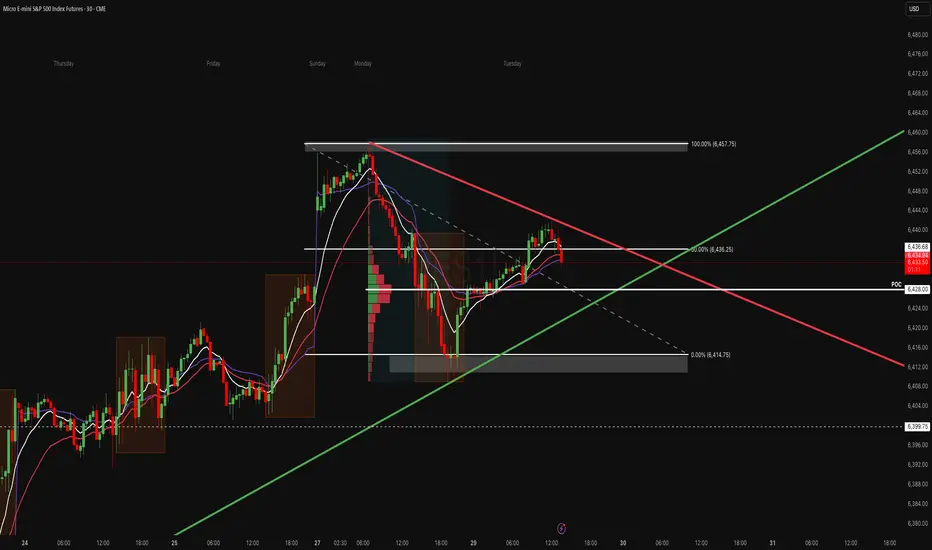
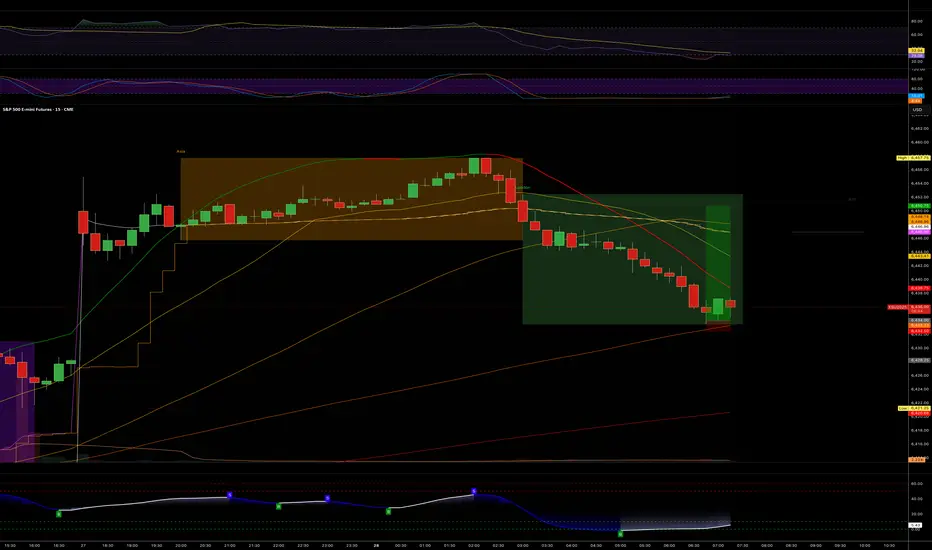
POC Pressure Cooker – MES Prepares for VolatilityWe’re heading into the NY session with MES balancing between key levels. The 50% retracement of the recent range (6436) is acting as a pivot, while the POC at 6428 is the immediate area of interest. The structure is tight here’s both sides of the play:
Key Levels to Watch:
- Upper Range: 6457–6460 (recent swing high)
- Mid-Range Pivot: 6436 (Fib 50%)
- POC & Support Zone: 6428 (volume shelf)
- Lower Range: 6415 → 6400
🟩 Bullish Scenario
A breakout and hold above 6440–6445 could lead to a retest of 6457–6460, with potential continuation to 6470+ if momentum accelerates.
- Confluence: Higher low structure above 6428, EMAs curling up, and price reacting positively to POC.
- Invalidation: Clean break and close below 6428.
🟥 Bearish Scenario
A failure to hold 6430 and a push through 6428 (POC) could see sellers target 6415, then possibly 6400.
- Confluence: Descending red trend line still capping price, and VWAP rejections could support a downside move.
- Invalidation: Break above 6457 with strong buyer aggression.
Staakd Notes:
This is a range-play environment. The real edge is in waiting for a break + retest of 6440 or 6428 to confirm direction. NY open volatility is likely to provide a fake out before the true move. Give it 30 mins from open.
Closing Line:
“Price is coiled between POC and the 50% mark. We’ll let NY open show its hand then react, not predict.”
29 july 2025Possible short on ES. NY took out the previous day's high while ES did not, thus forming an SMT. There is a 4 hour poor low from the previous week's wednesday and relative equal lows on friday.
As we are approaching the end of the month there could very well be a sell off to put in the month's wick before continuing higher next week.

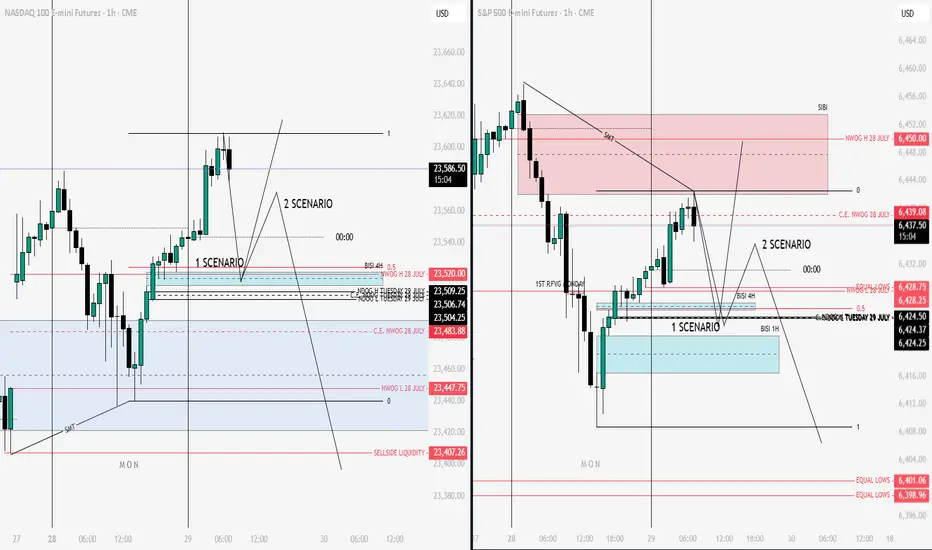
NQ & ES Key Levels 29-07-2025These are the most sensitive points today and only these two scenarios can exist. Take advantage of these key levels for short term trades, scalps or swing trades
ID: 2025 - 0095.5.2025
Trade #9 of 2025 executed.
Trade entry at 137 DTE (days to expiration).
Trade construct is a PDS (put debit spread) at Delta 15 combined with a PCS (put credit spread) at Delta 15. Overlapping short strikes give it the "unbalanced" butterfly nomenclature.
Sizing and strike selection is designed to keep the risk/reward "AT EXPIRATION" to a 1:1 risk profile. This lets charm work it's magic (second order greek), while exploiting the fact that this is a non-directional bias. The process is a disciplined and systematic approach letting time decay evaporate the extrinsic time value from the short options until target profit is achieved.
OF NOTE: This trade opened at EXCELLENT fills, and there is zero risk to the upside. The danger is of a catastrophic move to the downside, which will bring in phenomenal gains for ID 006 and 008. 😊
Happy Trading!
-kevin


Early entry on !ES New York Session?If London -> New York session will be a reversal, this may be a solid entry...
- Lower time frames showing RSI Divergence (bottoming out).
- Higher time frames look like it could be a v shape recovery.
From a macro standpoint, I am anticipating a volatile week. A lot of news - but nothing today (monday). It would not surprise me to see Monday do the inverse of what is to come later in the week. So I am not trading today, outside of what is currently in position (Long Silver, Gold, & ES).
07/25/25 Trade Journal, and ES_F Stock Market analysis
EOD accountability report: +228
Sleep: 5 hours
Overall health: Still struggling to catch up on sleep. gonna take gg sleeping pills today
** VX Algo System Signals from (9:30am to 2pm) **
— 9:07 AMMarket Structure flipped bearish on VX Algo X3! :white_check_mark:
— 9:53 AM Market Structure flipped bullish on VX Algo X3! :white_check_mark:
— 10:30 AM Market Structure flipped bullish on VX Algo X3! :white_check_mark:
— 11:00 AM VXAlgo ES X1 Sell Signal :x:
**What’s are some news or takeaway from today? and What major news or event impacted the market today? **
Market structure algo was flipping a lot today, even in premarket, which tells me that MM was changing position a lot and things could be unreliable so i decided to end the trading day early at $200 and closed up shop on my main acccount.
**News**
*S&P 500 ENDS AT A NEW RECORD HIGH
**What are the critical support levels to watch?**
--> Above 6395= Bullish, Under 6372= Bearish
Video Recaps -->https://www.tradingview.com/u/WallSt007/#published-charts

Long MES I see CME_MINI:ESU2025 is on a uptrend with a BOS( break of structure) at $6421, there is a trend line marked in blue that has been tested several times.
There is a support in confluence with POC area from a previous session. Above VWAP → Favorable for short positions (or considered expensive for long positions).
Below VWAP → Favorable for long positions (or considered expensive for sellers).
Personally, I build my position in zones — especially around key levels like order blocks, imbalance fills, or liquidity sweeps (Smart Money Concepts). I prefer scaling in when entering trades to catch better prices.
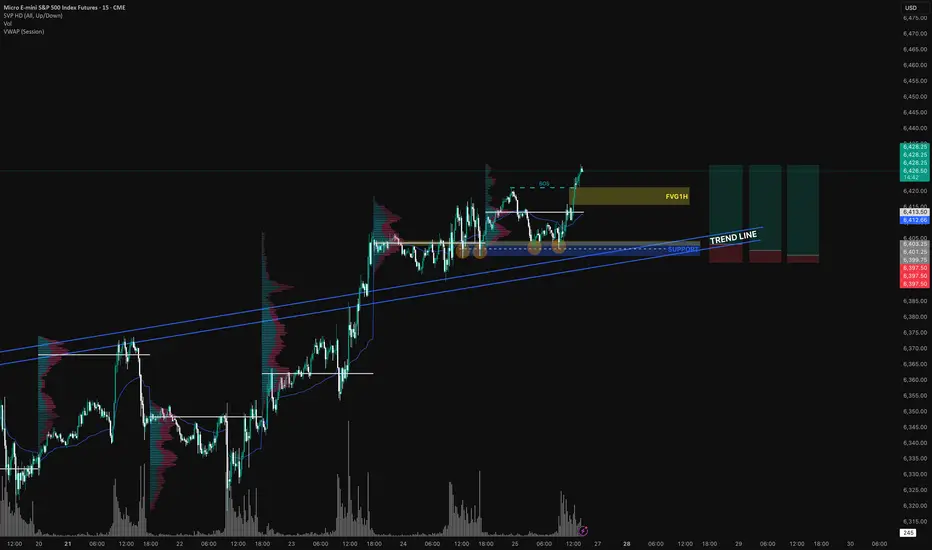

Long MESentry 6338
stop loss 6351
TP 6404.50
1. currently in a uptrend
2. FVG at 6368
3. above 200ema
Before I enter my trade at Id like to look for some market structure to form.
if it breaks below 6353.5 and makes a ChoCh im no longer bullish
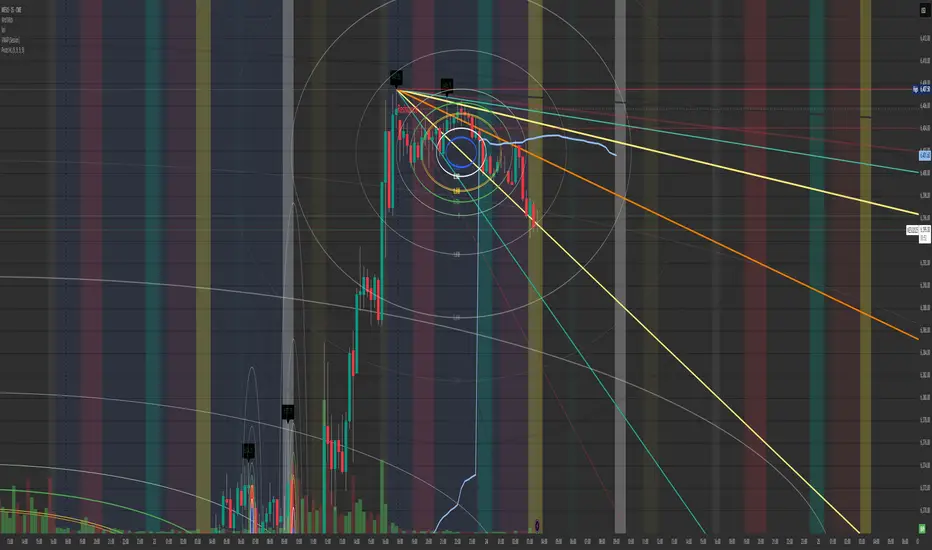
$ES and $NQ look to be dropping like a hot rock after the close.Looking at the Fib Circles and the previous day high along with the Gann. Well I know this is the micro ES but they run at the same % of p/l. If you notice how the high during yesterdays session and the low. Notice the Blue circle in the center?
Any and every time I can draw out the circle from high to low daily levels from past to current. (as you have seen in my previous examples.) Either the trend completely hits the limit of the blue circle. Than reverts to the buyers stepping up or sellers dropping down below the blue circle. Its like a plague to the momentum of the market and can change it in any direction.
I have noticed this as well. If the bid/ask price is within it during the time of the candle. It jumps or completely runs down through it meaning that I believe its a good place to either buy in any uptrend or sell in a Monthly/weekly/daily/hourly analytic.
That's what the Gann Fibonacci level tool is useful for in my eyes. If the trend keeps going down below any level I find that there's probably about a 10%-20% chance it will keep going down.
For me the Gann Is better than any trendline because it shows the fib along with the trend.
Not investment advice just a perspective I have had working with it since someone showed the wrong way. Than I remembered Highs first down to Lows of the tf, being it 15 min/hourly/daily/Weekly/Monthly.
Just a thought
Anyone have any opinions?
If so give me a ring and follow so I can get chart ideas that will great fully improve my futures trades.
Have a profitable day and be safe all.
Paul.
ID: 2025 - 0115.20.2025
Trade #11 of 2025 executed.
Trade entry at 150 DTE (days to expiration).
Excellent fills this morning, well under mid.
Target profit is 5% ROI
Happy Trading!
-kevin

Buyers show convictionClose near the high of the Wednesday daily chart in the S&P 500 implies that buyers are showing conviction and willing to hold positions into the close. If these buyers are present the next price objective to close above would be 6415.

Bearish MovementIm expecting price to return to NY open (8AM (EST) Candle) and react there to return to the downside since it broke NY open structure. We are at the ATH at the moment which created a double top.
Lets see how this goes…

Expect Correction august/septemberMarkets MUST correct, everything is overbought and sentiment is Extreme greed. RSI points to extreme overbought territory, VIX very low and not going any lower (reached bottom).
Usually august/september the market corrects. so i expect a correction around 5-8%.
Be prepared, dont chase FOMO. Be careful.
SP:SPX TVC:SPX CBOE:SPX CBOE:XSP AMEX:SPY

Sideways to higherThe structure in the daily chart of the S&P 500 implies that Wednesday would trade inside of Tuesday's range and with a positive close possibly above Tuesday's high.

07/22/25 Trade Journal, and ES_F Stock Market analysis
EOD accountability report: +
Sleep: 6 hours
Overall health: Good
** VX Algo System Signals from (9:30am to 2pm) **
— 9:40 AM Market Structure flipped bearish on VX Algo X3!
— 10:20 AM VXAlgo ES X1 Buy signal
— 11:30 AM VXAlgo NQ X1DD Sell Signal
— 2:00 PM Market Structure flipped bullish on VX Algo X3!
**What’s are some news or takeaway from today? and What major news or event impacted the market today? **
Very clean trading day for me, signals worked out really well and everything played out accordingly
**News**
S&P 500 CLOSES AT A NEW ALL-TIME HIGH ABOVE 6,000
**What are the critical support levels to watch?**
--> Above 6339= Bullish, Under 6320= Bearish
Video Recaps -->https://www.tradingview.com/u/WallSt007/#published-charts

Wait and seeAlthough the S&P 500 daily chart for Monday implies sellers coming into the market, the past behavior over the last few days has been a lack of follow-through to the downside. The market seems to be structuring itself to a wait and see approach. This means the markets waiting for additional information to respond directionally and it could be earnings that could stimulate this market.

How to Trade Doji Candles on TradingViewLearn to identify and trade doji candlestick patterns using TradingView's charting tools in this comprehensive tutorial from Optimus Futures. Doji candles are among the most significant candlestick formations because they signal market indecision and can help you spot potential trend reversal opportunities.
What You'll Learn:
• Understanding doji candlestick patterns and their significance in market analysis
• How to identify valid doji formations
• The psychology behind doji candles: when buyers and sellers fight to a draw
• Using volume analysis to confirm doji pattern validity
• Finding meaningful doji patterns at trend highs and lows for reversal setups
• Timeframe considerations for doji analysis on any chart period
• Step-by-step trading strategy for doji reversal setups
• How to set stop losses and profit targets
• Real example using E-Mini S&P 500 futures on 60-minute charts
This tutorial may help futures traders and technical analysts who want to use candlestick patterns to identify potential trend reversals. The strategies covered could assist you in creating straightforward reversal setups when market indecision appears at key price levels.
Learn more about futures trading with Tradingview: optimusfutures.com
Disclaimer:
There is a substantial risk of loss in futures trading. Past performance is not indicative of future results. Please trade only with risk capital. We are not responsible for any third-party links, comments, or content shared on TradingView. Any opinions, links, or messages posted by users on TradingView do not represent our views or recommendations. Please exercise your own judgment and due diligence when engaging with any external content or user commentary.
This video represents the opinion of Optimus Futures and is intended for educational purposes only. Chart interpretations are presented solely to illustrate objective technical concepts and should not be viewed as predictive of future market behavior. In our opinion, charts are analytical tools—not forecasting instruments. Market conditions are constantly evolving, and all trading decisions should be made independently, with careful consideration of individual risk tolerance and financial objectives.
