All Relevant ES Levels Near Current Price (June Contracts)If you want to copy and paste these levels on your chart for the new June contracts:
- Scroll to the bottom outside of this chart publication and look for three dots (…).
- Click on those dots and select the option that says “Make it Mine” or “Grab this Chart”.
This will instantly apply my whole chart setup to your own TradingView account. Of course all you need is the levels, so you can adjust the colors or whatever else to your liking if need be.
MES1! trade ideas
ES/SPY PathLatest outlook analysis. Possible paths. (two main ones in my view) See how it has exited the channel? This could be good to free itself and produce upward movement out of the W pattern. Or of course it could paint a larger W even with a big exhaustion push down stopping out all the bottom pickers and scooping up all their shares before ripping higher. Of course there are those that speculate we are now transitioning into a bear market. Could they be right? Sure. could they be wrong? Yes. Could we be suck here for a while? Sure. I hope not!
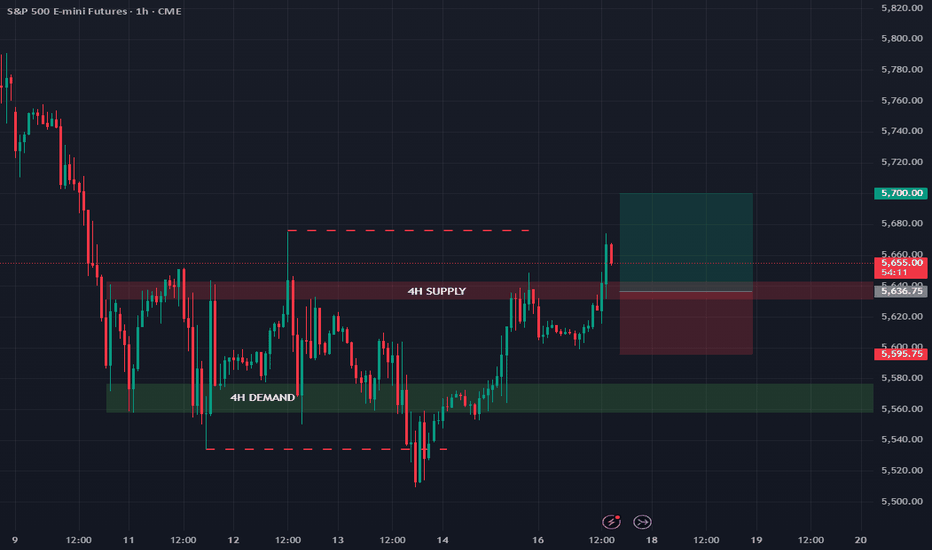
ES futures update 18/03/'25In today's market update, I maintain a neutral stance. While we saw a breakout yesterday, price has since been rejected at the 1-hour resistance. The key area I'm watching is the 4-hour demand zone.
Since the overall trend on higher timeframes remains bearish, I plan to wait until price reaches this level—I'm cautious about entering long positions. If price clearly rejects bullishly from the 4-hour demand zone, I will go long.
However, if the 4-hour demand zone breaks down, I'll look for a short position on a retest of this zone.
18 March 2025S&P edged lower on Tuesday as investors awaited the Federal Reserve's upcoming meeting, which will be closely watched for insights on the potential economic impact of ongoing tariff disputes.
The central bank's two-day policy meeting begins later in the day and will conclude on Wednesday, with markets widely expecting it to keep interest rates unchanged. I believe that Trump may push the Federal Reserve to cut rates.
ES Morning Update March 18thYesterday, the plan for ES was straightforward: rally to ~5755 (adjusted for the June contract, previously 5703 on March) to back-test the 3-month megaphone breakdown from last Monday. The market followed through with an 88-point rally to that level before selling off.
As of now:
• 5720 (reclaimed) and 5698 are key supports
• Holding above keeps 5739 and a second test of 5754 in play
• If 5698 fails, look for selling pressure toward 5668
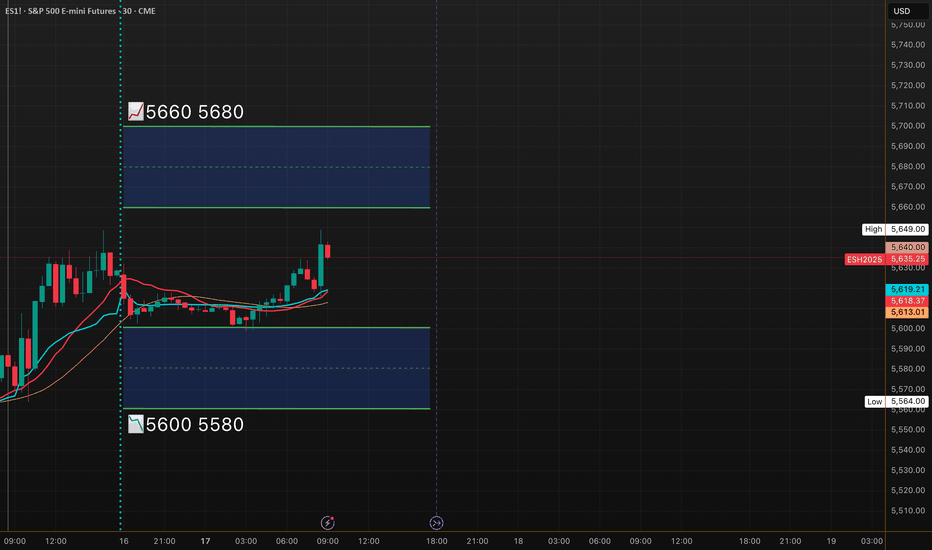
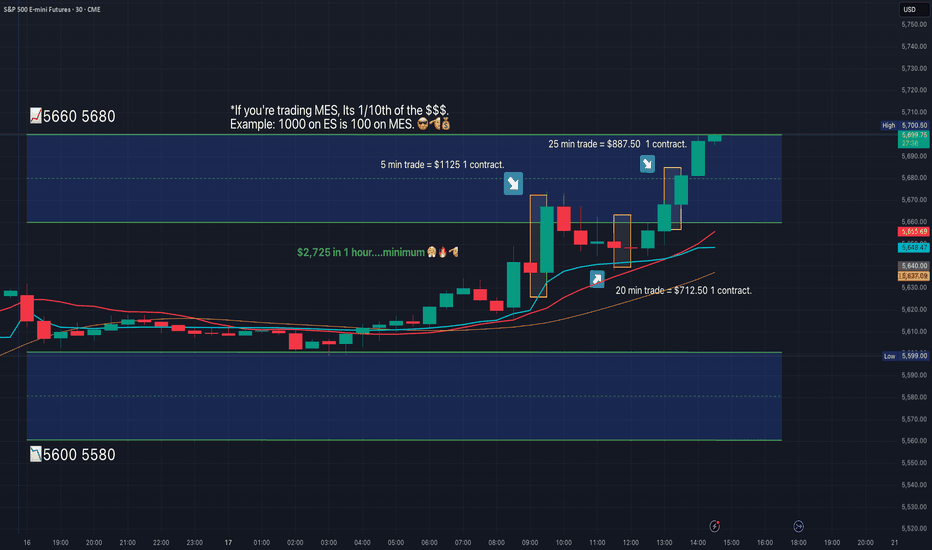
MES!/ES1! Day Trade Plan for 03/17/2025MES!/ES1! Day Trade Plan for 03/17/2025
📈5660. 5680
📉5600. 5580
Like and share for more daily ES levels 🤓📈📉🎯💰
*These levels are derived from comprehensive backtesting and research and a quantitative system demonstrating high accuracy. This statistical foundation suggests that price movements are likely to exceed initial estimates.*
ES futures update 17/03/'25Last week, I mapped out some trading zones that are still valid and unchanged.
The 4H supply zone has broken out, so I will be looking for a long position after a retest of this broken supply zone, which should now act as support.
My last trade was a short from this zone, resulting in a small profit since market closing prevented reaching the full take-profit target.
Let's see if the bullish momentum can hold during the retest entry.
As always, follow for more market updates.
OTEUM EXPERT CALL: SP500 Intraweek Pre-FED Bounce?Here comes the pre-FED volatility—price is dipping into that “value area” and OTEUM is looking to ride it higher 🤜💥. But watch out: Trump is back on tweet mode 🦅, which could rattle the market at any moment. Go small, manage your risk like a pro, and let’s see if we can ride this bounce 🚀!
#SP500 #ExpertCall #PreFED #Volatility #TrumpTweets
Gamma Exposure on SPXToday marks the first day in a long time where we can observe some green, bullish levels on gamma exposure. The daily GexView indicator displays thin green lines, which represent the gamma exposure of zero-days-to-expire contracts. The thick lines, on the other hand, represent the total gamma exposure across all expiration contracts. This is a promising first step, especially if these lines persist over the next few days and continue to develop further.
ES Futures Market Outlook & Key LevelsCME_MINI:ES1!
As we discussed in last week’s TradingView blog, the ES futures are currently undergoing a 10% correction. You can access the full context through the link here.
Rollover Notice:
Today marks the rollover of ES futures to the June 2025 contract. The rollover adjustment using Friday’s settlement prices for ESH2025 and ESM2025 is +52.25. To map out the new levels for ESM2025, simply add +52.25 to the levels on ESH2025.
Note: TradingView will roll over the continuous ES1! chart on Tuesday, March 18, 2025.
Key Events This Week: This week, all eyes will be on the FOMC rate decision , FOMC press conference , and the Summary of Economic Projections (SEP ), which includes the Fed’s dot plot, inflation expectations, and growth forecasts for the next two years. This release will set the tone for market movements, at least until the clarity of the looming reciprocal tariffs deadline on April 2, 2025.
Key Levels to Watch:
• Bullish LIS / Yearly Open 2025: 5,949.25
• Key Level to Reclaim: 5,795 - 5,805
• Resistance Zone: 5,704.50 - 5,719.75
• Bearish LIS / Mid Range 2024: 5,574.50
• 2024-YTD mCVAL: 5,449.25
• 2022 CVAH: 5,280.25
Market Scenarios:
Scenario 1: Fed Support ("Fed Put")
The Fed is widely expected to hold rates steady this week. However, markets are forward-looking, so the key focus will be on the updated SEP forecast and the Fed’s press conference. A dovish stance and flexibility to support the US economy, including rate cut expectations moving to the May/June meetings, will drive sentiment. This would imply markets pricing in more rate cuts throughout 2025. The CME Fedwatch tool is a useful resource for tracking Fed fund probabilities and comparing these with the dot plot projections.
Scenario 2: Trade War 2.0
If the Fed remains in a "wait and see" mode, maintaining a restrictive stance while uncertainties surrounding Trade War 2.0 persist, markets may face heightened volatility. The combination of a restrictive Fed policy and geopolitical tensions could act as a double whammy for markets.
ES Morning Update March 17thOn Thursday, ES reclaimed 5558, triggering a long setup that led to a rare green day. The 5645 target was hit on Friday after a strong trend day. With that momentum, today is likely to be more complex—hold runners.
As of now:
• 5599, 5615 are key supports
• Tests of 5599 and recoveries of 5615 are actionable setups
• Holding above keeps 5644, 5666+ in play
• If 5599 fails, expect selling pressure to increase
ES, Mar 17, 2025 CME_MINI:ES1! swept September’s low, clearing major sell-side liquidity before starting to reverse. I’m anticipating a push through the 4H FVG, inverting it, and then a retracement into it early this week (March 17th/18th). If price holds above, we could see continuation higher, but failure to hold the FVG as support may lead to another leg lower.
The Weekly FVG remains a key resistance — multiple taps could weaken it for a potential breakout later in March.
ES1! Intraday levels for 16-17 March Oh no!
Here are the levels for ES1! tonight/tomorrow.
Sorry for the poor graphics, it seems Tradingview has uh, prevented publishing ideas with "private" indicators overlaid.
Unfortunately my levels are exported from secondary software for overlay on Tradingview via pinescript so it really makes sharing ideas much more difficult.
I understand the reason but for the rare person like me who uses Pine just for plotting functions its a real hassle, so I beg you Tradingview to reconsider! haha
Okay, anyway now that that is out of the way, I am very neutral for the session tonight/tomorrow.
I expect moves in both directions, and keep in mind we have FOMC on Wednesday.
The probability metrics favour the downside targets but don't think its unreasonable to expect both upside and downside targets.
Looking for it to snag either resistance of support first before taking a position this evening.
Good luck everyone! Safe trades!!! 🚀
S&P 500 (March Contract) - Stock Market Loses $5 Trillion!The S&P 500′s rapid 10% decline from a record high into correction territory has wiped out trillions of dollars in market value.
The market value of the S&P 500 at its Feb. 19 peak was $52.06 trillion, according to FactSet. Thursday’s decline put the index’s market value down to $46.78 trillion.
That makes for a total loss of about $5.28 trillion in about three weeks.
Will the rate announcements cause S&P 500 to sink lower into the abyss??
Reference: www.cnbc.com
Weekly Market Analysis - 16th March 2025 (DXY, NZD, ES, BTC)This is weekly market analysis of a few pairs (DXY, NZD, ES, BTC).
I haven't done one of these in a while, but here it is!
I would have done more pairs but the video was already 30 minutes long and I went into more teaching rather than pure analysis.
I hope you found it insightful to your own trading, because what I teach is the truth of the market regardless of whatever specific strategy you use for trading.
Anything can make money in the markets, but of course, risk management and discipline rule all.
- R2F Trading
Why DCA Does Not Work For Short-Term TradersIn this video I go through why DCA (Dollar Cost Averaging) does not work for short-term traders and is more suitable for investors. I go through the pitfalls than come through such techniques, as well as explain how trading should really be approached. Which at it's cost should be based on having a positive edge and using the power of compounding to grow your wealth.
I hope this video was insightful, and gives hope to those trying to make it as a trader. Believe me, it's possible.
- R2F Trading
SPY shortsThe chart displays the S&P 500 E-mini Futures (4-hour timeframe) with technical analysis indicators. Key features include:
Current Price: 5,628.25 (SELL) and 5,629.25 (BUY).
Recent Movement: The price recently bounced from a low and is projected to reach 5,676.00 by March 17, 2025, before potentially dropping to 5,392.50 by March 24, 2025, reflecting a decline of -283.50 points (-4.99%) in 7 days.
Fibonacci Levels:
0.5 retracement levels at 5,836.25 and 5,641.75.
Extension levels indicate potential further declines below 5,352.00 and 5,253.75.
Pivot Points: Marked at multiple levels (e.g., 5,935.50 and 6,166.50) for resistance and support.
Volume: 410.25K with a daily gain of +112.50 points (+2.04%).
Projection: The blue arrow suggests a bearish outlook after a short-term rise, with a significant price drop expected.
This chart is likely part of a trading strategy based on Fibonacci retracements, pivots, and projected price movements.


