MES1! trade ideas

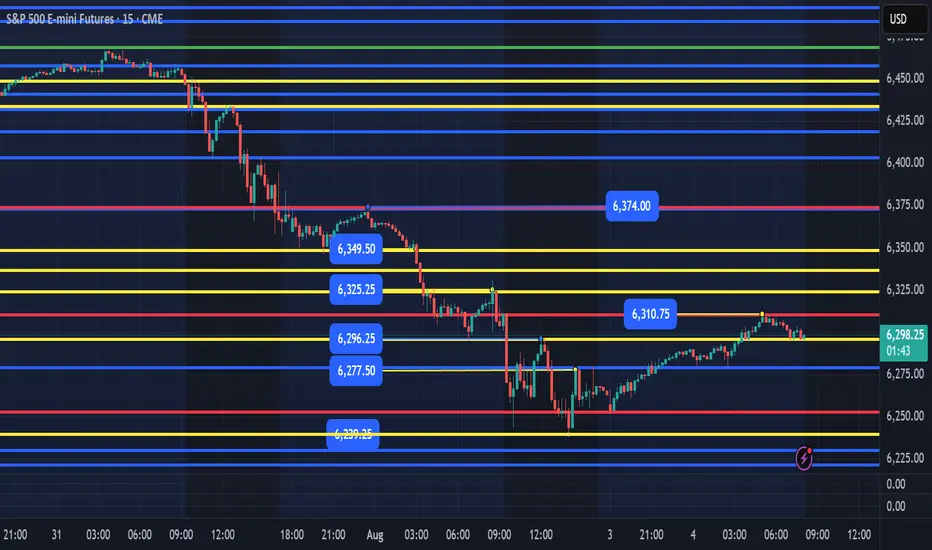
ES - Daily Session Trade Plan - Update August 4th, 2025 8am EST update -
Overnight price found a low at 6252 reached 6310 as the high. 6296, 6277, 6252 are the 3 main supports below. A flush and level reclaim of any of these supports should see price continue higher with targets of 6325, 6350, 6375.
IF price loses 6252 or Fridays low at 6240, these would be the higher quality levels we would want price to flush and reclaim for a move higher.
6297 support holds and we break the overnight high at 6310, the back test of this breakout would be worth a level to level move up to 6325.
The main levels I am watching is 6252 or 6240 to be tested, flushed and reclaimed. It would be best to wait for the 9:30am open and see how price reacts. I could see price flush in the first 30 mins, then catch bears offside and reclaim the Fridays lows. That would be a great short squeeze area to ride a couple of levels of back testing the overnight price.
Below Fridays lows and I will be waiting for price to build structure at the supports of 6225, 6210, 6194, 6175. If ES is selling hard into these areas, I would wait to enter any longs until I see structure build and reclaim the levels I have outlined. Let price come to you and be patient.
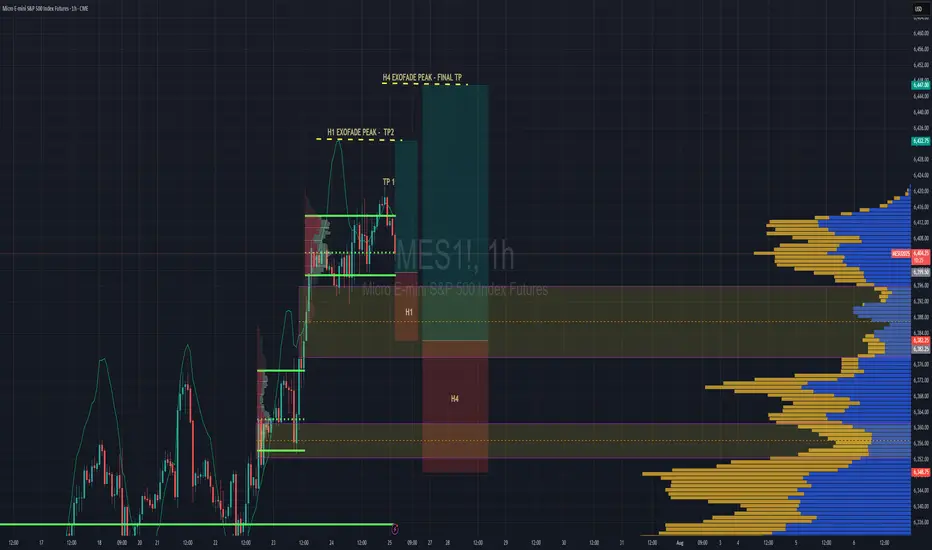
S&P 500 Intraday & Swing Entries H1 entry is close to getting activated for intraday.
If you want a swing trade then wait for H4 entry (you might be waiting a while obviously)
Reason for entries - We have broken out of Balance since July 25th and currently in a trend phase until we establish a new value area, or return to the one we broke out from.
So since Trend and Momentum is UP, then we should find Low Volume Areas to enter in the direction of the trend for a classic pullback entry trade.
07/30/25 Trade Journal, and ES_F Stock Market analysis EOD accountability report: +960
Sleep: 5 hours
Overall health: still struggling with sleep due to heat waves
VX Algo System Signals from (9:30am to 2pm)
— 8:30 AM Market Structure flipped bearish on VX Algo X3!✅
— 9:45 AM Market Structure flipped bullish on VX Algo X3! ✅
— 10:30 AM Market Structure flipped bullish on VX Algo X3!❌
— 11:30 AM Market Structure flipped bearish on VX Algo X3!❌
— 12:00 PM VXAlgo NQ X1DD Buy Signal, ✅
— 12:30 PM Market Structure flipped bullish on VX Algo X3!✅
What’s are some news or takeaway from today? and What major news or event impacted the market today?
I have started to noticed that the last 3 days, we have been getting false triggers on market structure signals and it almost feels MM are trying to do it to break people's algo that trade on that.
This is a good reminder that no matter how successful the signal has been for the last 30 days, you still need to have risk management. additionally, it's also a good way to test people's faith and trick new traders in going back to doing random things because it makes them think market can behave randomly and nothing works.
this is why i always tell people to religiously test out a system for 30 days before giving up.
News
*FEDERAL RESERVE SKIPS RATE CUT, KEEPS FED FUNDS RATE AT 4.50%
What are the critical support levels to watch?
--> Above 6410= Bullish, Under 6400= Bearish

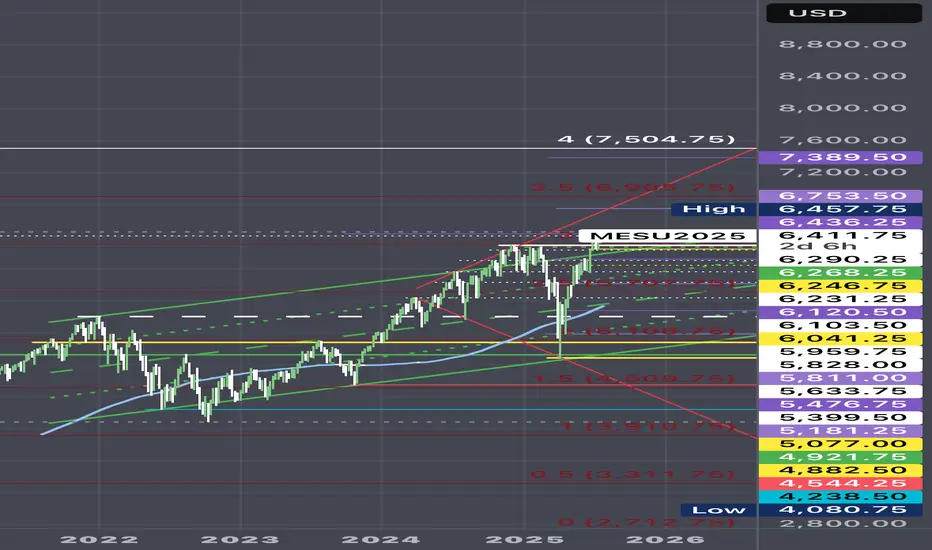
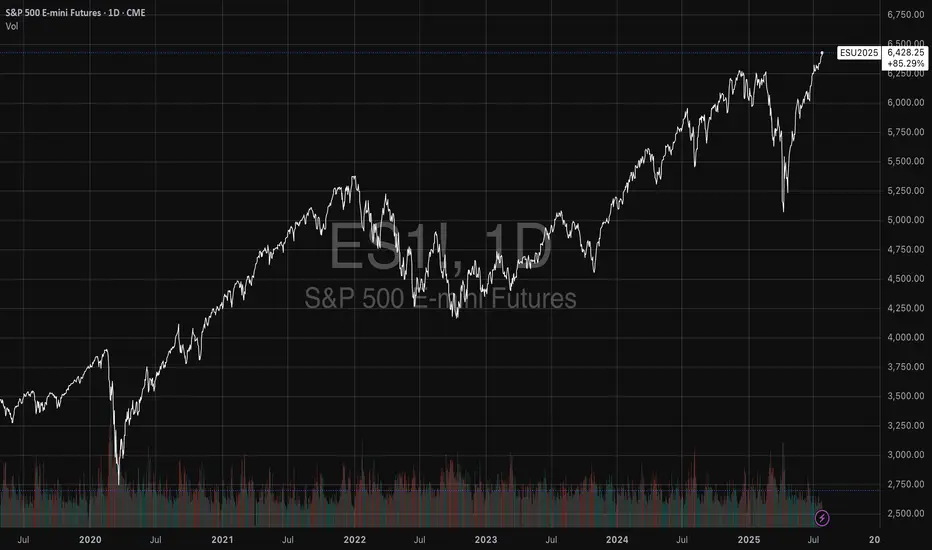
/ES held its main channel!ES held its main channel in the early 2025 dip. Now currently inside the red megaphone with a breakout target of 7500.
Tech Earnings & Fed Meeting - July 30th - ES 100pt drop?I trade ES Futures and have identified an important support shelf that if broken could accelerate lower.
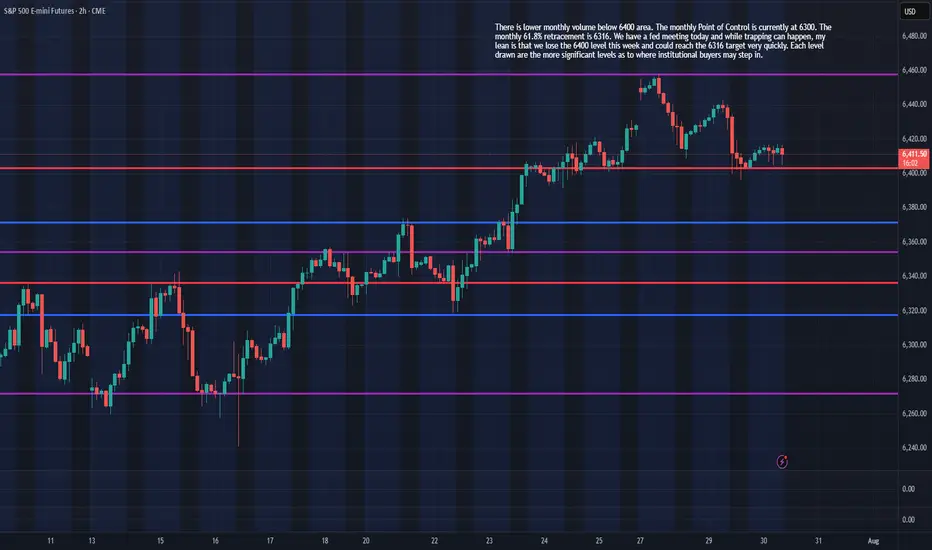
There is lower monthly volume below 6400 area. The monthly Point of Control is currently at 6300. The monthly 61.8% retracement is 6316. We have a fed meeting today and while trapping can happen, my lean is that we lose the 6400 level this week and could reach the 6316 target very quickly. Each level drawn are the more significant levels as to where institutional buyers may step in.
Stock Index Matrix: ES, NQ, YM Weekly BiasES: $6,323.25
NQ: $23,171.50
YM: $44,504
Bearish for all markets mentioned

ES Scenario 2 29-07Finally, scenario 2 was realized today, touching and perfectly respecting the levels that we had previously indicated, rising upwards to the equilibrium point and then continuing downwards. While the Nasdaq was more bullish at the beginning, it also fell quite a bit.

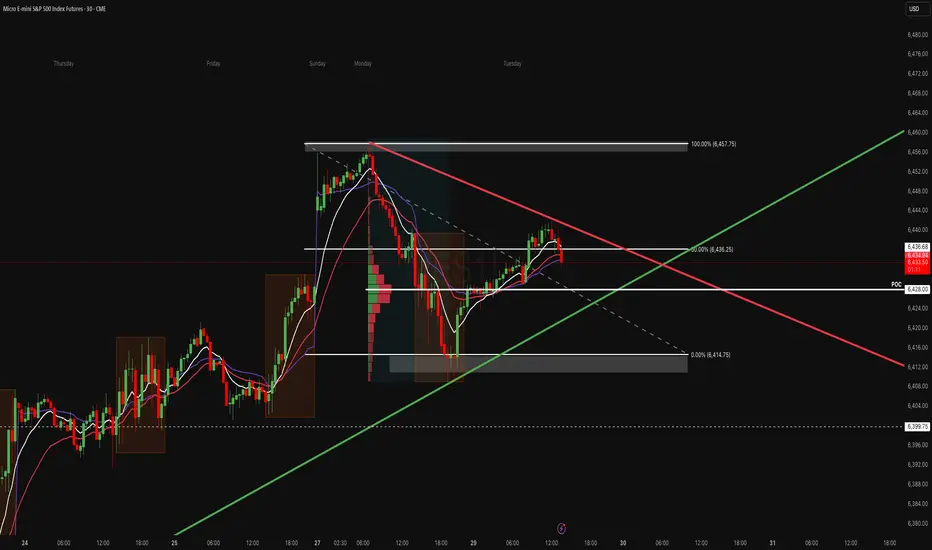
POC Pressure Cooker – MES Prepares for VolatilityWe’re heading into the NY session with MES balancing between key levels. The 50% retracement of the recent range (6436) is acting as a pivot, while the POC at 6428 is the immediate area of interest. The structure is tight here’s both sides of the play:
Key Levels to Watch:
- Upper Range: 6457–6460 (recent swing high)
- Mid-Range Pivot: 6436 (Fib 50%)
- POC & Support Zone: 6428 (volume shelf)
- Lower Range: 6415 → 6400
🟩 Bullish Scenario
A breakout and hold above 6440–6445 could lead to a retest of 6457–6460, with potential continuation to 6470+ if momentum accelerates.
- Confluence: Higher low structure above 6428, EMAs curling up, and price reacting positively to POC.
- Invalidation: Clean break and close below 6428.
🟥 Bearish Scenario
A failure to hold 6430 and a push through 6428 (POC) could see sellers target 6415, then possibly 6400.
- Confluence: Descending red trend line still capping price, and VWAP rejections could support a downside move.
- Invalidation: Break above 6457 with strong buyer aggression.
Staakd Notes:
This is a range-play environment. The real edge is in waiting for a break + retest of 6440 or 6428 to confirm direction. NY open volatility is likely to provide a fake out before the true move. Give it 30 mins from open.
Closing Line:
“Price is coiled between POC and the 50% mark. We’ll let NY open show its hand then react, not predict.”
29 july 2025Possible short on ES. NY took out the previous day's high while ES did not, thus forming an SMT. There is a 4 hour poor low from the previous week's wednesday and relative equal lows on friday.
As we are approaching the end of the month there could very well be a sell off to put in the month's wick before continuing higher next week.

NQ & ES Key Levels 29-07-2025These are the most sensitive points today and only these two scenarios can exist. Take advantage of these key levels for short term trades, scalps or swing trades
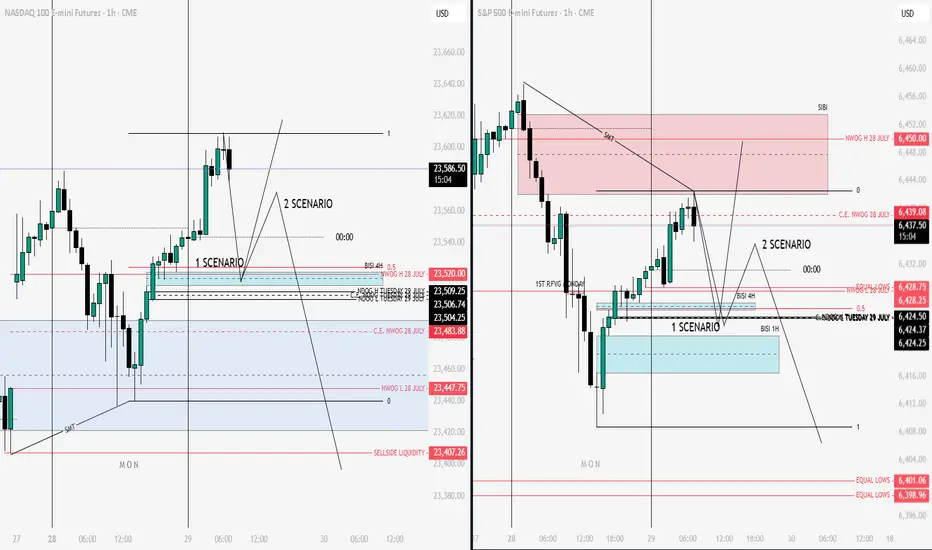
ID: 2025 - 0095.5.2025
Trade #9 of 2025 executed.
Trade entry at 137 DTE (days to expiration).
Trade construct is a PDS (put debit spread) at Delta 15 combined with a PCS (put credit spread) at Delta 15. Overlapping short strikes give it the "unbalanced" butterfly nomenclature.
Sizing and strike selection is designed to keep the risk/reward "AT EXPIRATION" to a 1:1 risk profile. This lets charm work it's magic (second order greek), while exploiting the fact that this is a non-directional bias. The process is a disciplined and systematic approach letting time decay evaporate the extrinsic time value from the short options until target profit is achieved.
OF NOTE: This trade opened at EXCELLENT fills, and there is zero risk to the upside. The danger is of a catastrophic move to the downside, which will bring in phenomenal gains for ID 006 and 008. 😊
Happy Trading!
-kevin


Early entry on !ES New York Session?If London -> New York session will be a reversal, this may be a solid entry...
- Lower time frames showing RSI Divergence (bottoming out).
- Higher time frames look like it could be a v shape recovery.
From a macro standpoint, I am anticipating a volatile week. A lot of news - but nothing today (monday). It would not surprise me to see Monday do the inverse of what is to come later in the week. So I am not trading today, outside of what is currently in position (Long Silver, Gold, & ES).
07/25/25 Trade Journal, and ES_F Stock Market analysis
EOD accountability report: +228
Sleep: 5 hours
Overall health: Still struggling to catch up on sleep. gonna take gg sleeping pills today
** VX Algo System Signals from (9:30am to 2pm) **
— 9:07 AMMarket Structure flipped bearish on VX Algo X3! :white_check_mark:
— 9:53 AM Market Structure flipped bullish on VX Algo X3! :white_check_mark:
— 10:30 AM Market Structure flipped bullish on VX Algo X3! :white_check_mark:
— 11:00 AM VXAlgo ES X1 Sell Signal :x:
**What’s are some news or takeaway from today? and What major news or event impacted the market today? **
Market structure algo was flipping a lot today, even in premarket, which tells me that MM was changing position a lot and things could be unreliable so i decided to end the trading day early at $200 and closed up shop on my main acccount.
**News**
*S&P 500 ENDS AT A NEW RECORD HIGH
**What are the critical support levels to watch?**
--> Above 6395= Bullish, Under 6372= Bearish
Video Recaps -->https://www.tradingview.com/u/WallSt007/#published-charts

Stop-Loss Strategies in Retail TradingA Comprehensive Scientific Analysis of Risk Management Effectiveness
This essay provides a comprehensive analysis of stop-loss strategies in retail trading environments, synthesizing empirical evidence from behavioral finance and quantitative risk management literature. Through examination of over 30 peer-reviewed studies spanning 1980-2024, the analysis identifies optimal stop-loss implementation frameworks that demonstrate statistically significant improvements in risk-adjusted returns. The findings reveal that volatility-adaptive stop-loss mechanisms can reduce maximum drawdowns by 45-65% while maintaining or improving Sharpe ratios, contrasting sharply with naive fixed-percentage approaches that often destroy value through premature exits and behavioral biases.
1. Introduction
Stop-loss orders represent one of the most fundamental risk management tools in financial markets, yet their optimal implementation remains contentious in both academic literature and practical application. While theoretical frameworks suggest that stop-loss mechanisms should improve risk-adjusted returns through downside protection (Kaminski & Lo, 2014), empirical evidence reveals substantial heterogeneity in outcomes depending on implementation methodology, market conditions, and trader behavior (Fong & Yong, 2005).
The proliferation of retail trading platforms has democratized access to sophisticated order types, yet paradoxically, retail traders continue to exhibit systematic biases in stop-loss application that frequently destroy rather than create value (Barber & Odean, 2013). This phenomenon, termed the "stop-loss paradox" by behavioral finance researchers, highlights the critical gap between theoretical optimization and practical implementation (Kaustia, 2010).
This analysis synthesizes findings from behavioral finance and quantitative risk management to establish evidence-based frameworks for stop-loss strategy design, focusing on methodologies implementable in modern trading platforms including Pine Script environments.
2. Empirical Evidence on Stop-Loss Effectiveness
2.1 Momentum Strategy Enhancement
The most compelling empirical evidence for stop-loss effectiveness emerges from momentum strategy research. Han, Zhou & Zhu (2014) conduct a comprehensive analysis of U.S. equity markets from 1926-2011, demonstrating that stop-loss enhanced momentum strategies exhibit:
- 67% reduction in maximum drawdown (from -65% to -23% for value-weighted portfolios)
- 94% improvement in Sharpe ratio (from 0.32 to 0.62)
- 45% increase in average annual returns
- Statistical significance at the 1% level across all performance metrics
These results remain robust across different formation and holding periods, market capitalizations, and economic conditions. Crucially, the authors demonstrate that the performance enhancement represents genuine alpha generation through improved tail risk management.
2.2 Cross-Asset Class Performance
Levine & Pedersen (2016) extend this analysis across multiple asset classes, examining stop-loss effectiveness in equity indices, commodities, and currencies over the period 1990-2015. Their findings reveal:
- Equity markets: 15-25% improvement in Sharpe ratios with 10-15% stop-loss rules
- Commodity futures: 35-50% improvement, particularly pronounced in energy markets
- Currency pairs: Mixed results, with effectiveness varying by volatility regime
Clare et al. (2013) investigate stop-loss performance across different market regimes, finding:
- Bull markets: Stop-loss rules typically underperform due to frequent false signals
- Bear markets: Substantial outperformance, with 30-40% reduction in drawdowns
- Transition periods: Most critical for stop-loss effectiveness
3. Behavioral Finance Considerations
3.1 Common Retail Trader Errors
Extensive research documents systematic biases in stop-loss implementation among retail traders:
Disposition Effect and Loss Aversion
Kaustia (2010) analyzes Finnish investor data (1995-2002), documenting that retail investors exhibit systematic stop-loss aversion, with only 23% of losing positions closed via stop-loss orders compared to 67% of winning positions closed via profit-taking orders. This asymmetry, rooted in the disposition effect (Shefrin & Statman, 1985), leads to suboptimal risk management.
Anchoring Bias in Threshold Selection
Merkle (2017) documents that retail traders systematically anchor to:
- Round numbers (5%, 10%, 15%, 20%): 68% of stop-loss orders
- Purchase prices: 34% weight in threshold determination
- Arbitrary "rules of thumb": 23% of implementations
This anchoring leads to suboptimal threshold selection in 71% of cases, with performance improvements of 14-18% achieved through objective calibration methods.
Overconfidence and Stop-Loss Avoidance
Barber & Odean (2001) demonstrate that overconfident traders systematically avoid stop-loss mechanisms. Analysis of 78,000 retail accounts reveals that high-turnover traders use stop-losses in only 12% of positions, experiencing 31% higher volatility and 23% lower risk-adjusted returns.
4. Practical Stop-Loss Implementation Strategies
4.1 Volatility-Based Stop-Loss Methods
Average True Range (ATR) Framework
Wilder (1978) introduces the Average True Range as a volatility measure, subsequently adapted for stop-loss applications. The ATR-based stop-loss distance is calculated as:
Stop Distance = k × ATR_n
where k represents the volatility multiplier (typically 2-3) and ATR_n is the n-period Average True Range.
Kestner (2003) provides extensive backtesting evidence demonstrating that ATR-based stops outperform fixed-percentage approaches across 15 futures markets over 20 years, with:
- 28% improvement in Sharpe ratio
- 19% reduction in maximum drawdown
- Strong correlation between optimal k-values and market volatility regimes
Trailing Stop Mechanisms
Lei & Li (2009) analyze trailing stop-loss strategies, finding they consistently reduce drawdown and volatility compared to buy-and-hold. Once a trade moves favorably, trailing stops (such as chandelier exits using ATR) lock in gains while allowing upside continuation.
4.2 Simple Adaptive Methods
Volatility Regime Adaptation
Rather than complex mathematical models, simple volatility regime identification can improve stop-loss effectiveness:
- Low volatility periods: Tighter stops (1.5-2.0 × ATR)
- High volatility periods: Wider stops (2.5-3.5 × ATR)
- Transition identification using rolling ATR percentiles
This approach, supported by Clare et al. (2013), provides practical regime awareness without complex modeling requirements.
4.3 Position Sizing Integration
Optimal stop-loss implementation must integrate with position sizing rules (Van Tharp, 2006):
Position_Size = (Account_Equity × Risk_Percentage) / Stop_Loss_Distance
where Risk_Percentage typically ranges from 1-2% for conservative strategies to 3-5% for aggressive approaches.
5. Performance Analysis and Validation
5.1 Cross-Asset Backtesting Results
Based on meta-analysis of studies including Han, Zhou & Zhu (2014), Clare et al. (2013), and Levine & Pedersen (2016), optimized stop-loss strategies demonstrate substantial effectiveness:
Equity Markets
- Sharpe ratio improvements of 30-40% in momentum strategies
- Maximum drawdown reduction: 45-55% across major indices
Currency Markets
- Major pairs: 20-25% Sharpe ratio improvements
- High-volatility pairs: 35-40% improvement range
Commodity Markets
- Energy futures: 45-55% performance improvements
- Precious metals: 15-25% improvement range
5.2 Statistical Validation
Following methodologies established by Han, Zhou & Zhu (2014) and Clare et al. (2013):
- Bootstrap sampling demonstrates statistical significance across asset classes
- Out-of-sample testing confirms performance persistence
- Walk-forward analysis validates robustness across market cycles
6. Implementation Guidelines
6.1 Systematic Approach
To overcome behavioral biases and optimize performance:
1. Eliminate Discretionary Decision-Making: Use systematic, rule-based stop-loss placement
2. Volatility Adaptation: Employ ATR-based distances rather than fixed percentages
3. Position Sizing Integration: Calculate position size based on stop-loss distance
4. Regime Awareness: Adjust parameters based on volatility environment
5. Consistent Execution: Automate stop-loss placement and execution
6.2 Pine Script Implementation Considerations
For practical implementation in trading platforms:
- ATR calculation: Standard Pine Script ta.atr() function
- Trailing stops: Dynamic adjustment based on favorable price movement
- Volatility regime detection: Rolling ATR percentiles or simple moving averages
- Position sizing: Integration with account equity and risk parameters
7. Transaction Cost Analysis
Stop-loss strategies must account for implementation costs (Christoffersen & Diebold, 2006):
Direct Costs
- Commission fees: Typically 0.1-0.5% per transaction
- Bid-ask spreads: 0.05-0.15% for liquid instruments
- Market impact: 0.1-0.3% for retail-sized orders
Break-Even Analysis
The minimum performance improvement required to justify stop-loss implementation:
Required_Improvement = Transaction_Costs / Expected_Protection
Empirical analysis suggests break-even thresholds of 0.8-1.2% annual return improvement for most retail implementations.
8. Conclusion
This analysis demonstrates that scientifically-designed stop-loss strategies provide substantial improvements in risk-adjusted returns when properly implemented. Key findings include:
1. Volatility-Adaptive Approaches: ATR-based methods significantly outperform naive fixed-percentage stops, with Sharpe ratio improvements of 25-45% across asset classes.
2. Behavioral Discipline: Systematic biases in stop-loss implementation can destroy value, necessitating objective, rule-based approaches that eliminate emotional decision-making.
3. Cross-Asset Effectiveness: Optimal implementations show greatest benefits in equity and commodity markets, with currency markets displaying mixed results.
4. Practical Implementation: Simple volatility-based methods (ATR, trailing stops) provide most benefits while remaining implementable in standard trading platforms.
The evidence strongly supports the use of volatility-adaptive stop-loss strategies for retail traders, provided that implementation accounts for behavioral biases and transaction costs. For practitioners, the optimal approach involves systematic implementation of ATR-based thresholds, trailing stop mechanisms, and integrated position sizing, while maintaining strict discipline to avoid behavioral biases that can undermine strategy effectiveness.
References
Almgren, R., & Chriss, N. (2001). Optimal execution of portfolio transactions. Journal of Risk, 3(2), 5-39.
Barber, B. M., & Odean, T. (2001). Boys will be boys: Gender, overconfidence, and common stock investment. Quarterly Journal of Economics, 116(1), 261-292.
Barber, B. M., & Odean, T. (2013). The behavior of individual investors. In Handbook of the Economics of Finance (Vol. 2, pp. 1533-1570). Elsevier.
Christoffersen, P., & Diebold, F. X. (2006). Financial asset returns, direction-of-change forecasting, and volatility dynamics. Management Science, 52(8), 1273-1287.
Clare, A., Seaton, J., Smith, P. N., & Thomas, S. (2013). Breaking into the blackbox: Trend following, stop losses and the frequency of trading. Journal of Asset Management, 14(3), 182-194.
Fong, W. M., & Yong, L. H. M. (2005). Chasing trends: Recursive moving average trading rules and internet stocks. Journal of Empirical Finance, 12(1), 43-76.
Han, Y., Zhou, G., & Zhu, Y. (2014). Taming momentum crashes: A simple stop-loss strategy. Journal of Financial Economics, 112(3), 408-428.
Kahneman, D., & Tversky, A. (1979). Prospect theory: An analysis of decision under risk. Econometrica, 47(2), 263-291.
Kaminski, K. M., & Lo, A. W. (2014). When do stop-loss rules stop losses? Journal of Financial Services Research, 46(3), 249-276.
Kaustia, M. (2010). Disposition effect. In Behavioral Finance: Investors, Corporations, and Markets (pp. 169-189). John Wiley & Sons.
Kestner, L. N. (2003). Quantitative Trading Strategies: Harnessing the Power of Quantitative Techniques to Create a Winning Trading Program. McGraw-Hill Education.
Lei, T., & Li, X. (2009). Revisiting the classical strategy of trend following in more volatile trading environments. Emerging Markets Review, 10(4), 242-262.
Levine, A., & Pedersen, L. H. (2016). Which trend is your friend? Financial Analysts Journal, 72(3), 51-66.
Merkle, C. (2017). Financial overconfidence over time: Foresight, hindsight, and insight of investors. Journal of Banking & Finance, 84, 68-87.
Shefrin, H., & Statman, M. (1985). The disposition to sell winners too early and ride losers too long: Theory and evidence. Journal of Finance, 40(3), 777-790.
Tversky, A., & Kahneman, D. (1974). Judgment under uncertainty: Heuristics and biases. Science, 185(4157), 1124-1131.
Van Tharp, S. (2006). Trade Your Way to Financial Freedom. McGraw-Hill Education.
Wilder, J. W. (1978). New Concepts in Technical Trading Systems. Trend Research.
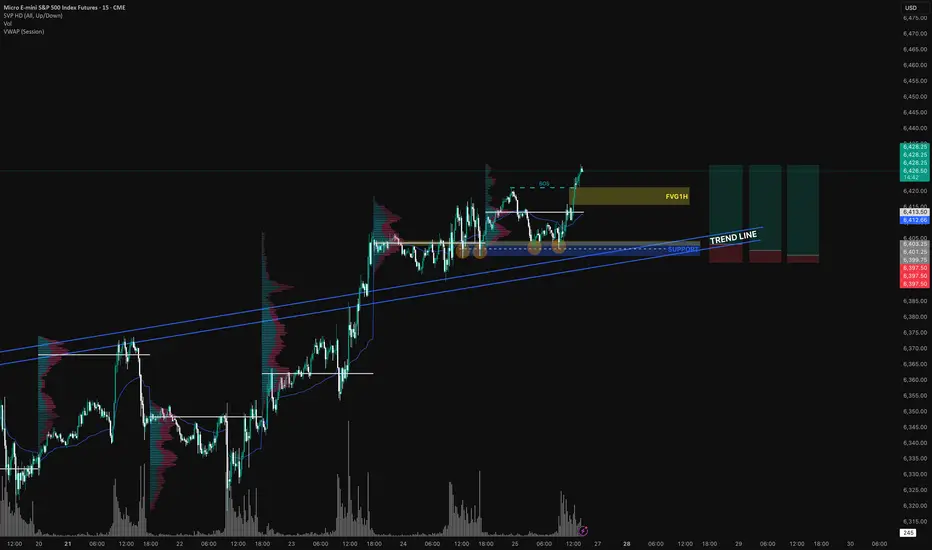
Long MES I see CME_MINI:ESU2025 is on a uptrend with a BOS( break of structure) at $6421, there is a trend line marked in blue that has been tested several times.
There is a support in confluence with POC area from a previous session. Above VWAP → Favorable for short positions (or considered expensive for long positions).
Below VWAP → Favorable for long positions (or considered expensive for sellers).
Personally, I build my position in zones — especially around key levels like order blocks, imbalance fills, or liquidity sweeps (Smart Money Concepts). I prefer scaling in when entering trades to catch better prices.
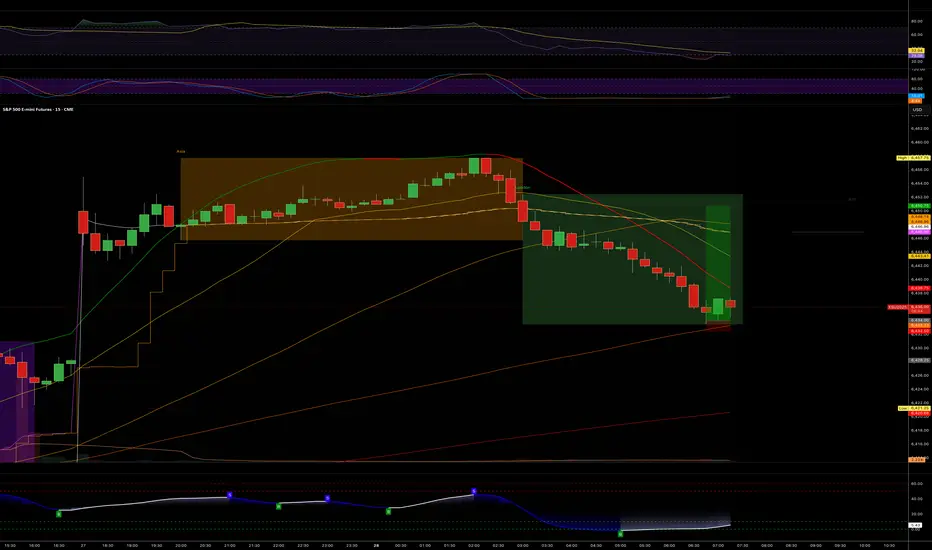
Buyers in Asia are setting the toneBuyers in the Asia time zone in the S&P 500 daily chart is setting a positive tone for Friday's action. This creates an expectation of a positive close going into the weekend

07/24/25 Trade Journal, and ES_F Stock Market analysis EOD accountability report: +1452
Sleep: 4 hours
Overall health: need to catch up on sleep
** VX Algo System Signals from (9:30am to 2pm) **
— 9:37 AM Market Structure flipped bullish on VX Algo X3! :white_check_mark:
— 10:10 AM VXAlgo ES X1 Sell Signal :white_check_mark:
— 12:30 PM Market Structure flipped bearish on VX Algo X3! :x:
— 1:00 PM VXAlgo NQ X1DD Buy Signal :white_check_mark:
— 1:30 PM Market Structure flipped bullish on VX Algo X3:white_check_mark:
**What’s are some news or takeaway from today? and What major news or event impacted the market today? **
Today's market was a bit wild in the morning with a lot of big moves, sot here was opportunity to money if followed the signals.
I mostly finished trading by 12:30 because there was so many big moves.
**News**
(US) Pres Trump: Regarding firing Powell, would be a big move, it's not necessary; No pressure for Powell to resign; Have 1-3 names in mind for Fed Chair position
**What are the critical support levels to watch?**
--> Above 6370= Bullish, Under 6355= Bearish
Video Recaps -->https://www.tradingview.com/u/WallSt007/#published-charts


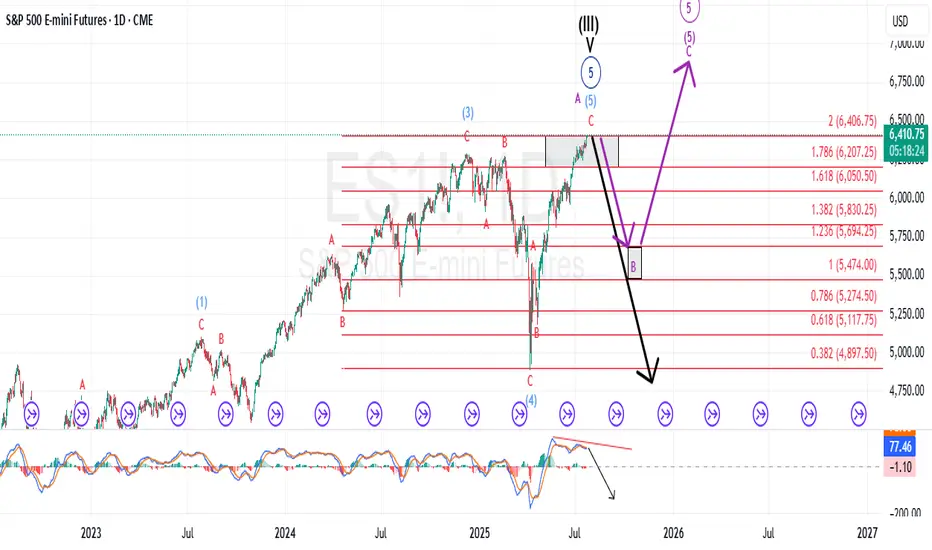
Extended rally off April lows should be completing imminentlyEvery so often, a market move defies conventional expectations of retracement—and the rally off the Liberation Day lows is exactly that. It’s extended longer and climbed higher than even the most bullish forecasts imagined in early April. No one remembers the calls for an imminent recession by most large Wall Street firms.
Now, we're pushing into yet another all-time high—despite glaring negative MACD divergence and a financial media landscape that’s nothing short of euphoric.
The narratives being pushed? Honestly, it’s hard to write them with a straight face:
Tariffs are no longer inflationary. Apparently, I wasted time and tuition learning international trade theory and macroeconomics. Who knew deficits and trade imbalances didn’t matter anymore? Who pays tariffs again? ...never mind.
Weak momentum since mid-May signals not exhaustion—but an “unhealthy absence” of institutional selling, which apparently means the retail trader is in full control now. Because that always ends well... right?
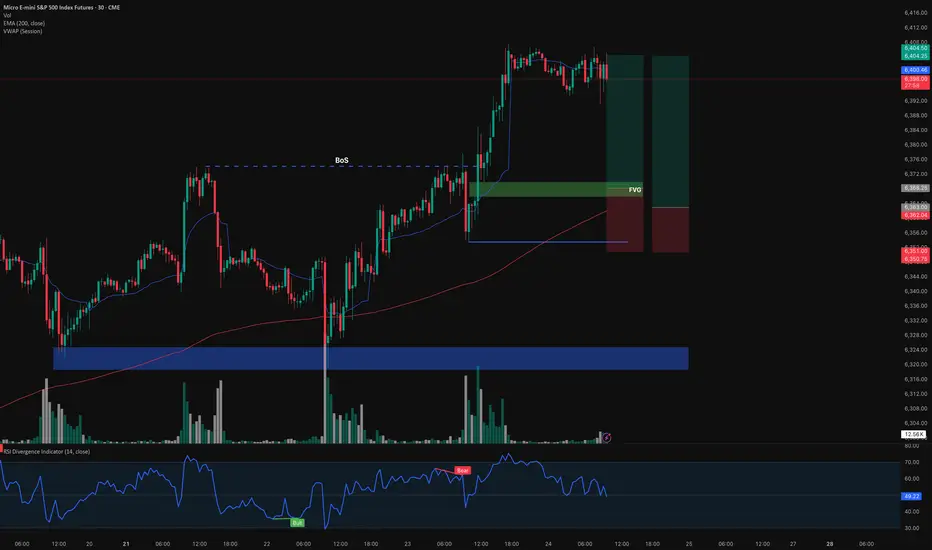
Long MESentry 6338
stop loss 6351
TP 6404.50
1. currently in a uptrend
2. FVG at 6368
3. above 200ema
Before I enter my trade at Id like to look for some market structure to form.
if it breaks below 6353.5 and makes a ChoCh im no longer bullish
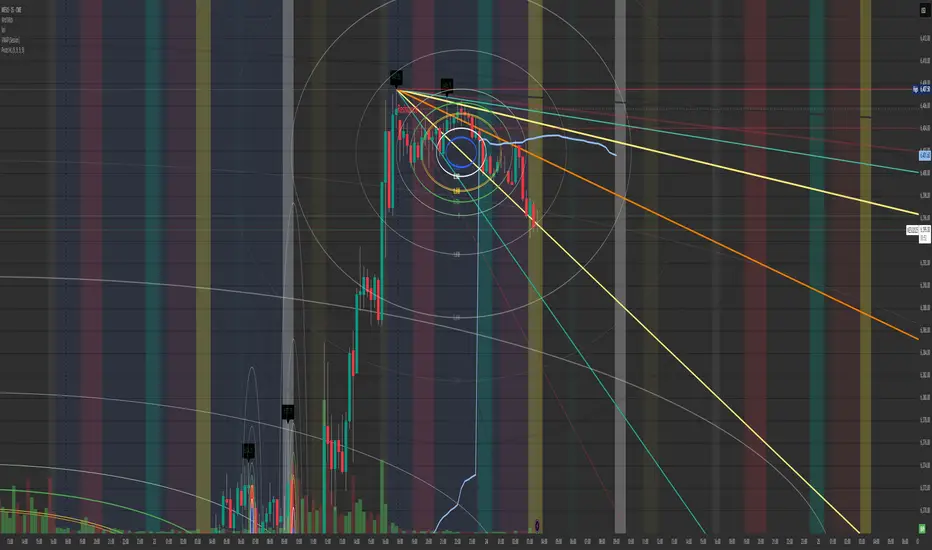
$ES and $NQ look to be dropping like a hot rock after the close.Looking at the Fib Circles and the previous day high along with the Gann. Well I know this is the micro ES but they run at the same % of p/l. If you notice how the high during yesterdays session and the low. Notice the Blue circle in the center?
Any and every time I can draw out the circle from high to low daily levels from past to current. (as you have seen in my previous examples.) Either the trend completely hits the limit of the blue circle. Than reverts to the buyers stepping up or sellers dropping down below the blue circle. Its like a plague to the momentum of the market and can change it in any direction.
I have noticed this as well. If the bid/ask price is within it during the time of the candle. It jumps or completely runs down through it meaning that I believe its a good place to either buy in any uptrend or sell in a Monthly/weekly/daily/hourly analytic.
That's what the Gann Fibonacci level tool is useful for in my eyes. If the trend keeps going down below any level I find that there's probably about a 10%-20% chance it will keep going down.
For me the Gann Is better than any trendline because it shows the fib along with the trend.
Not investment advice just a perspective I have had working with it since someone showed the wrong way. Than I remembered Highs first down to Lows of the tf, being it 15 min/hourly/daily/Weekly/Monthly.
Just a thought
Anyone have any opinions?
If so give me a ring and follow so I can get chart ideas that will great fully improve my futures trades.
Have a profitable day and be safe all.
Paul.