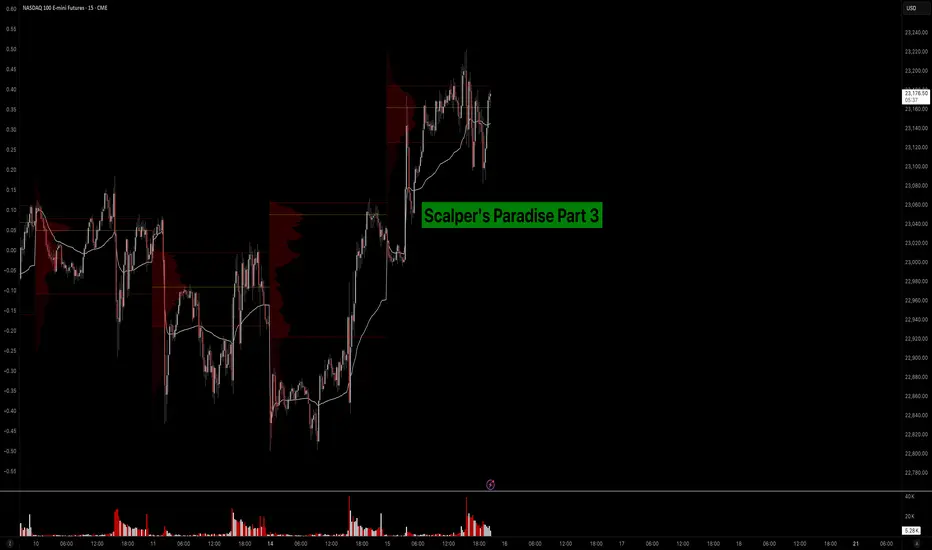
Scalper’s Paradise Part 3 – The Power of Order Flow and DOMWelcome back to Scalper’s Paradise! In this third part of the series, I want to take you into one of the most powerful tools in professional trading: Order Flow and the Depth of Market (DOM).
I chose this topic because during my time as an institutional trader, this was our entire world. We didn’
No news here
Looks like there's nothing to report right now

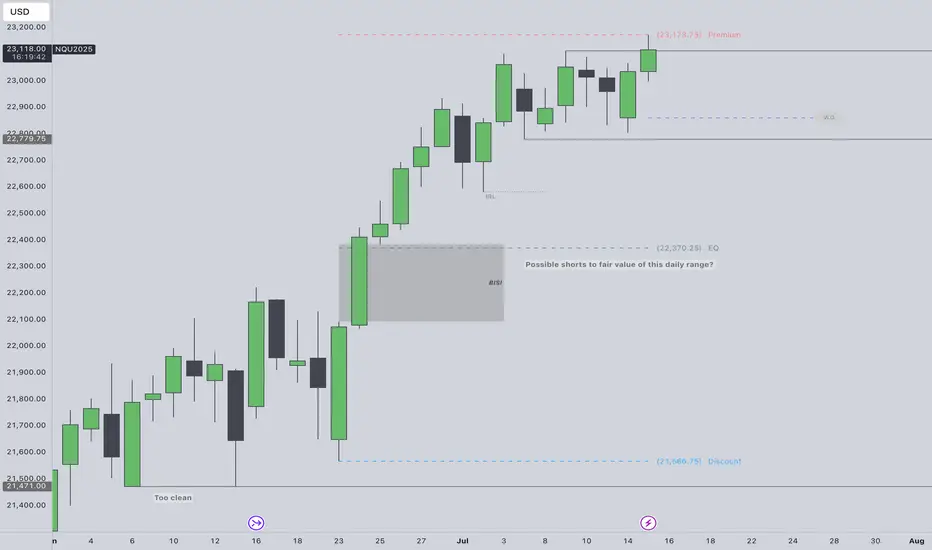
To fade all time highs or not?Not trying to fade ATH run but the SSL in this daily range looks too obvious to me. Super premium.
Price was in a consolidation July 7th - 14th. Took external range high today. I really could see shorts playing out if theres a intraweek reversal confirmed after purging the ERH.
Would need to see 1
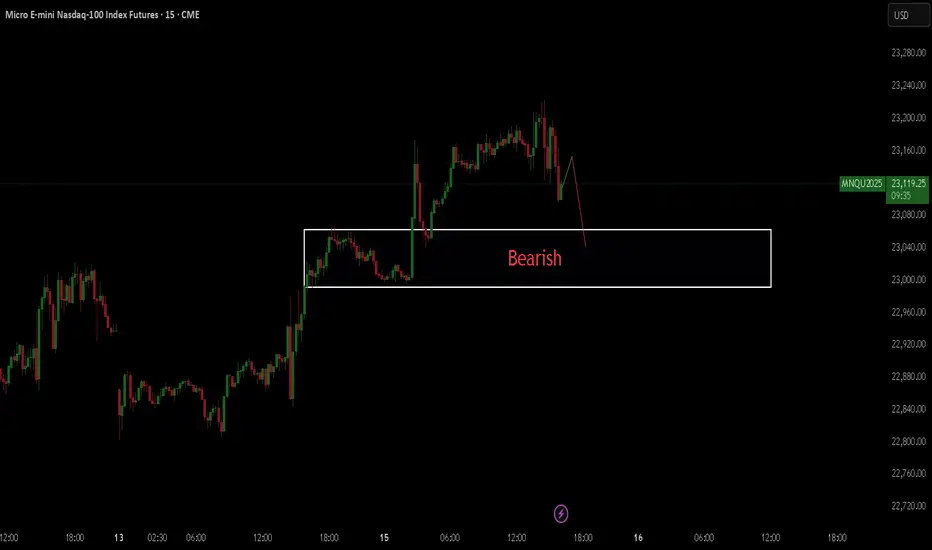
NASDAQ BEARISHHello, with my skills and my analysis I see that the Nasdaq market has a good chance of falling.
NASDAQ: Time For A Pullback?In this Weekly Market Forecast, we will analyze the NASDAQ for the week of July 14 - 18th.
The NASDAQ had a strong week, until Tariff Tensions Friday arrived.
This by itself doesn't mean we should start looking for sells. Just like the S&P 500, I'm expecting short term bearishness, as price goes f

NQ Short (07-16-25)NAZ again can't hold on the Monday off session pump during the Reg Session and does hit lower zone of 22,920. Next trick is Gov't controlled news (released in off session of course) should that not lift it then KL's 881-780 may be next.
The NAZ will go lower under 780 and will be a Strong Short un
Shorting NQ Yep, weakness started to creep in on NQ this time.
Firstly, the higher timeframes shows massive divergence, even when whales tried to push the price high and continue the trend, massive shorts came in with massive volume. It only tells me that bears are in control this time, and they are coming in

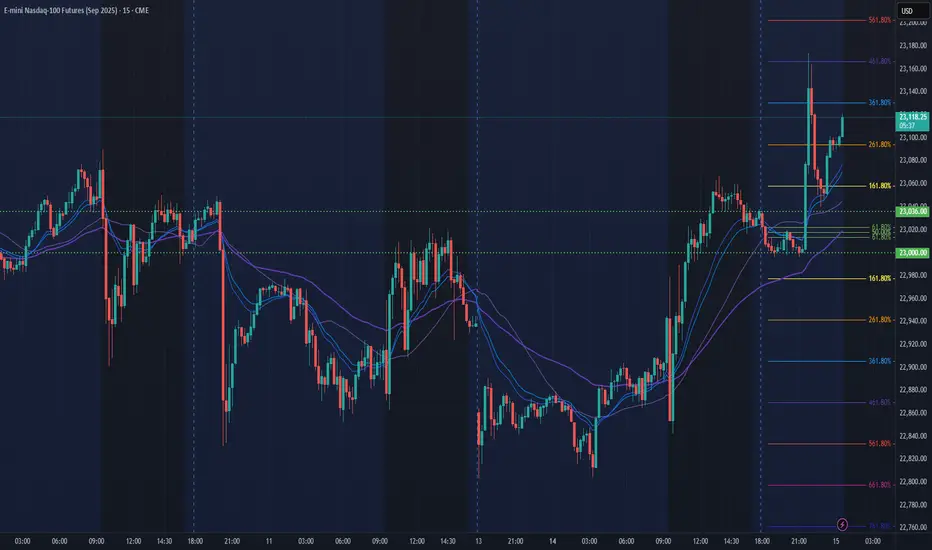
NQ Power Range Report with FIB Ext - 7/15/2025 SessionCME_MINI:NQU2025
- PR High: 23036.00
- PR Low: 23000.00
- NZ Spread: 80.5
Key scheduled economic events:
08:30 | CPI (Core|MoM|YoY)
Asian hours vol spike breakout swing into new ATHs
Session Open Stats (As of 12:15 AM 7/15)
- Session Open ATR: 290.39
- Volume: 42K
- Open Int: 276K
- Trend G
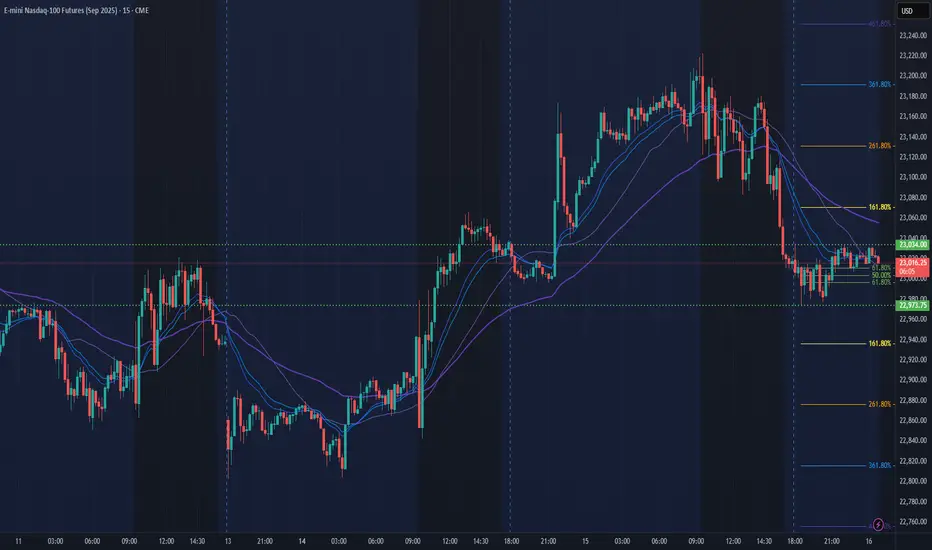
NQ Power Range Report with FIB Ext - 7/16/2025 SessionCME_MINI:NQU2025
- PR High: 23034.25
- PR Low: 22973.75
- NZ Spread: 135.5
Key scheduled economic events:
08:30 | PPI
10:30 | Crude Oil Inventories
AMP margins raised overnight for expected PPI volatility
Session Open Stats (As of 12:25 AM 7/16)
- Session Open ATR: 277.22
- Volume: 27K
- Op
Market Watch UPDATES! Stock Indices, Gold, Silver, US OILWelcome to the Market Watch Updates for Monday, July 14th.
In this video, we will give the forecast updates for the following markets:
S&P500, NASDAQ, DOW JONES, GOLD, SILVER and US OIL.
Enjoy!
May profits be upon you.
Leave any questions or comments in the comment section.
I appreciate any feed

See all ideas
Summarizing what the indicators are suggesting.
Neutral
SellBuy
Strong sellStrong buy
Strong sellSellNeutralBuyStrong buy
Neutral
SellBuy
Strong sellStrong buy
Strong sellSellNeutralBuyStrong buy
Neutral
SellBuy
Strong sellStrong buy
Strong sellSellNeutralBuyStrong buy
A representation of what an asset is worth today and what the market thinks it will be worth in the future.
Displays a symbol's price movements over previous years to identify recurring trends.
Frequently Asked Questions
The current price of Micro E-mini Nasdaq-100 Index Futures (Sep 2025) is 23,224.25 USD — it has fallen −0.12% in the past 24 hours. Watch Micro E-mini Nasdaq-100 Index Futures (Sep 2025) price in more detail on the chart.
The volume of Micro E-mini Nasdaq-100 Index Futures (Sep 2025) is 1.03 M. Track more important stats on the Micro E-mini Nasdaq-100 Index Futures (Sep 2025) chart.
The nearest expiration date for Micro E-mini Nasdaq-100 Index Futures (Sep 2025) is Sep 19, 2025.
Traders prefer to sell futures contracts when they've already made money on the investment, but still have plenty of time left before the expiration date. Thus, many consider it a good option to sell Micro E-mini Nasdaq-100 Index Futures (Sep 2025) before Sep 19, 2025.
Open interest is the number of contracts held by traders in active positions — they're not closed or expired. For Micro E-mini Nasdaq-100 Index Futures (Sep 2025) this number is 108.68 K. You can use it to track a prevailing market trend and adjust your own strategy: declining open interest for Micro E-mini Nasdaq-100 Index Futures (Sep 2025) shows that traders are closing their positions, which means a weakening trend.
Buying or selling futures contracts depends on many factors: season, underlying commodity, your own trading strategy. So mostly it's up to you, but if you look for some certain calculations to take into account, you can study technical analysis for Micro E-mini Nasdaq-100 Index Futures (Sep 2025). Today its technical rating is buy, but remember that market conditions change all the time, so it's always crucial to do your own research. See more of Micro E-mini Nasdaq-100 Index Futures (Sep 2025) technicals for a more comprehensive analysis.