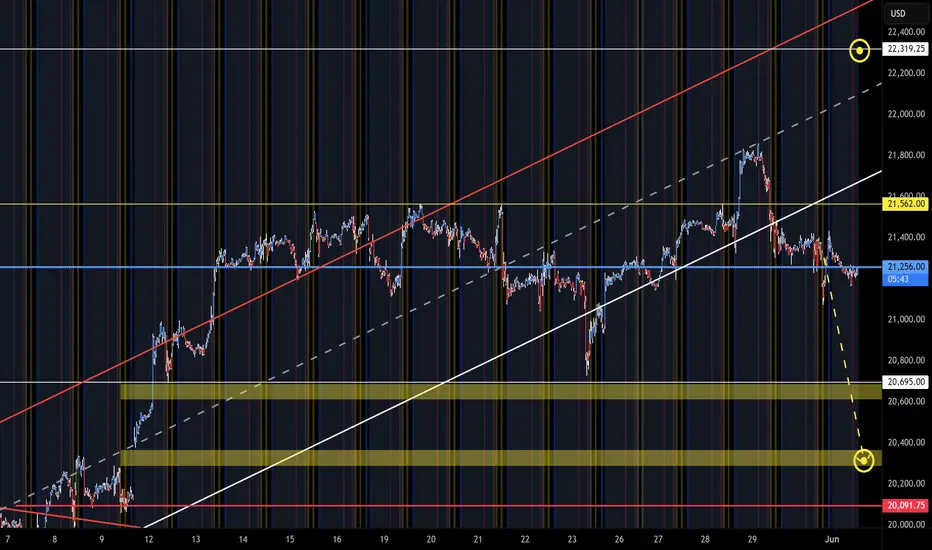
NQ Short (05-19-25)Same plan as prior Post, Short. The play is that the NAZ will try some FA's below (Shaded Zones) and then U Turn up during some late low volume Holiday session and attempt ATH retest. No U Turn, next SZ lower. Long above KL 365 and Short below. Price Action is all about Tricks, Tweets, Games and any low volume session opportunity (long side now). Still want to retest the 15m 2,000 point blast zone.
MNQZ2019 trade ideas

nas lookingg bearishrecently broke down out of the hr uptrend also we can see that price has broke the support that was created around 21350
I believe we will see a massive drop taking out the lows of
April 25th
trading is risky plz use proper risk management if you decide to trade the Financial markets!

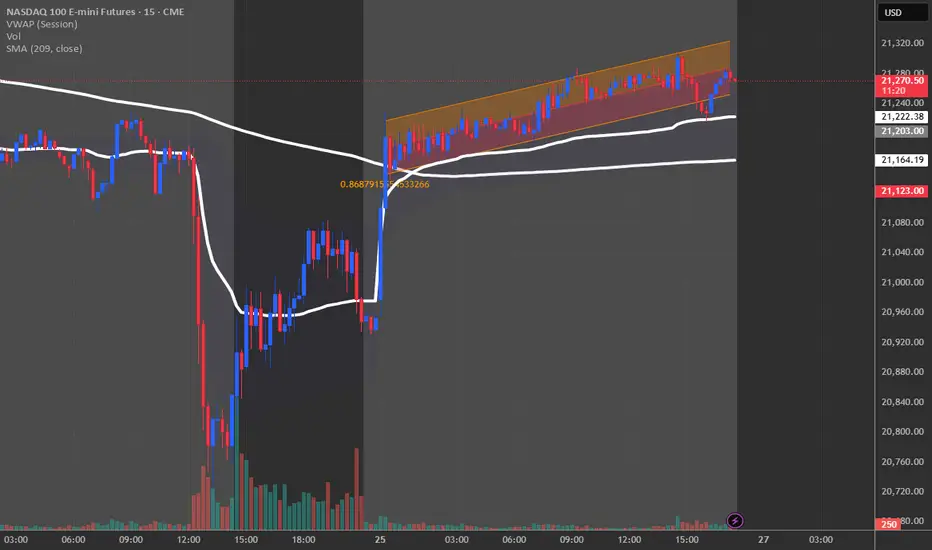
Reversal Fakeout to Grab liquidity NQ1In this bullish continuation setup, big players (institutional traders, hedge funds, and market makers) are actively maneuvering around key levels. After price bounces from the Order Block area, these entities aim to manipulate liquidity by triggering stop-loss placements before continuing the trend.
How They Operate:
Stop-Hunting: Institutions know where retail traders place stops—often below key support or VWAP. They drive price lower to collect liquidity before pushing the market higher.
Fakeout Moves: A sudden dip below VWAP or the Order Block might shake out weak hands before price aggressively resumes the bullish trend.
Accumulation Before Expansion: Large players accumulate positions inside the Order Block area while creating an illusion of bearish pressure, trapping shorts before the next push up.
Trade Psychology & Execution:
Spot the Trap: If price dips unexpectedly, assess volume spikes—if liquidity is being swept without follow-through downside movement, it’s likely a stop-hunt.
Hold Strong Levels: A bullish continuation may unfold after liquidity is collected, as institutions reclaim price above VWAP, fueling the next leg higher.
Strategic Stop Placement: Avoid placing stops too close to obvious levels—consider wider stops below strong liquidity zones to survive manipulation tactics.
The key takeaway? Smart money plays around liquidity zones, forcing weak hands out before driving price in the intended direction. Stay patient, analyze the setup, and position wisely to ride the bullish wave after the institutions have had their turn.
Follow @GoldenZoneFX For more content and valuable insights.

NQ Short (06-02-25)H/S playing out with drop test on deck. Short below KL 562 and Long above, expect the same tricks/games during the O/N and Dead Zone of Reg Session. Boring days as we wait for some selling to show up as the buyers are losing steam.
How To Read Trading ChartsIn this video, I discuss how to read and interpret the bars/candles on a chart so you can begin to learn price action.

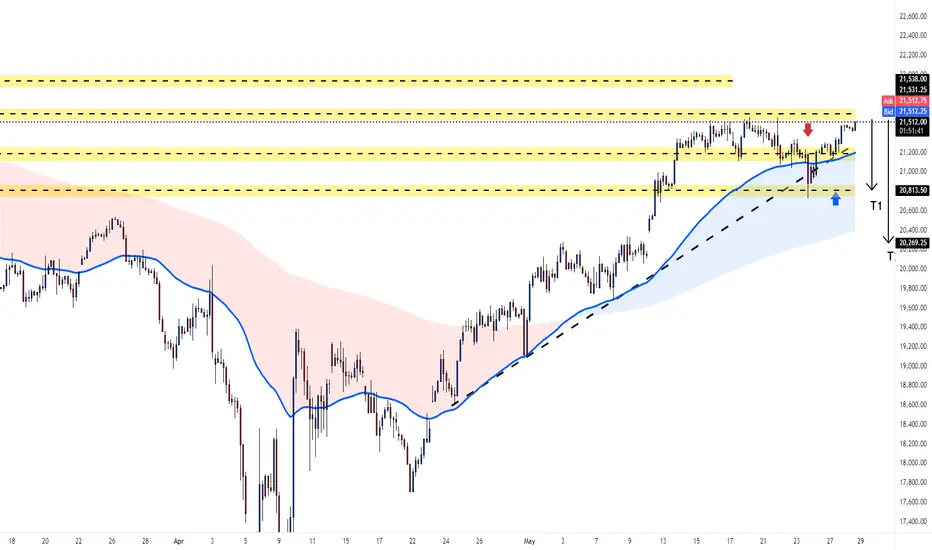
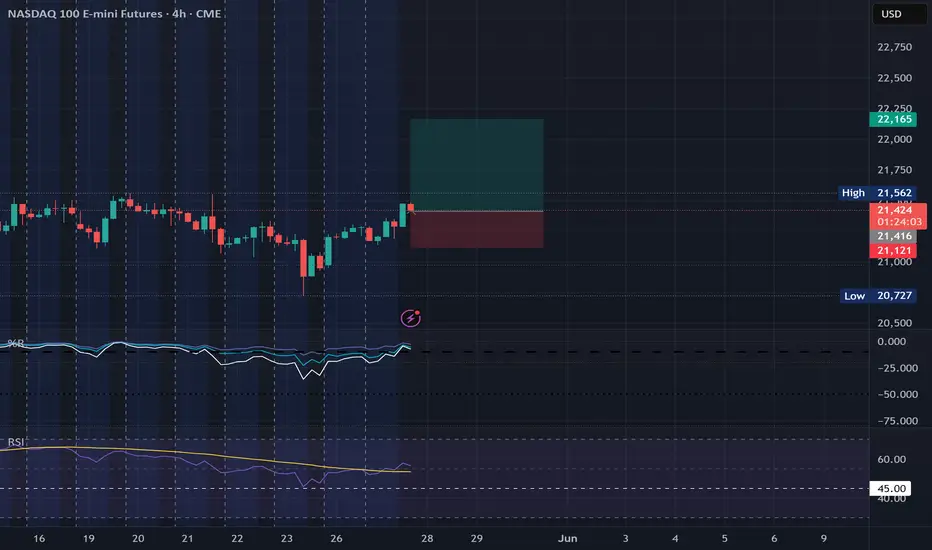
This is a 4-hour chart of the NASDAQ 100 index (NQ1!). Analysis:
Trend and Support: The chart shows an ascending trendline (black dashed line) acting as support, with the price recently bouncing off it around the 20,260 level. This suggests the uptrend remains intact for now.
Price Action: The price has pulled back from a high near 21,500 ish and is currently consolidating around 21,000. The recent bounce off the trendline indicates potential buying interest at lower levels.
Key Levels:
Resistance Zone: The yellow shaded area between 21,200 and 21,550 is a resistance zone where the price previously struggled.
Support Zone: The area around 20,800–20,900 (another yellow shaded area) may act as immediate support if the price dips again.
Targets: T1 (20,813.50) and T2 (20,626.25) are marked as potential downside targets if the price breaks below the trendline. On the upside, breaking above 21,550 could target 21,800 (top of the resistance zone).
Market Sentiment: The order book on the right shows the current ask at 21,531.25 and bid at 21,506.25, with a tight spread indicating decent liquidity. The price is slightly below the ask, suggesting some selling pressure or hesitation to break higher immediately.
Potential Scenarios:
Bullish: If the price holds above the trendline and breaks 21,400, it could rally toward 21,800 or higher.
Bearish: A break below the trendline and 20,800 support could lead to a deeper pullback toward T1 (20,813.50) or T2 (20,626.25).
Insight: The NASDAQ 100 is in an uptrend but facing resistance near 21,400. Watch for a breakout above this level for bullish confirmation or a break below the trendline for a bearish move. The 20,800–20,900 zone is a key support to monitor.
The Last Batch of Good DataCME: Micro E-Mini Nasdaq 100 Index Futures ($MNQ) #TheFuturesLeap #Microfutures
Investors have defied the Wall Street adage of “Sell in May and Go Away”.
The S&P 500 rose by 6.2% in May while the Nasdaq climbed 9.6%. Both indices notched their best monthly results since 2023. The Dow Jones gained 3.9% for the month. The S&P stood out as it recorded its best performance for the month of May since 1990.
Several favorable factors propelled May’s impressive stock index gains:
• Early-May employment data pointed to continued strength, raising risk appetite.
• A temporary U.S.-China tariff reduction for 90 days helped calm trade tensions.
• Robust earnings from Nvidia and Super Micro Computer fueled rally momentum.
Meanwhile, these unfavorable events also occurred in May:
• Moody’s downgraded the US sovereignty rating. By now, the US has lost its AAA ratings from all three major credit agencies.
• The 20-year Treasury bond auction received a cold shoulder in the bond market.
• The trade talk between U.S. and China has been stalled apparently.
In any other time, bad news of such significance would send the stock market into a free fall. But investors turned a blind eye to them. This highlighted a bullish market sentiment, a prevailing appetite for risky assets amid uncertainty in geopolitical and trade tensions.
Underpinning the rising stock prices are solid macroeconomic data for the month of April and strong Q1 earnings from major US corporations. Given that stock prices reflect expected future earnings, it is fair to ask: Will the data stay good?
Import dependency is unlikely to change any time soon
On May 30th, US Census Bureau reported that the U.S. trade deficit in goods narrowed sharply in April, with the gap contracted 46.0% to $87.6 billion. Goods imports decreased by $68.4 billion to $276.1 billion. Exports of goods increased by $6.3 billion to $188.5 billion.
What really happened is that there was a boost in imports in Q1 due to the front-running ahead of tariffs. This ended in April as the higher rates kicked in. If we take March out as an outliner, we will find that the April data is 9.7% higher than February. As a matter of fact, U.S. trade deficits in 2025 rose sharply comparing to 2023 and 2024 levels.
With the US-China interim trade deal in effect from May 14th, we could expect large waves of imports to resume from now through August, pushing trade deficits even higher.
The global supply chain is decades in the making. Its undoing will take years. Meanwhile, imports will pour in, only at higher costs due to the new tariffs and higher freight costs.
My conclusion: U.S. trade deficit will grow bigger, at least for the remainder of 2025.
Retail price hikes could cause inflation to rebound
US retailers largely source their products overseas. Could they just “eat the tariffs?”
• Walmart: FY2024 revenues $681 billion (+5.1% YoY). Net income jumped 25.3% to $19.4 billion, lifting its net profit margin to 2.9%.
• Target: Revenue $107.4b (-1.6%). Net income $4.14b (+49%). Profit margin 3.9%.
• Costco: Revenue $254.5b (+5.0%). Net income $7.37b (+17%). Profit margin 2.9%.
• Walgreens: Revenue $147.66 billion (+6.17%). Net Income -$8.64 billion (-5.9%)
• Amazon: Revenue $638.0b (+11%). Net income $59.2b (+95%). Profit margin 9.3%.
Apparently, even the largest and the most efficiently run retail giants are operating with a razor-thin margin. Retailers really have no choice but to pass on the tariffs to consumers, in the form of higher prices.
On May 15th, Walmart announced to raise prices starting in late April. The price hikes would accelerate in May, and a larger sting will start to be felt in June and July when the back-to-school shopping season goes into high gear.
Other retailers are expected to follow suit. Walmart’s action provides air cover for the tens of thousands of retailers to raise their prices freely.
My conclusion: Inflation will go up from May through the holiday season in December.
Higher interest cost will eat into the bottom line
While stock investors brushed off the Moody’s downgrade, the bond market has been in real trouble. As the US treasury bonds lost their “risk-free” status, debts of all kinds and all durations see a big spike in yield. Bond investors are undergoing a complete makeover of repricing bonds and reassigning a new “risk premium”.
On May 21st, the U.S. Treasury held an auction for 20-year bonds that fell significantly short of expectations. The lack of bidders—an alarming indicator of waning confidence in the U.S. economy—resulted in the yield on these bonds skyrocketing to 5.1%.
The bond yields go up even though the Fed holds rates steady. This indicates that central bank monetary policies are not very effective in shaping the long end of the bond market. Even if the Fed lowers the overnight Fed Funds rates, bond investors would still demand higher yield to compensate for the perceived risk increases for the once “risk-free” instruments. Commercial banks could keep interest rates high for mortgages, corporate bonds, auto loans and credit cards.
As of June 2nd, the futures market puts the odds of the Fed holding rates unchanged at 95.4% for its June 18th FOMC meeting, according to CME Group FedWatch tool.
www.cmegroup.com
My conclusion: The Fed may have little appetite for cutting rates if inflation goes up. When they cut the overnight rates, businesses and households may not get any relief from high interest expenses.
Trade tensions and geopolitical risks may stay elevated
Before the ink dries on a temporary agreement, the trade talk between U.S. and China has been stalled. The minister-level negotiation has gone nowhere, and it may take presidential talk to salvage the agreement. At this point, we could not make any assumption about any trade agreement. Its shape and form and timing are uncertain. If the trade talk breaks down, we will see a new round of tariff reescalation and retaliation.
On June 2nd, breaking news report that Ukraine carried out a large drone attack deep into the Russian territory. Russian retaliation is expected. After months of effort, potential ceasefire and peace negotiation could fall apart.
My conclusion: Trade and geopolitical tensions are both escalating, after early signs of calming down. These would hurt economic growth and dent investor appetite for risk.
Trading with Micro E-Mini Nasdaq 100 Index Futures
Based on my analysis above, I hold the opinion that good data may quickly turn bad in the coming weeks, and correction in the US stock market is imminent. Valuation at the current lofty level completely ignores the risk escalation closer on to us. Anyone sharing this view could express it by shorting the CME Micro E-Mini Nasdaq 100 Index Futures.
The Micro Nasdaq contract has a notional value of $2 times the index. At the Friday closing price of 21,578, each September contract is worth $43,156. The minimum margin for shorting one contract is $3,036 at the time of this writing.
The latest CFTC Commitments of Traders report shows that, as of May 27th, the total open interest for Emini Nasdaq and Micro Nasdaq futures are 275,143 and 204,499 contracts, respectively.
• Leverage Fund has 77,467 in long, 251,452 in short, and 10,472 in spreading
• The long-short ratio of 1-to-3.2 (= 77467/251452) show that the “Smart Money” is very bearish on the Nasdaq while the index gained nearly 10% in May
Hypothetically, if Nasdaq 100 were to pull back 5% before September, a short futures position will gain $2,157.8 (= 21578 * 0.05 * 2).
The risk of shorting the Nasdaq is that the stock index continues to rally. To hedge the downside risk, the trader could set a stop-loss at his order. For example, a stop loss at 23,000 for a short order would set the maximum loss to $2,844 (= (23000-21578) x 2).
Happy Trading.
Disclaimers
*Trade ideas cited above are for illustration only, as an integral part of a case study to demonstrate the fundamental concepts in risk management under the market scenarios being discussed. They shall not be construed as investment recommendations or advice. Nor are they used to promote any specific products, or services.
CME Real-time Market Data help identify trading set-ups and express my market views. If you have futures in your trading portfolio, you can check out on CME Group data plans available that suit your trading needs www.tradingview.com

NASDAQ Meltdown Incoming? The Calm Before the Crash…🚨 Get ready! The NASDAQ is about to take us on a wild plunge straight to the depths of market hell... 💥🔥
Yes, yes, I know—they’ll say it’s all "because of this" or "due to that," the usual play-acting we’ve seen a hundred times before. Just another scene in the never-ending economic theater. 🎭
But here’s the forecast for tomorrow’s news:
📉 United States Initial Jobless Claims – possibly lower than expected?
📈 United States GDP Growth Rate QoQ – higher than expected?
And then... yada yada yada. You know the rest.
What does that mean? A chain reaction in risk-on assets — stocks, indexes, crypto — all heading for a steep drop. 💣📉
If you’re still a believer, here’s your solid proof — laid out 24 hours before it happens. Don’t say we didn’t warn you.
The choice is yours:
💊 Red pill or blue pill?

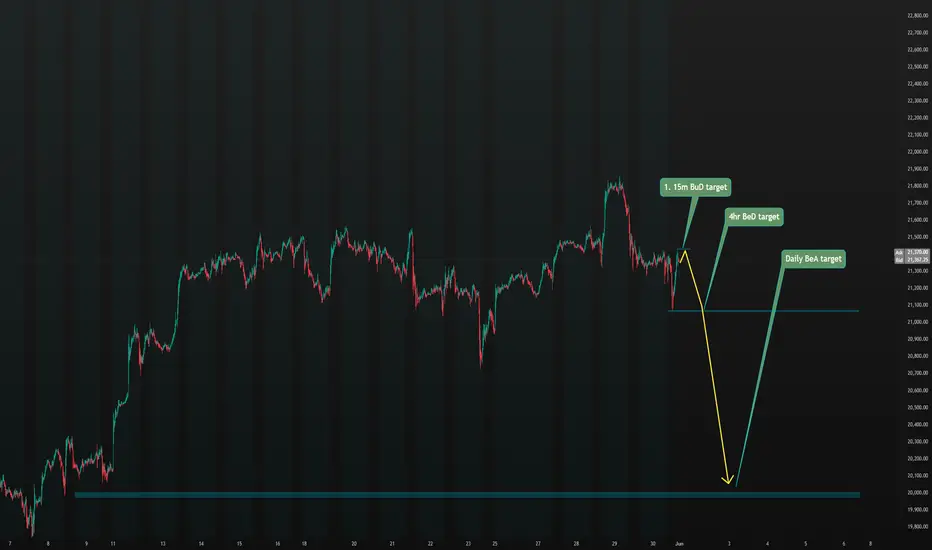
E-Mini Nasdaq 100 analysis based on Heiken-Ashi15m, 4hr, daily forecast based on Heiken-Ashi chart pattern, as I couldn't find any patterns on 1 hour chart, ones that found were already validated by this time. We'll come back to this to validate it.
NQ_F should be interesting this month CME_MINI:NQ1! is at a pivot-point - prepare yourself. NASDAQ:QQQ

Sell then Buy NQSelling from market vol movement. Buy for sustained trend similar to Gold. Slipping for too many reasons

MNQ Long15min - awareness of lower POI
liquidity, manipulation, sweep, imbalance and mitigation around the 78.6

nasdaq trade ideaslooking to short the open on sunday with limit orders on potential lows needs to gap atleast 100 points for me to wanna short.. targeting levels lower, like a 50%-61.8% retracement from mays lows to current highs... if we do not have a good opening gap to the downside i see a potential reversal pattern forming... price has hit the 4h bollinger band lows.. giving a potential oversold signal. want to see price put a low in ontop of the 4h bollinger band mid point confirming the trend has reversed before going long..

MNQ Buy Idea 5.29.25 (Part 2)Continuation of the first video entry of this trade.
We were aiming for $200 in profits today but failed to get that, ending with $61 in profits. I don't think we will be entering another trade due to the time and also that I want to focus on reading my book "The Trading Game" by Ryan Jones.
If you guys found this insightful give it a 🚀, it helps me see that you guys learned something from watching this and motivates me to post more.
Drop your comments down below, do you think MNQ is bullish or bearish? What prices do you see MNQ reaching?

long nasdaqheres 2 very basic examples of what i think could play out on the nasdaq... personally i think were overbought and need a pullback.. not looking to short this market tho, am watching for a momentous push threw the highs. or to get long on a pullback
Aggressive Moves Around VWAP: The CatalystWhen NQ1 exhibits an aggressive move relative to the VWAP, it typically indicates that large players—such as institutionals and hedge funds—are taking notice. An aggressive break above the VWAP can signal strong bullish momentum, while an aggressive breakdown below it suggests equally forceful bearish pressure. In both instances, the intensity of the move often precedes a significant directional commitment from the market.
The Critical Role of Pullback Confirmation
However, the initial surge or drop isn’t enough on its own for a reliable signal. The true confirmation comes when the price pulls back to the VWAP. For instance:
Bullish Scenario: After an aggressive upward breakout, if the price retests the VWAP and forms a solid bullish (green) candle, this pullback confirmation reinforces that the move is supported by institutional buying. It reassures traders that the upward momentum isn’t a false breakout, giving greater confidence in a long position.
Bearish Scenario: Conversely, if the price aggressively falls below the VWAP and then pulls back to retest it—this time showing a strong bearish (red) candle—it signals that the downtrend is supported and genuine. The pullback confirmation filters out noise and helps avoid premature exits or entries.
This "Break + Confirmation" setup is key to distinguishing between fleeting price fluctuations and sustainable trends in NQ1.
What This Reaction Tells Us
The way NQ1 reacts when nearing the VWAP is essential in shaping trade decisions:
An aggressive move signals a readiness of the market to commit in one direction.
A subsequent pullback and confirmation via a decisive candlestick pattern validates that initial move.
This dual-phase validation offers a high-probability scenario because it not only captures the momentum but also ensures that the price level around the VWAP holds up as a pivot point.
This approach helps to avoid false breakouts, ensuring that a directional bias—either long or short—is only taken once the market has clearly reasserted its intent through a retest phase.
In Summary
Observing how NQ1 reacts around the VWAP provides powerful clues about market sentiment:
Breakout or Breakdown: Aggressive moves away from the VWAP indicate that market forces are strong.
Retest Confirmation: A pullback to the VWAP with a confirming candle (green for bullish, red for bearish) is the reliable trigger for high-probability trading entries.
Institutional Insight: These moves often mirror the actions of larger market players who are shaping the next leg of the trend.
Ultimately, the strategy revolves around patiently waiting for both the aggressive move and the subsequent confirmation to align, thereby filtering out noise and solidifying a clear trade bias.
Bullish BreakoutThere's a lot of greed towards the upside in this current market state. Fear consolidation is confirmation of this. Stoploss below said fear consolidation pricing.
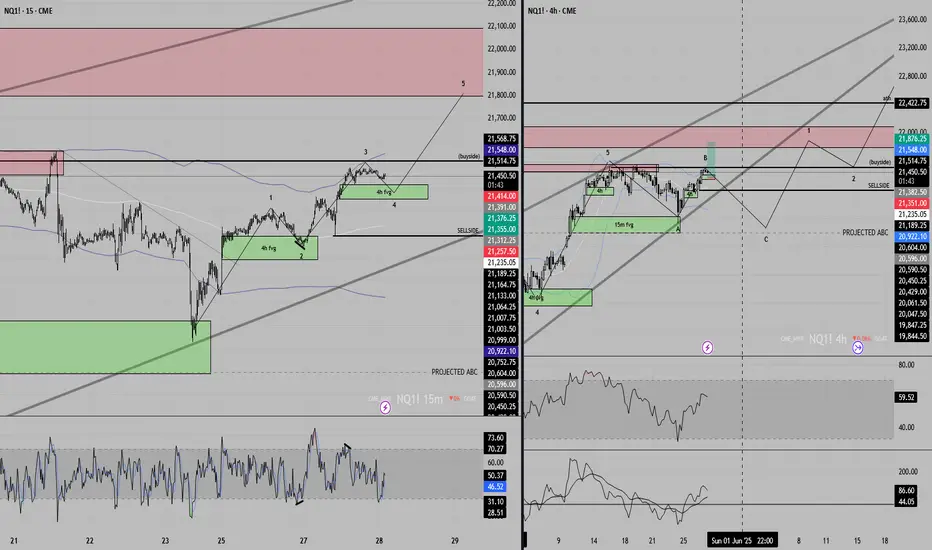
Nasdaq forecast for next weekNQ has huge 4h IFVG , gonna expect reaction from it, at around 21620
if breaks above and close on 4h-daily then , ATh hello if not gap and monthly IFVG gonna be target for potential short

Poor executions on MNQ A little post for transparency, down -$225 for the day. Made some error trading mistakes. I should've just closed the charts and been content with my $60 profit. But I still learned a lot through staying on the charts and watching price.
10am candle not breaching its highs and failing to take it was a great indication that the candle wanted to target sell-side -- let my feelings get me a little excited today and that ended up resulting in losses. I will take the losses for today and check back in around 2pm and if not later today at 2pm, I'll be trading tomorrow morning NY session.
Talk to you guys soon! Give a 🚀 if you found this insightful.

NQ Power Range Report with FIB Ext - 5/30/2025 SessionCME_MINI:NQM2025
- PR High: 21395.25
- PR Low: 21335.25
- NZ Spread: 134.0
Key scheduled economic events:
08:30 | Core PCE Price Index (YoY|MoM)
09:45 | Chicago PMI
Rotation off 21850
- Previous session print advertising decline back to week low
Session Open Stats (As of 1:25 AM 5/30)
- Session Open ATR: 446.48
- Volume: 33K
- Open Int: 267K
- Trend Grade: Neutral
- From BA ATH: -5.6% (Rounded)
Key Levels (Rounded - Think of these as ranges)
- Long: 22096
- Mid: 20383
- Short: 19246
Keep in mind this is not speculation or a prediction. Only a report of the Power Range with Fib extensions for target hunting. Do your DD! You determine your risk tolerance. You are fully capable of making your own decisions.
BA: Back Adjusted
BuZ/BeZ: Bull Zone / Bear Zone
NZ: Neutral Zone

MNQ Buy Idea 5.29.25 (Part 1)Targeting buy-side with this 10AM candle.
Wanted price to take the highs of the 10am open, but we seemed to have failed to as of 11am, SL was hit unfortunately for a final profit of $61 for today.
This will be all for me as I am taking it easy and not pushing/forcing any trades. I will be uploading part 2 to this video once this one is rendered for those interested.

Nvidia Earnings Boost, Trade Tariffs Legitimacy, NQ trade ideaCME_MINI:NQ1!
Big Picture Context: .
NQ futures rallied after NVIDIA posted an earnings beat and after the Manhattan-based Court of International Trade blocked President Trump's Liberation Day tariffs.
Goldman Sachs noted that the ruling on Liberation Day tariffs gives the administration 10 days to halt tariff collection, but does not affect sectoral tariffs. The administration can still impose across-the-board and country-specific tariffs under other legal authorities.
Jobless claims and continuing claims have come in higher.
What has the market done?
The rally faded in the overnight session. However, the catalysts provided energy for prices to move higher. Currently, price is trading above the prior week’s high, yesterday’s high, and it is also trading above the yearly open, and 2025 VPOC and mcVPOC for the last 3 weeks.
What is it trying to do?
The market is negating the recent bear market territory sell-off and negating a bear market rally. It is propelling higher.
How good of a job is it doing?
The market has created good structure and micro composites, despite some gaps left open, and it has created higher lows since last Friday.
What is more likely to happen from here?
Scenario 1: Long Continuation
In this scenario, we are looking for NQ to turn at the immediate 2025 LVN support area. If it edges higher, we will be looking for potential long opportunities above the 21710–21720 area, targeting overnight highs and potentially the next HVN.
Scenario 2: Gap Close and Reversal
In this scenario, we are looking for a pullback, testing pHi and pWk-Hi. We will look for a rounded base that consolidates here on a lower timeframe, such as the 5-minute timeframe, and look for a reversal back towards the 21710–21720 level.
pWk-Hi: prior Week's High
pHi: prior Day's High
HVN: High Volume Node
LNV: Low Volume Node
VPOC: Volume Point of Control
C: Composite (prefix before VAL, VAH, VPOC, VP, AVP)
mC: micro-Composite (prefix before VAL, VAH, VPOC, VP, AVP)

Nasdaq - 1 - 2 Months wavesAS outlined in the graph. Based on the current fib level it doesn't seem like a good enough correction, so I am assuming it could be an extensive correction wave. Great short zone at this moment.
