Short Nasdaq Idea for First Stage Distribution Looking at the Daily Chart lining up with the Higher time Frame Bearish narrative underway, i like the idea of shorting Sunday Opening because there's no more opportunity to get out of long positions here once price has exhausted Premium PD Arrays. And I am highly considering Sunday High to Friday Closing Bell Low. There's lots of Low Resistance Liquidity beneath PA currently, there's no money in the laymans wallet, there's no reason for price to go up EXCEPT for Redistribution/continued Short Selling.
MNQ1! trade ideas

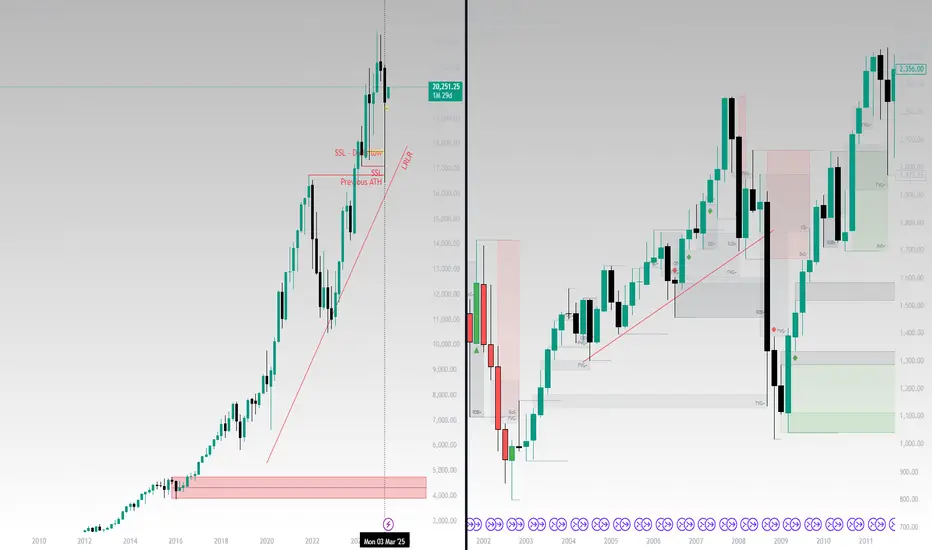
NQ-ES-YM Bearish Long Term Scenario Playing Out VERY BEARISH I think of all the pension funds, all the mortgages, all the war, all the grief and sorrow and depression and inability to find work, there's a whole heap of a mess going on behind the scenes and i hope for the best but expect the worst, and this structure Last Months April Candle is Bearish, and it looks like this Month will be a test of the Distribution Zone and then further down side to the Original Consolidation just like 2008.
It makes a lot of sense to me from the standpoint of not really studying very much but being Intune with the Price Action Analysis, this is a repeating phenomenon in History, the Great Reset, the New Shiny Syndrome, and the classic human behavior to spend more than we have available, over extended and over leveraged individuals will not be readily risk verse,
This Revolving door of money will lead to a bloom of opportunities in a few years, although i see at least 6 months of capitulation to the down side incoming fairly quickly, and i can say this with certainty about one news article i saw recently: US sanctions any country buying Oil from IRAN. Prayers for all, Thank You Jesus, Gods Speed. Amen.
MNQ Sell Idea 5.2.2025Hey Everyone, Welcome back! I am here posting a trade idea we caught, hopefully our final terminus is hit! But in this video I share with you guys my confluences and bias for this trade.
We took out BSL with the 8:30am open and NFP news. I am targetting 19,829 levels as a potential area of interest because I believe the market will want to trade into it for buying opportunities as I do believe the market is bullish.

2 May+1 SD levels and ElastiVolTTension +2
Asia and LND H taken out
RTH+ Above
Looking for entry short on LTF


NQ KEY ICT LEVELS - 2nd MAY 2025Levels marked on the chart using my free indicator which marks out all of the ICT key levels which can be used for potential POIs where price might react

NQ KEY LEVELS - 2nd MAY 2025Key levels marked by using low volume nodes for potential key levels where we may see price react.


NQ Power Range Report with FIB Ext - 5/2/2025 SessionCME_MINI:NQM2025
- PR High: 19797.25
- PR Low: 19749.50
- NZ Spread: 106.75
Key scheduled economic events:
08:30 | Average Hourly Earnings
Nonfarm Payrolls
Unemployment Rate
Advertising rotation short off 20100
- Holding auction inside previous session range
Session Open Stats (As of 12:55 AM 5/2)
- Session Open ATR: 647.21
- Volume: 47K
- Open Int: 250K
- Trend Grade: Bear
- From BA ATH: -11.8% (Rounded)
Key Levels (Rounded - Think of these as ranges)
- Long: 20954
- Mid: 19246
- Short: 16963
Keep in mind this is not speculation or a prediction. Only a report of the Power Range with Fib extensions for target hunting. Do your DD! You determine your risk tolerance. You are fully capable of making your own decisions.
BA: Back Adjusted
BuZ/BeZ: Bull Zone / Bear Zone
NZ: Neutral Zone

Short term Shorts for MNQafter a period of bulls, we have hit an exhaustion point of a 4 hour order block and the 15 min shows a potential double top

Nasdaq Futures (NQ): 5 Swing Pattern Points to Further GainNasdaq Futures (NQ) experienced a sharp selloff following a tariff announcement by President Trump, with the decline starting from a peak on December 16, 2024, at 22,450. The selloff concluded at 16,465.89 on April 7, 2025, which we’ve labeled as wave (II). For the Index to confirm a bullish trend and rule out a potential double correction, it must break above the December 16, 2024, high of 22,450. In the short term, the rally from the April 7 low of 16,465.89 is unfolding as a five-swing pattern. It is a motive sequence that suggests further upside potential.
From the April 7 low, the rally is developing as a five-wave diagonal structure. Wave 1 peaked at 18,361.5, followed by a wave 2 pullback to 16,735. The Index then surged in wave 3 to 19,386.75, with a wave 4 dip ending at 17,700. Currently, wave 5 is in progress, with sub-wave ((i)) topping at 19,688.5 and sub-wave ((ii)) bottoming at 19,103.75. Sub-wave ((iii)) reached 20,125.75, and a potential sub-wave ((iv)) pullback may have concluded at 19,749.5.
The Index is expected to push higher once more in sub-wave ((v)) to complete wave 5 of (1). After this, a wave (2) pullback should occur, likely in a 3, 7, or 11-swing pattern, before the Index resumes its upward trend. As long as the 16,465.89 low holds, dips are expected to attract buyers in 3, 7, or 11-swing patterns, supporting further gains in the near term.

MNQ1!/NQ1! Day Trade Plan for 05/01/2025MNQ1!/NQ1! Day Trade Plan for 05/01/2025
📈 20130 20219
📉 19770 19700
Thanks to all my followers! Truly appreciate the support!
Please like and share for more ES/NQ levels Tues & Thurs 🤓📈📉🎯💰
*These levels are derived from comprehensive backtesting and research and a quantitative system demonstrating high accuracy. This statistical foundation suggests that price movements are likely to exceed initial estimates.*

MNQ1!/NQ1! Day Trade Plan for 04/29/2025MNQ1!/NQ1! Day Trade Plan for 04/29/2025
📈 19560 19685
📉 19185 19060
Thanks to all my followers! Truly appreciate the support!
Please like and share for more ES/NQ levels Tues & Thurs 🤓📈📉🎯💰
*These levels are derived from comprehensive backtesting and research and a quantitative system demonstrating high accuracy. This statistical foundation suggests that price movements are likely to exceed initial estimates.*

2025-05-01 - priceactiontds - daily update - nasdaqGood Evening and I hope you are well.
comment: Way tougher than it looks. Both sides have good arguments why this continues higher or why today marked the top. I have a heavy bearish bias but I confirmation would only be below 19090 and that’s 700 points down. I do think if bears can close the gap down to 19640, we retest 19300 and there we have the first bull trend line. Below we go for 19100, which was the us gdp spike low and below that is armageddon. Bulls have nothing but continuation of this short squeeze. When Apple earnings disappoint, you know things are about to get real ducking bad next.
current market cycle: trading range
key levels: 19000 - 20000
bull case: Bulls got 20000 and even went above the April high, now what? Technically still a lower high until they hit 20537. They have going for them that today was the first bear bar after 7 consecutive bull days. They now want to defend the open gaps to keep the momentum going. A pullback can go way deeper than most bulls will be comfortable with, given the current environment. I do think best bulls can hope for tomorrow, is to go sideways and close the week above 20000.
Invalidation is below 19640.
bear case: Bears have all the macro schmackro arguments on their side that you can try to come up with. Structure says bullish until bull trend lines are broken. First is around 19500 and second is the bigger one around 19000. Can bears get to either tomorrow? I do think so yes. This was a nasty short squeeze but we are right under the weekly 20ema, technically still a lower high because the last major lower high was 20536. On the weekly chart this is a textbook two-legged pullback to the moving average and I pray daily that we will get another huge leg down to 15000. How likely is that? For now, very unlikely. Still it would be more fun if the bull trend line from the covid lows would break and we transition into a trading range 15000 - 22000.
Invalidation is above 20140.
short term: Neutral. For tomorrow I can see 20100 not getting hit again and we sell-off. If markets stays above 19700, bulls remain in full control. full bear mode below 19640. Above 20140 we likely go for 20500+.
medium-long term - Update from 2024-04-20: My most bearish target for 2025 was 17500ish, given in my year-end special. We are +18% from the lows and I do think, once this turns again, it will easily be the short trade of the year.
trade of the day: Longs near 1h 20ema. Was profitable couple of times. Sell-off into close was insider-trading. Absolutely certain that the earnings were leaked.

NQ: 182nd trading session - recapBlew my funded eval - on purpose
I've made some bad decisions a few weeks ago landing me at -$1000 - so I just said f*ck it it's either pay a bit to be breakeven or just be breakeven with a high contract trade.
I'll buy my funded back and start from scratch - with a plan now in mind

What's Next for Tech (April update)My previous analysis on this same chart was obsoleted by the Tariffs announcement on "Liberation Day" - which caused the (tech) market to accelerate the drop down to almost 25% in the week of April 2
SO here's the updated view after "some recovery" from that low. For better visibility, i hid the price (as a faint blue line) so i can focus on the signals that *are really critical to see*.
What are we looking at here ?
==========================
- The thick purple and blue lines are 20 and 50 SMAs - the gray line is a 100 SMA
- this is a weekly chart representing NASDAQ 100 futures as a Tech market proxy
- Lower indicators are a MACD (showing momentum) and RSI (showing strength) - settings for these indicators are sync'ed to the price chart (so the 20/50 crossing will show on MACD as main line crossing zero, RSI is also set to 20 SMA)
What is scary here ?
===================
- we had a 20/50 SMA death cross (20 SMA moving below 50SMA on weekly chart) twice in the last 9 years - we're about to get one this week
- There are 2 main scenarios after a death cross forms, recovery and crash - as seen by the past crosses from December'18 and April'22 (Note: COVID crash didn't cause a death cross)
Why is this specific view important ?
==================================
Our trading plan needs to be adjusted (if crash, go to cash and wait, if recovery, ride the wave up) - for position traders, there's really no gain trading stocks in a market that is breaking down
what's next ?
==============
i'm watching this view to track what the market does next - with how dynamic the situation is with US market / economy, it's hard to tell which scenario will unfold. On one hand, US admin wants to show market improvement, and on the other, certain ill-planned economic "moves" are pulling the market down..
Which scenario do you think will unfold here?

Nasdaq-100 Goes Back to 'PRE-PAIN' 20 000 Level. Series IIApril has gone..
Wow.. Duh..!? ..really? ... or still not!?
Briefly a month ago or so, we have examined at our wonderful @PandorraResearch Team what is 'Revenge Trading', watch our recent 'Educational' idea right here (if you missed one), to learn what sort of lessons we should know about it.
Indeed, it was a really bad story, to purchase in late March 2025 most-hyped so-known Mag Seven stock that came flagships of the recent stock market collapse.
First of all, watch how it's been below (late March 2025) 👇👇
What's happened next just in a week or two since our publications has been made?
⚒ Russell 2000 Index TVC:RUT 95% stocks were: DOWN
⚒ S&P500 Index SP:SPX 96% stocks were: DOWN
⚒ Nasdaq-100 NASDAQ:NDX as well as Dow Jones Industrial Averages DJIA indices: 97% stocks were DOWN
⚒ Magnificent Seven: ALL STOCKS WERE DOWN
Since Nasdaq-100 went back to pre-pain 20'000 Level, lets repeat some lessons.
Revenge trading is DANGEROUS AND HARMFUL pracrice where traders, after suffering a loss, attempt to immediately recoup their losses by making impulsive, emotionally-driven trades. This behavior is widely recognized as one of the major reasons traders lose significant amounts of money and often blow up their accounts.
Why Revenge Trading Is Bad
1. Emotional Decision-Making Replaces Strategy
When traders engage in revenge trading, they abandon their carefully crafted trading strategies and risk management rules. Instead, trades are made based on anger, frustration, or the desire to "get back" at the market. This emotional state clouds judgment, leading to irrational decisions such as increasing position sizes recklessly, disregarding stop-loss orders, or chasing trades without proper analysis. As a result, the likelihood of making successful trades plummets.
2. Escalating Losses and Account Blowups
The urge to recover losses quickly often leads traders to double down or over-leverage their positions, exposing a large portion of their capital to additional risk. Statistically, 80% of revenge trading ends disastrously, with only a small fraction experiencing temporary success before ultimately facing larger losses. This cycle of chasing losses can rapidly erode trading capital, making recovery increasingly difficult.
3. Psychological Burnout and Stress
Revenge trading is mentally and emotionally exhausting. The constant cycle of loss and frantic attempts to recover can lead to stress, depression, and burnout. This further impairs decision-making, creating a vicious cycle of poor performance and deteriorating mental health.
4. Long-Term Damage to Trading Habits
Repeatedly succumbing to revenge trading ingrains bad habits, making it difficult for traders to maintain discipline and consistency in the long run. This lack of consistency undermines the potential for sustainable profitability and can end trading careers prematurely.
Recent Real-World Examples
Recent years have seen numerous cautionary tales illustrating the dangers of revenge trading (all links are from r/wallstreetbets subreddit for learing/ educational purposes only):
$40,000 Lost on NVDA Options (2024). A trader repeatedly doubled down on Nvidia (NVDA) put options during its price rally in mid-2024. Despite initial small wins, the trader, driven by the urge to recover losses, continued to increase his position size, ultimately losing over $40,000.
$26,000 Lost in 20 Minutes on SPX. A Reddit user reported losing $26,000 in about 20 minutes trading the S&P 500 index (SPX) after prices dropped sharply. The loss was the result of impulsive trades made in an attempt to quickly recover from earlier setbacks.
From $27,000 to $0 in Three Days. Another trader turned $500 into $27,000 in just a few days, only to lose it all within 48 hours after a market reversal. Instead of taking profits or stepping back, the trader kept chasing losses with increasingly risky trades, ending up with nothing.
$100,000 Loss on a Yen Carry Trade. A trader, influenced by news of geopolitical tensions, made a large leveraged bet on the yen. After an initial loss, he refused to cut his losses and doubled down, ultimately losing $100,000 instead of accepting a smaller $30,000 hit.
More juicy stories are to be collected...
These stories are not isolated incidents. They are echoed across trading forums and social media, serving as stark warnings of how quickly revenge trading can destroy even substantial gains.
Conclusion
Revenge trading is DANGEROUS AND HARMFUL because it replaces rational, strategic decision-making with emotional reactions, leading to escalating financial losses, psychological distress, and long-term damage to trading discipline. The real-world examples from the past year underscore that no trader-regardless of experience-is immune to its risks. The best defense is to recognize the urge, step away, and return only with a clear, objective mindset and a disciplined strategy.
--
Best wishes,
@PandorraResearch Team 😎

Economic Data Adding VolatilityYesterday, traders saw strong volatility across many different asset classes looking at equities, energy, and precious metals. The equities saw selling pressure early in the session and were able to recover some of the losses on the day, whereas Crude Oil continued pushing lower and was down near 4% on the session. Gold and Silver both slipped as well with Silver leading the selling down near 2.5%.
The economic data today gave traders a lot to digest, with ADP nonfarm employment change, GDP, and Chicago PMI, which all came in lower than expected. Not only did they come in worse than expected, the ADP nonfarm employment and GDP numbers were the lowest levels seen since 2022. Along with this data, traders will be seeing critical jobs and employment figures on Friday and earnings reports from big tech names such as Apple and Amazon, which could all add volatility to the markets as we wrap up the week.
If you have futures in your trading portfolio, you can check out on CME Group data plans available that suit your trading needs tradingview.com/cme/
*CME Group futures are not suitable for all investors and involve the risk of loss. Copyright © 2023 CME Group Inc.
**All examples in this report are hypothetical interpretations of situations and are used for explanation purposes only. The views in this report reflect solely those of the author and not necessarily those of CME Group or its affiliated institutions. This report and the information herein should not be considered investment advice or the results of actual market experience.

Bull market Monthly green candleRecap: 1. Weekly RSI 30
2. Weekly bullish engulfing
3. S&P successfully defended oct 2022 trendline
Now: Monthly hammer candle
Next potential scenario: 20500 level could be the neckline/resistance level for a inverse head and shoulder, coinciding with the 20 weekly SMA as of now.
Next probable scenario: Expecting May monthly candle to be a continuation green candle.
Watch out december 2022 trendline acting as resistance


NQ KEY ICT LEVELS - 1st MAY 2025Levels marked on the chart using my free indicator which marks out all of the ICT key levels which can be used for potential POIs where price might react

NQ KEY LEVELS - 1st MAY 2025Key levels marked by using low volume nodes for potential key levels where we may see price react.
