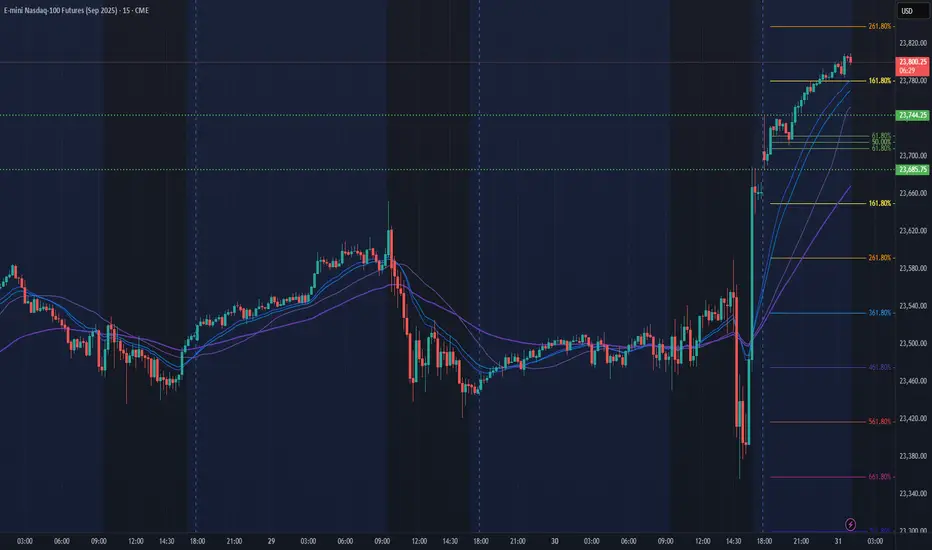
NQ Power Range Report with FIB Ext - 7/31/2025 SessionCME_MINI:NQU2025
- PR High: 23744.25
- PR Low: 23686.00
- NZ Spread: 130.5
Key scheduled economic events:
08:30 | Initial Jobless Claims
- Core PCE Price Index (MoM|YoY)
09:45 | Chicago PMI
New ATHs through Asian hours
Session Open Stats (As of 12:25 AM 7/31)
- Session Open ATR: 244.46
- Volume: 32K
- Open Int: 283K
- Trend Grade: Long
- From BA ATH: -0.6% (Rounded)
Key Levels (Rounded - Think of these as ranges)
- Long: 23811
- Mid: 22096
- Short: 20383
Keep in mind this is not speculation or a prediction. Only a report of the Power Range with Fib extensions for target hunting. Do your DD! You determine your risk tolerance. You are fully capable of making your own decisions.
BA: Back Adjusted
BuZ/BeZ: Bull Zone / Bear Zone
NZ: Neutral Zone
MNQ1! trade ideas
Nq & Es Key levels 30-07 Looking at my previous post regarding flat keys, I am horrified by the accuracy of the reversal and the evolution of price action today...
NASDAQ Long 7.30.25Price had hit a weekly +ob on 7.29.25, and the current day (7.30.25) had not taken the previous day high or low, but looked like it wanted to distribute into the pd wick equilibrium premium level. After 10 AM closed as a bullish candle, signifying higher price, I entered iat 11 AM on the 10 AM candle equilibrium. Price hit the 75% BE and Final TP with 1.28 RR.
Rejection Brewing, is MNQ About to Bleed Below POC? My morning trade wasn't shit but as with any asset price decides no matter the analysis. That said I'm watching MNQ for a potential bearish setup building beneath the Point of Control (23,485.25).
Here’s the game plan:
- Price is hovering just above POC after failing to follow through from the bounce.
- EMA structure is weakening, waiting for a 9/21 EMA bearish crossover below VWAP to confirm momentum shift.
- If we break and reject from POC/VWAP, I’ll be looking for a short opportunity targeting 23,450 → 23,420 (aligned with channel lows and fib levels).
- Give it 30 minutes — Let price confirm the break and structure cleanly before taking the entry.
This entire move would confirm distribution at value and trend continuation into lower range extremes.
If I'm Wrong:
A reclaim and hold above 23,510 with EMAs curling up negates the setup.
Bias:
Bearish Probability: 70%
Waiting on clean confirmation from structure and momentum shift.

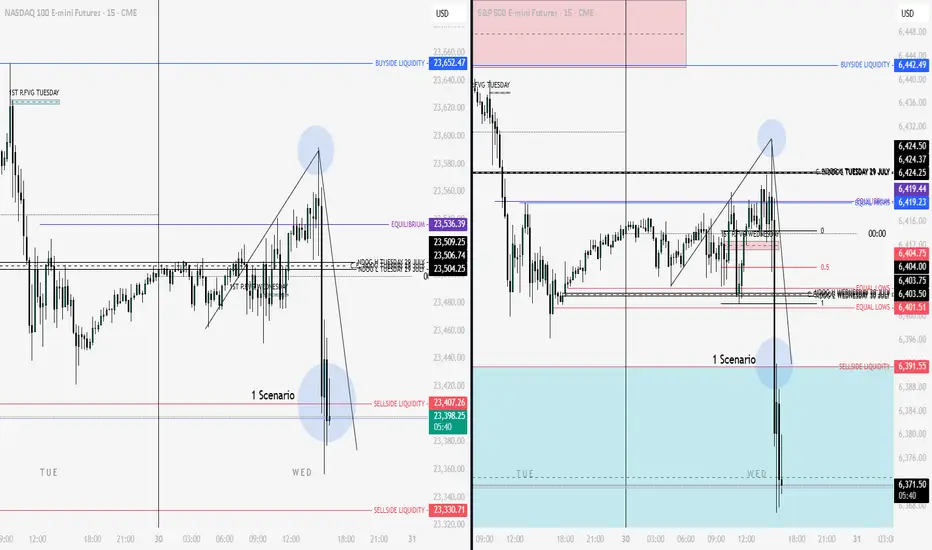
Nq & Es Key Levels 30-07Although a very difficult day for predictions because of FOMC, I believe that these would be the most interesting levels today and these two most likely scenarios...Good and mature trades

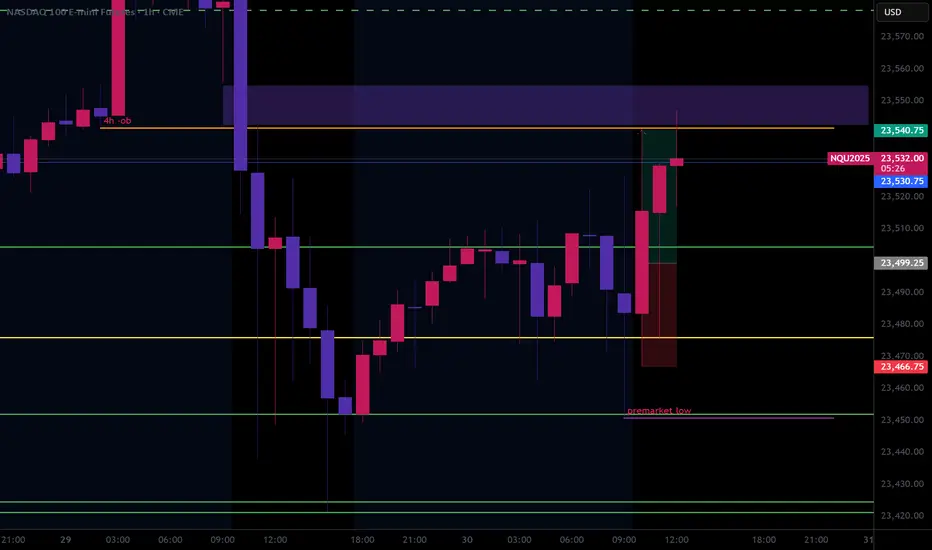
VWAP Rejected, POC Respected, Let the Squeeze BeginMNQ just gave us a cheeky little rejection wick right off VWAP and the POC classic London session move. After flushing into prior structure, price left a long lower wick and a tiny body candle, signaLling seller exhaustion. We're also bouncing right off a trend line that’s held since last week, and the 21/9 EMAs are starting to flatten, hinting at a potential shift.
What makes this even more interesting is how cleanly price tapped the POC (23,486), respected it, and then started grinding back up. That kind of level-to-level respect usually means algo eyes are on it and I'm here for it.
I’m long from 23,491 with a stop just below 23,474, targeting a move into 23,544 for TP1, and possibly 23,652 if momentum carries. It's a structured setup, built off VWAP, POC, Fib mid, and ORB timing. Not a moonshot call just a solid base hit play with clean risk defined.

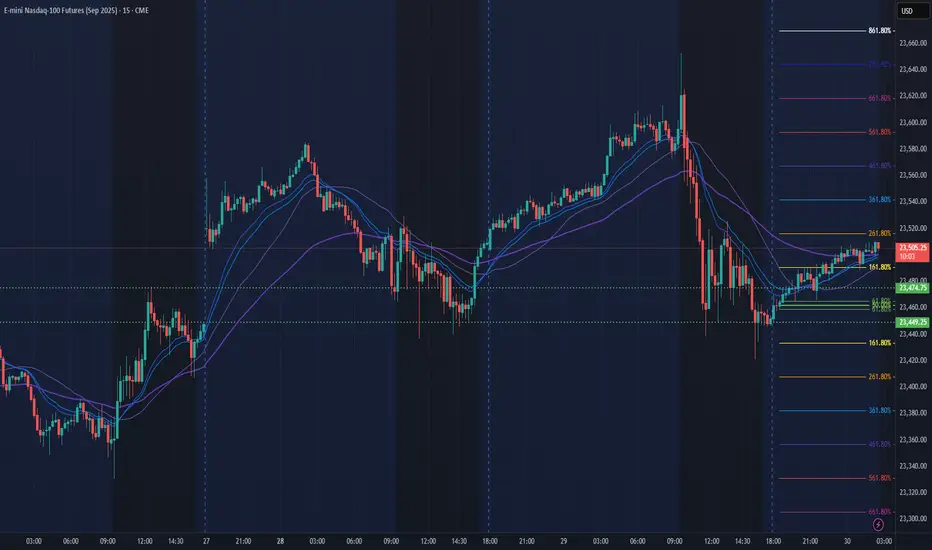
NQ Power Range Report with FIB Ext - 7/30/2025 SessionCME_MINI:NQU2025
- PR High: 23474.75
- PR Low: 23449.25
- NZ Spread: 57.0
Key scheduled economic events:
08:15 | ADP Nonfarm Employment Change
08:30 | GDP
10:30 | Crude Oil Inventories
14:00 | FOMC Statement
- Fed Interest Rate Decision
14:30 | FOMC Press Conference
AMP temp margins increase anticipating vol spike for economic events
Session Open Stats (As of 12:25 AM 7/30)
- Session Open ATR: 232.98
- Volume: 16K
- Open Int: 281K
- Trend Grade: Long
- From BA ATH: -0.6% (Rounded)
Key Levels (Rounded - Think of these as ranges)
- Long: 23811
- Mid: 22096
- Short: 20383
Keep in mind this is not speculation or a prediction. Only a report of the Power Range with Fib extensions for target hunting. Do your DD! You determine your risk tolerance. You are fully capable of making your own decisions.
BA: Back Adjusted
BuZ/BeZ: Bull Zone / Bear Zone
NZ: Neutral Zone
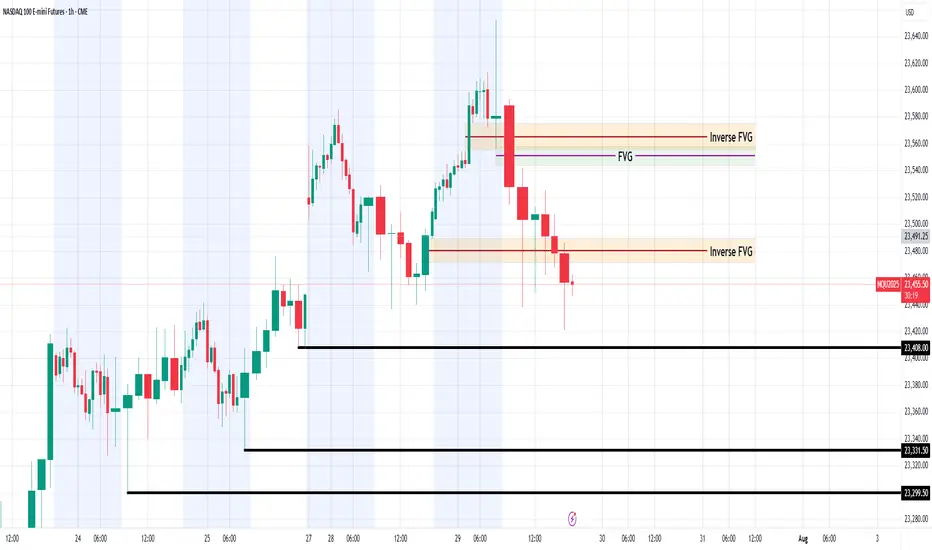
#Nasdaq - #/NQ - #ICT Model AnalysisBased on my analysis, #NQ is likely to raid one of the liquidity lines below before initiating a rally toward one of the FVGs or inverse FVGs above. This move may serve as an accumulation before a potential sell-off begins.
Do your diligence and study more; technical analysis is just the probabilities overview.
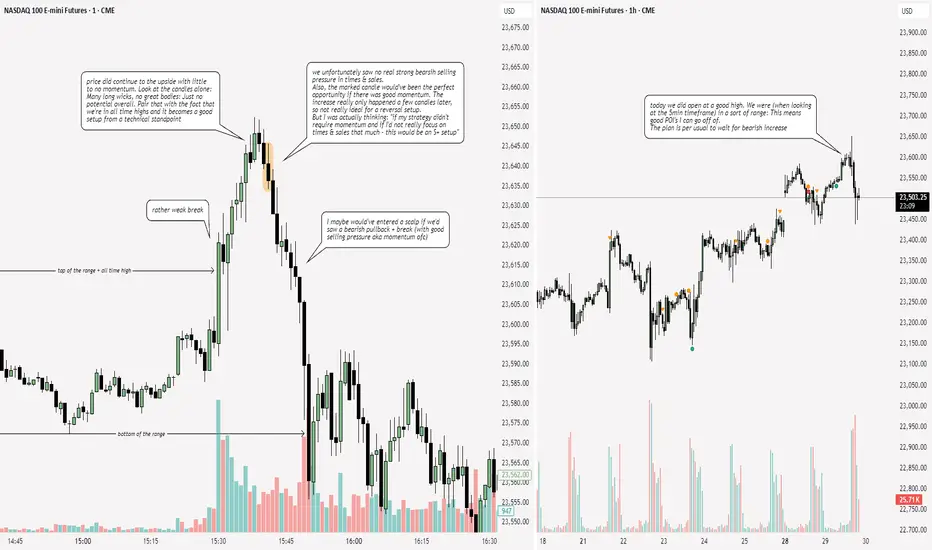
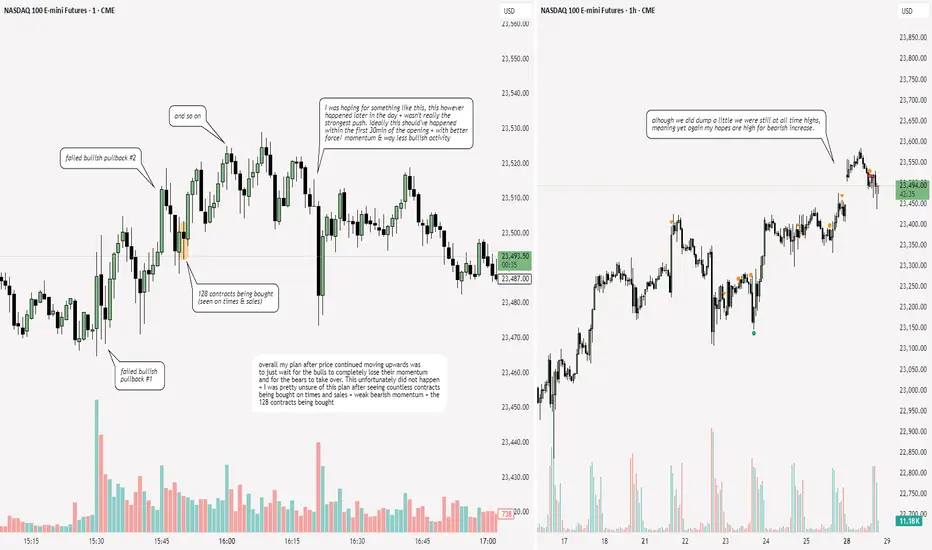
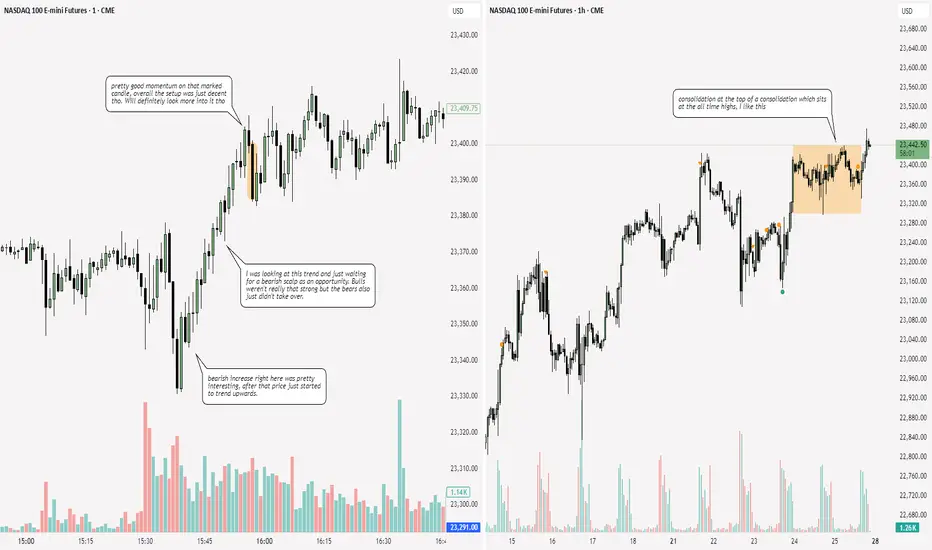
NQ: 226th trading session - recapVery interesting price action today. It was really a setup that I look out for: I call it the "push & pull" situation. It basically means that we get a (bullish) push, we see loss of momentum and then we try to look out for the reversal (=pull). This basically just goes off of market theory and fundamental price action: One side gets really excited and buys/ sells a lot, then after the push happened they lack buyers/ sellers - so then the other side takes over.
It's a bit more complicated that that (+ all the technical factors like all time highs and POI's etc.) but it is a cool setup to look out for.
And obviously, I only look for a bullish push followed by a bearish pull - I only sell short.
NQ & ES Key LevelsExactly as I predicted yesterday...The price was supported at the key levels and moved upwards.
NQ Power Range Report with FIB Ext - 7/29/2025 SessionCME_MINI:NQU2025
- PR High: 23531.00
- PR Low: 23503.00
- NZ Spread: 62.5
Key scheduled economic events:
10:00 | CB Consumer Confidence
- JOLTs Job Openings
Session Open Stats (As of 12:25 AM 7/29)
- Session Open ATR: 233.38
- Volume: 17K
- Open Int: 280K
- Trend Grade: Long
- From BA ATH: -0.2% (Rounded)
Key Levels (Rounded - Think of these as ranges)
- Long: 23811
- Mid: 22096
- Short: 20383
Keep in mind this is not speculation or a prediction. Only a report of the Power Range with Fib extensions for target hunting. Do your DD! You determine your risk tolerance. You are fully capable of making your own decisions.
BA: Back Adjusted
BuZ/BeZ: Bull Zone / Bear Zone
NZ: Neutral Zone
E-mini Nasdaq 100. 28.07.2025, MondayCME_MINI:NQ1!
Explained the daily orderflow on NQ along with possible entries and exits and mistakes stops. Everything outlined in here

NQ: 225th trading session - recapWas definitely more focused today. The plan also was great - just no setup, but that aight since its the focus that really matters rn

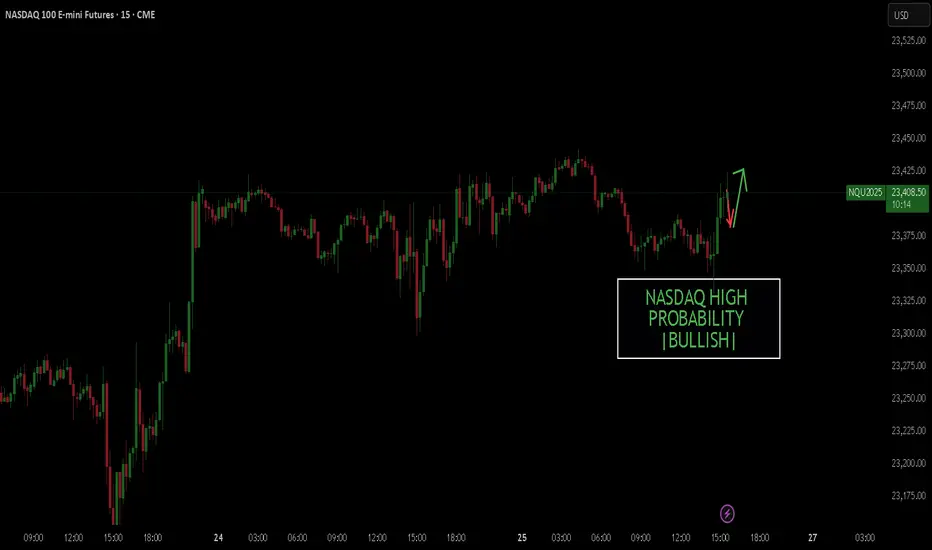
NASDAQ BULLISHHello, I hope you are well today. I just noticed that the Nasdaq could be starting a new bullish trend with an 85% probability.
Tariffs, Trade Deals, & Central Bank Watch: Key Week in MarketsCME_MINI:NQ1! CME_MINI:ES1! CME_MINI:MNQ1! COMEX:GC1! CME_MINI:MES1! NYMEX:CL1!
This is a significant week in terms of macroeconomic headlines, key data releases, central bank decisions, and major trade policy developments. We get numbers for growth, inflation and decision and insights into monetary policy. Combining this with ongoing trade policy developments, we have a key week which may shape how the rest of the year unfolds.
Below is a consolidated summary of the latest trade negotiations, scheduled economic releases, and policy outlooks.
US - EU Trade Deal:
• US–EU Tariffs: The US will impose a 15% tariff on most EU goods, including cars, semiconductors, and pharmaceuticals, but retain a 50% tariff on steel and aluminium with a new quota system.
• Exemptions: Zero-for-zero tariffs agreed for agriculture, aircraft parts, and chemicals; aircraft exports are temporarily exempt.
• EU Commitments: The EU will invest $600 billion in the US and purchase $750 billion in US energy, mainly LNG.
• Agriculture: The EU will lower tariffs on many US agricultural goods, though not comprehensively.
• Political Reactions: EU leaders are mixed, Germany and the Netherlands praised the deal, France called it unbalanced, and Hungary viewed it unfavorably.
• The deal is not final until it is ratified by all EU national parliaments and the EU Parliament.
China Talks: US and China expected to extend their trade truce by 90 days. US-China meeting expected in Stockholm on Monday and Tuesday. Trump to freeze export controls to secure a deal. A group of US executives will visit China for trade discussions, organized by the US-China Business Council.
South Korea Trade Talks: Korea proposes a shipbuilding partnership with the US and is preparing a trade package.
UK–US Relations: PM Starmer and Trump to meet in Scotland to discuss the UK–US trade deal implementation, Middle East ceasefire, and pressure on Russia.
Thus far, the US has announced trade deals with the UK, Vietnam, Philippines, Indonesia, Japan and The EU. Trade delegations are working to finalize deals with China, Mexico, Canada
Key Economic Data Releases:
Monday: Treasury refunding financing estimates.
Supply: 2-Year and 5-Year Note Auction, 3 & 6-Month Bill Auction
Tuesday: US Advance Goods Trade Balance, Wholesale Inventories Advance, CB Consumer Confidence, JOLTS Job Opening (Jun), Atlanta Fed GDPNow, Australian CPI Q2
Supply: 7-Year Note Auction
Wednesday: German GDP Q2, EUR GDP Q2, US ADP Non-farm Employment, US GDP Q2, Crude Oil Inventories, Chinese Manufacturing PMI
Canada: BoC Interest Rate Decision, Rate Statement, Monterey Policy Report, BoC Press Conference
US: Fed Interest Rate Decision,FOMC Statement, Fed Press Conference.
Japan: BoJ Interest Rate Decision, Monetary Policy Statement
Thursday: EU Unemployment (Jun), US PCE & Core PCE Price Index (Jun)
Japan: BoJ Press Conference
Friday: EU CPI, US NFP, Unemployment Rate, Average Hourly Earnings, ISM Manufacturing PMI, Michigan 1-Year & 5-Year Inflation Expectations.
It is also a busy earnings week. See here for a complete earnings schedule .
Markets are interpreting trade deals as positive news thus far. The dollar is strengthening.
As we previously mentioned, we anticipate no rate cuts this year as economic data proves to be resilient and inflation largely under control. WSJ also posted an article stating that most tariffs costs are being absorbed by companies due to weaker pricing power. We previously wrote about this on our blog: “ In our analysis, the inflation impact of tariffs may not show up until Q4 2025 or early 2026, as tariff threats are mostly used as a lever to negotiate deals. While effective tariff rates have increased, as Trump reshapes how tariffs are viewed, cost pass-through to consumers will be limited in Q3 2025, as companies’ front-loaded inventory helps mitigate the risks of increased tariff exposure.
So, what we have is an interesting development shaping up where, while inflation may rise and remain sticky, it is yet to be seen whether slowing consumer spending will weaken enough to the point where companies must start offering discounts, which would nullify the tariff risk to the end consumer and result in companies absorbing all tariffs. This scenario will see reduced earnings margins leading into the last quarter and early 2026. However, it will materially reduce risks of higher inflation.”
In our view, the US dollar has a higher probability to rally in the short-term i.e., Q3 as markets re-align FX rate differentials. Bond yields stabilize, Equities continue pushing higher, while Gold retraces as previously mentioned. This in our view, is what investors and participants refer to as the Goldilocks scenario. If this plays out as expected we anticipate continued strength with AI, tech, energy and defense sectors outperforming into mid- 2026.
Institutional View: Morgan Stanley
Morgan Stanley also sees no rate cuts in 2025, despite market pricing for two 25 bps cuts. They forecast more aggressive cuts in 2026 due to:
• Tariff-related inflation emerging before labor market deterioration
• Slowing US growth, as fiscal support fades
• Impact of tighter immigration policy and global trade realignment
That said, MS continues to cite longer-term risks to the dollar, including:
• Twin deficits (fiscal + current account)
• Ongoing debate around USD’s safe haven status
• USD hedging activity picking up by international investors
• Strained credibility of the Fed due to tension between Fed Chair and the US Administration
How Fed policy evolves in Q4 2025 and Q1 2026 will depend heavily on the incoming Fed Chair nominee, who is expected to replace Jerome Powell in May 2026. This nomination could significantly influence future policy direction around growth and inflation targets.

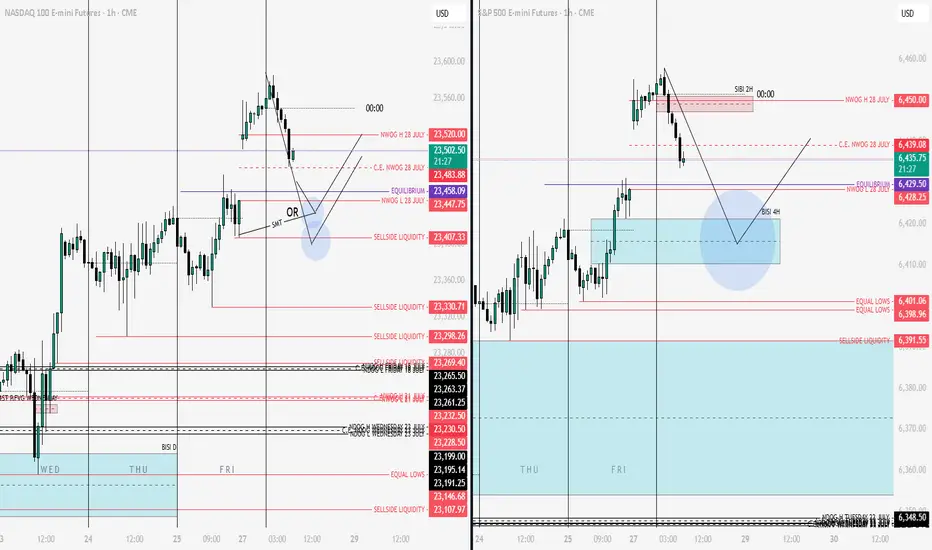
NQ & ES Key Levels 28-07As long as the price is above the purple line (Equilibrium) I am bearish... Below the purple line there are these key levels where the price can react aggressively and start to rise, seeing a reversal. It will either rise to a point and continue to fall or it will start a rally to the ΑΤΗ.
NQ LONGSeems like this mornings run might be a bit exaggerated. Looking for a healthy pullback stop go long.

NQ Power Range Report with FIB Ext - 7/28/2025 SessionCME_MINI:NQU2025
- PR High: 23558.25
- PR Low: 23504.00
- NZ Spread: 121.25
No key scheduled economic events
Weekend gap up of 0.37% into new ATH
Session Open Stats (As of 12:25 AM 7/28)
- Session Open ATR: 245.44
- Volume: 23K
- Open Int: 276K
- Trend Grade: Long
- From BA ATH: -0.0% (Rounded)
Key Levels (Rounded - Think of these as ranges)
- Long: 23811
- Mid: 22096
- Short: 20383
Keep in mind this is not speculation or a prediction. Only a report of the Power Range with Fib extensions for target hunting. Do your DD! You determine your risk tolerance. You are fully capable of making your own decisions.
BA: Back Adjusted
BuZ/BeZ: Bull Zone / Bear Zone
NZ: Neutral Zone
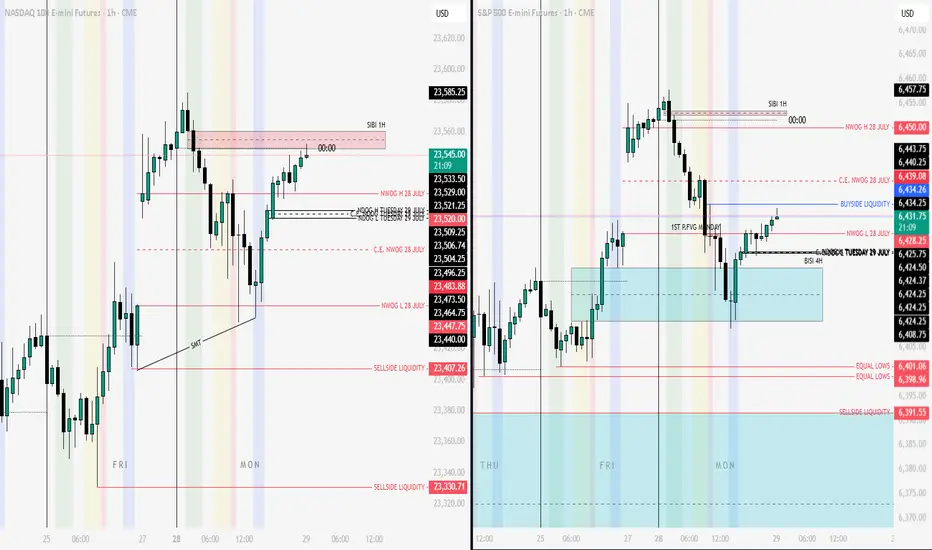
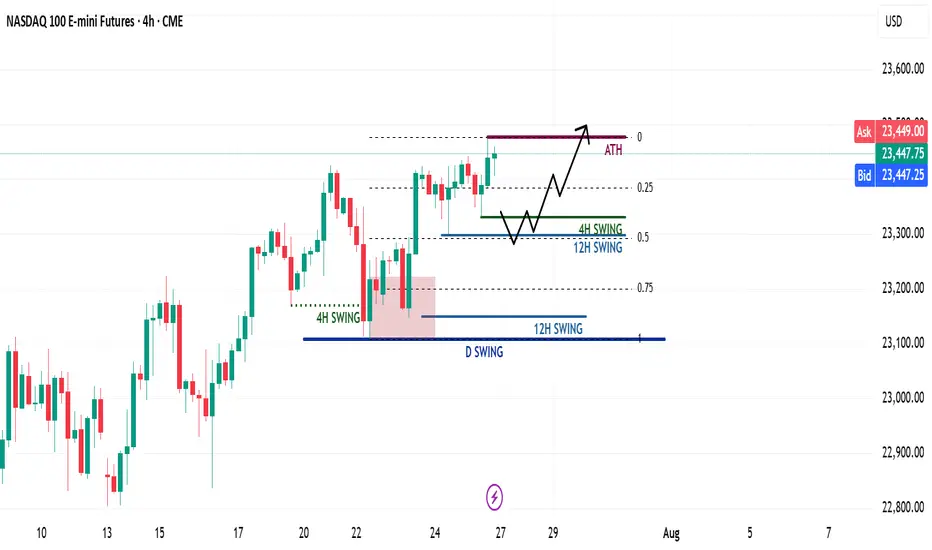
NQ Weekly Recap & Gameplan – 27.07.2025🧭 Market Sentiment
The overall sentiment remains bullish, supported by:
• Lower inflation data
• Trump’s policy shift toward aggressive rate cuts
This creates a strong risk-on environment across U.S. indices.
🔙 Previous Week Recap
• NQ continued its price discovery phase
• Price swept 4H swing liquidity and triggered a market structure shift
• A new 1H demand zone was formed after MSS
• Price revisited the 1H demand and launched toward new all-time highs (ATH)
• While I anticipated a deeper retracement, ES provided the cleaner pullback
• I executed longs on both ES and NQ using SMT divergence (ICT SMT concept)
📊 Technical Analysis
My bias remains bullish as long as the higher timeframe structure holds.
For the upcoming week:
• Watching for either the 4H or 12H swing high to get swept
• Ideally, a retracement toward the 0.5 Fib level, which aligns with my bullish discount zone
• A clean liquidity sweep into this zone could act as a launchpad for the next leg higher
⚙️ Trade Setup & Execution Plan
Entry Strategy:
• Wait for a new 1H–4H Market Structure Shift
• Identify the new demand zone post-MSS
• Look for price to return to the zone for a long opportunity with LTF confirmation
Trade Management:
🎯 Target: New ATH
⛔ Stoploss: Swing low of the 1H–4H demand zone
📌 Chart will include Fib levels, MSS zones, and execution trigger areas.
Let me know your thoughts or share your plan below.
Happy trading!
NQ: 224th trading session - recapWasn't too focused today which is definitely not good. Atleast there wasn't any big setup today. But still, shouldn't happen
NQ potential short setupGlobex High Sweep Setup : Price tagged the overnight high. Liquidity hunt likely before rejection.
Double Top Reversal : Classic short trigger with weakening momentum.
CVD and price: Price and CVD making higher highs — bullish pressure?
STRAT 3-1-2 Setup : Breakout above internal bar range could flip bias long.
Update after posting the chart: As this is a contrarian trade, please wait for short entry confirmation. The market is quite bullish, and a move down might be quite bumpy, with expected stop runs. Market has already run past the double top with huge bullish movement. The market has already run past the double top with a bullish moment.
The next point of reversal could be at the daily pivot R1 at 23,435.25.

