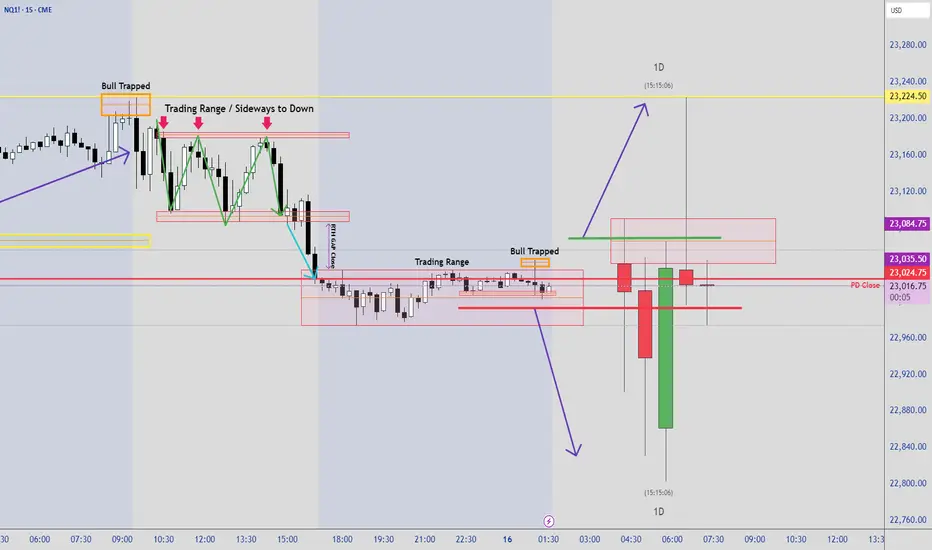
2nd Leg Down Likely on the DailyNews impact yesterday pushes the market higher only to reverse throughout the day. A retest of swing low is expected for a bearish continuation. With another news coming, perhaps a minor pullback then chop and drop.
MNQ1! trade ideas
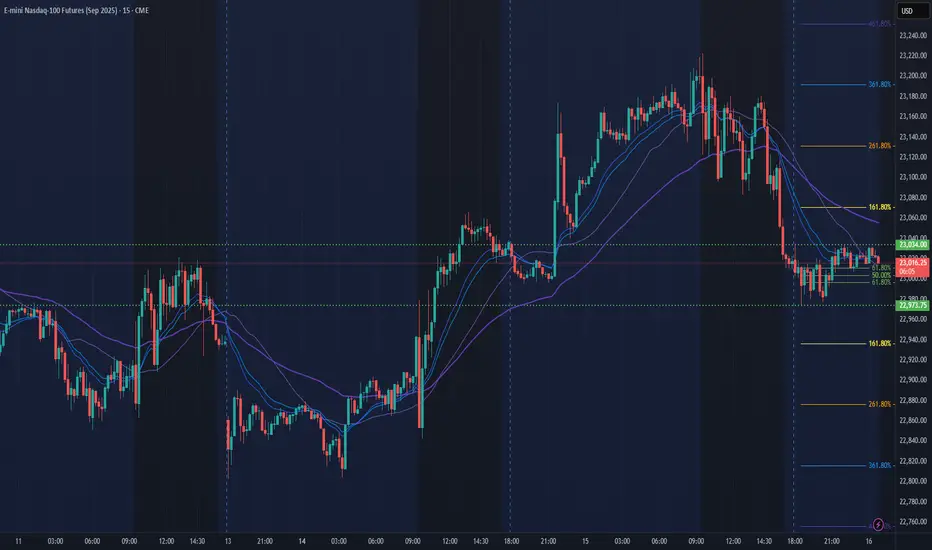
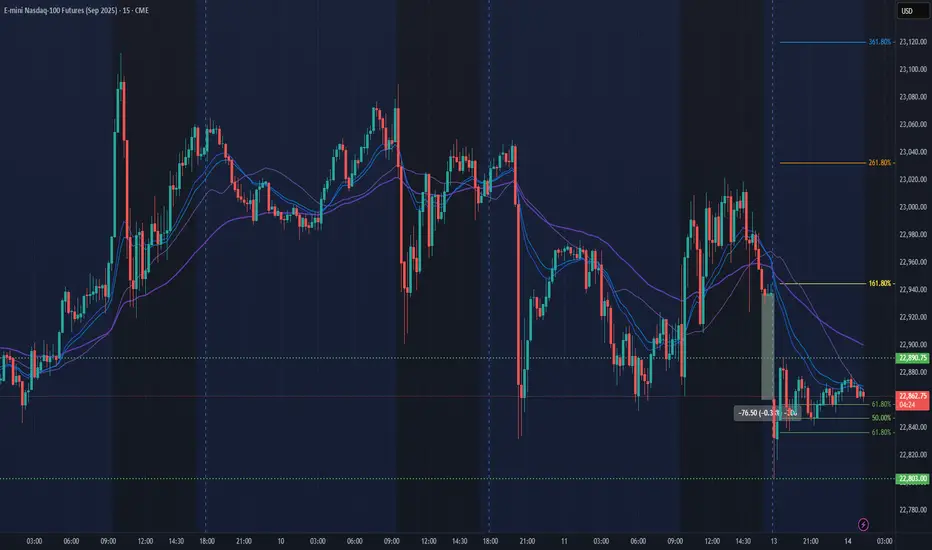
NQ Power Range Report with FIB Ext - 7/16/2025 SessionCME_MINI:NQU2025
- PR High: 23034.25
- PR Low: 22973.75
- NZ Spread: 135.5
Key scheduled economic events:
08:30 | PPI
10:30 | Crude Oil Inventories
AMP margins raised overnight for expected PPI volatility
Session Open Stats (As of 12:25 AM 7/16)
- Session Open ATR: 277.22
- Volume: 27K
- Open Int: 277K
- Trend Grade: Neutral
- From BA ATH: -0.8% (Rounded)
Key Levels (Rounded - Think of these as ranges)
- Long: 23239
- Mid: 21525
- Short: 20383
Keep in mind this is not speculation or a prediction. Only a report of the Power Range with Fib extensions for target hunting. Do your DD! You determine your risk tolerance. You are fully capable of making your own decisions.
BA: Back Adjusted
BuZ/BeZ: Bull Zone / Bear Zone
NZ: Neutral Zone
DIYWallSt Trade Journal: Perfect Morning Signals & Rate Cut bets07/15/25 Trade Journal, and ES_F Stock Market analysis
EOD accountability report: +404.50
Sleep: 7 hours
Overall health: Good
VX Algo System Signals from (9:30am to 2pm)
— 8:41 AM Market Structure flipped bullish on VX Algo X3!
— 9:33 AM VXAlgo ES X1 Sell Signal (triple sell)
— 9:40 AM Market Structure flipped bearish on VX Algo X3!
— 1:20 PM VXAlgo ES X1 Buy signal (triple buy)
What’s are some news or takeaway from today? and What major news or event impacted the market today?
We got great signals at the start of the day and that really helped with today's trading. I had some meetings today and stufff to take care of so i decided to lock out the funded account around noon and called a day.
News
— 9:54 AM
*TRADERS STICK TO BETS ON SEPTEMBER FED RATE CUT AFTER INFLATION REPORT
What are the critical support levels to watch?
--> Above 6295= Bullish, Under 6285= Bearish
Video Recaps -->https://www.tradingview.com/u/WallSt007/#published-charts

NQ Short (07-14-25)The NAZ appears to be due for a Drop Test back inside the lower range. F-M Long play and O/N lift moves seem to be loosing their effectiveness. Looking for a 22,300-200 target on drop and if not, look for U Turn under 23,300.

NASDAQ BEARISHHello, with my skills and my analysis I see that the Nasdaq market has a good chance of falling.
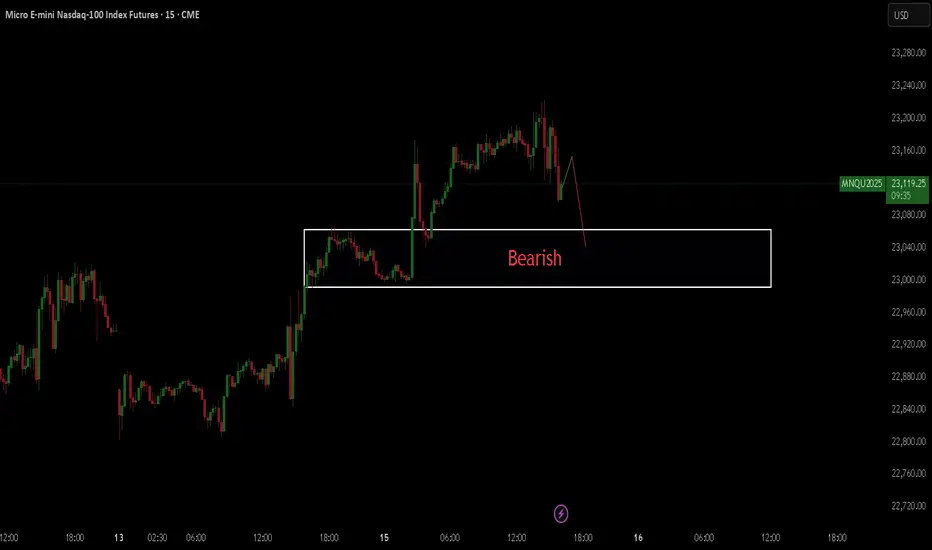
$NQ Supply and Demand Zones 7/15/25This for sharing my S/D zones for SEED_ALEXDRAYM_SHORTINTEREST2:NQ specifically.
Daily Market Outlook. 16.07.2025, CPI dayGold Short and NQ order flow explained. Along with the Dollar Index

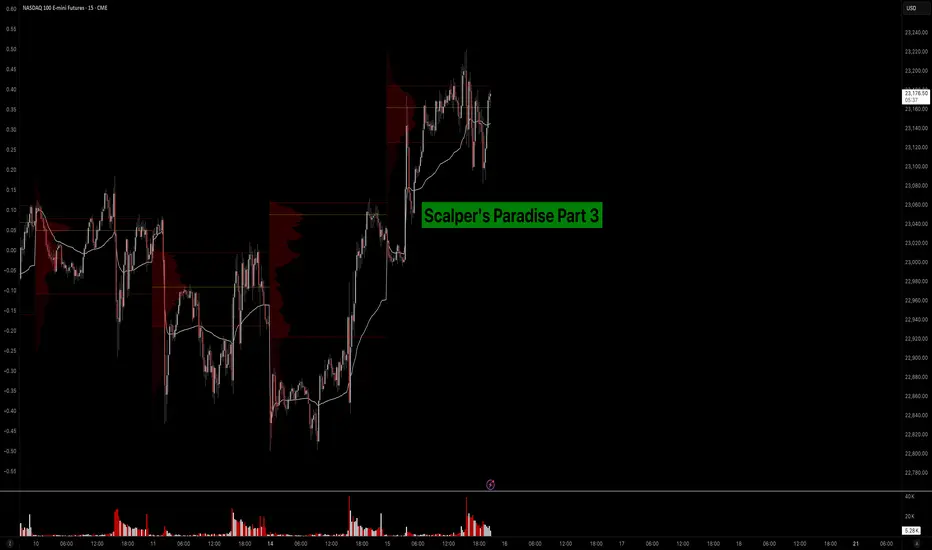
Scalper’s Paradise Part 3 – The Power of Order Flow and DOMWelcome back to Scalper’s Paradise! In this third part of the series, I want to take you into one of the most powerful tools in professional trading: Order Flow and the Depth of Market (DOM).
I chose this topic because during my time as an institutional trader, this was our entire world. We didn’t use indicators. We didn’t guess. We traded exclusively based on what we could see happening live in the DOM and Time & Sales. Every decision was made tick by tick, based on real market activity.
That experience shaped the way I view markets forever—and today, I want to share that perspective with you.
What Is Order Flow, Really?
To me, Order Flow is the most honest information the market can give you. It doesn’t predict, it reveals. It shows who is actually making moves right now. When I was sitting at my institutional desk, I didn’t look at moving averages or oscillators. I looked at who was being aggressive: were market buyers lifting offers, or were sellers smashing the bid?
Watching the tape (Time & Sales) and the footprint chart was like watching a fight unfold in real time. No filters, no guesses. Just raw interaction between buyers and sellers. That’s where real decisions are made.
The DOM: My Daily Reality as a Trader
The DOM (Depth of Market) was the first thing I looked at every morning, and the last thing I closed at night. It shows all visible limit orders resting at each price level. But there’s a catch: not everything you see is real.
In the institution, we were trained to spot real interest versus manipulation. Stacked bids might look strong, but if they disappear the moment price drops tells you that there was never a true intent. Iceberg orders were more interesting, when price gets hit again and again and doesn’t move, that usually meant someone was absorbing quietly.
Reading the DOM is like reading an X-ray of the market’s intentions. And yes, there’s a lot of noise, a lot of deception. But once you learn to read through it, it’s the most powerful tool you’ll ever have.
How We Used Order Flow on the Institutional Side
At the institution, we never chased price. That was rule number one. We let the market come to us (meaning: we used Limit Orders as often as possible) and we used Order Flow to guide every decision.
One of the most important concepts was absorption . If we needed to build a large long position, we didn’t just slam the ask. We would let sellers come in and hit our bids again and again and again. If price didn’t break lower, that told us we were in control.
On the flip side, when we needed to move the market , we switched gears. We used market orders aggressively to push through key levels, forcing reactions, triggering stops, and creating follow-through.
And yes, there were times when we intentionally created traps . We’d push price into obvious zones, make it look like a breakout, then fade it, because we knew how the market reacts afterwards. Order Flow was the only way to read those games in real time.
How You Can Use This as a Retail Trader
I know what you might be thinking: “I’m just a retail trader, how can I possibly use tools like Order Flow or DOM the way institutions do?”
The good news is: you don’t have to compete with institutions, you just need to read their intentions.
Here’s how I would approach it today:
1) Open a footprint chart and look for imbalances, areas where one side is clearly more aggressive. Watch for absorption or sudden volume spikes.
2) Watch the Time & Sales feed. Is there a flurry of trades hitting the ask, but price isn’t moving? That’s someone selling into strength.
3) Use the DOM around key areas like VWAP, previous day high/low, or liquidity clusters. Are orders getting pulled? Is size appearing suddenly? These are all signals.
You don’t need to be early. Let the big player act first, then confirm what you’re seeing across Order Flow and DOM. When everything aligns, that’s your edge.
Bringing It All Together
In Part 1, I shared how we used VWAP and Volume Profile as benchmarks to evaluate execution quality. In Part 2, I showed you how I identify institutional activity using raw volume and 10-second charts. And now, in Part 3, you’ve seen the real-time decision-making tools: Order Flow and DOM.
These aren’t indicators. They’re not theories. They’re the actual battlefield where institutions operate and where I learned to trade.
My goal with this series has always been simple: to give you access to the same mindset I used at the institutional level, but through a lens that makes sense for your reality as a retail trader.
Don’t try to outsmart the market. Observe it. Align with the big players. Let their behavior guide your decisions.
That’s how I learned to trade professionally—and it’s exactly how you can start thinking and acting like a pro, even without the size.
Part 1:
Part 2:
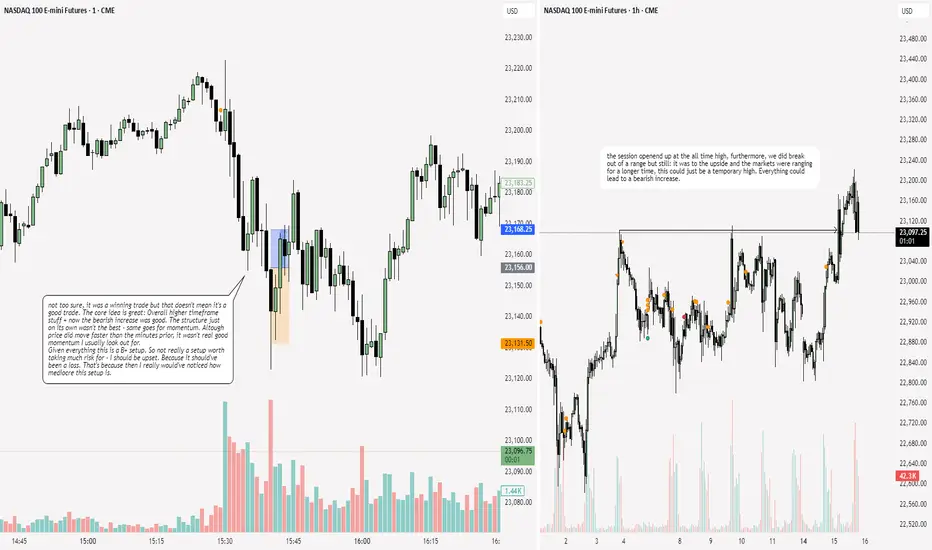
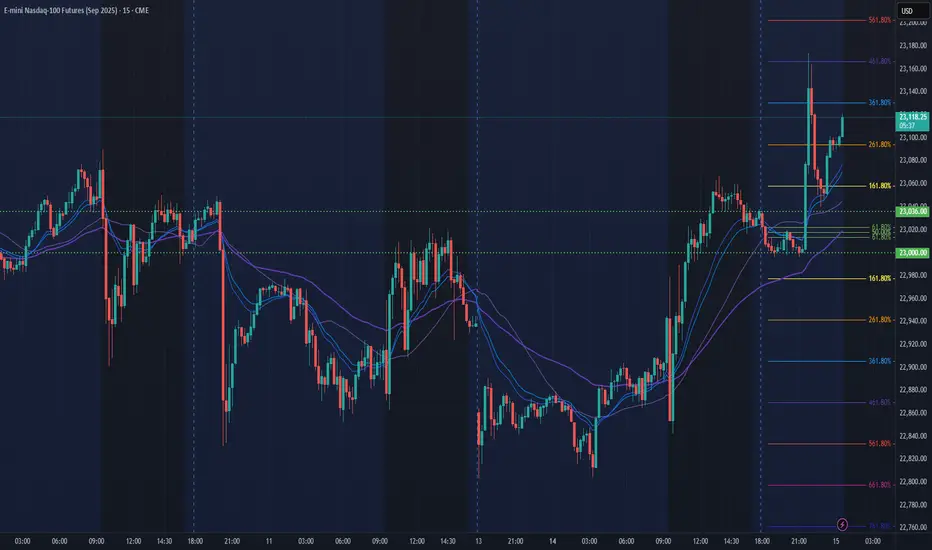
NQ: 218th trading session - recapYeaaa although I did make $2,000 profits it wasn't the best thing ever. I mean I gotta cut myself some slack: The higher timeframe bias was pretty good. And the structure wasn't too shabby. It really was the momentum that turned an A+/S tier setup into a B+ setup which is a HUGE jump.
MNQ LongDont have the time to explain much on what is going on for this chart.
I think there is a good chance for a long position, but we will see

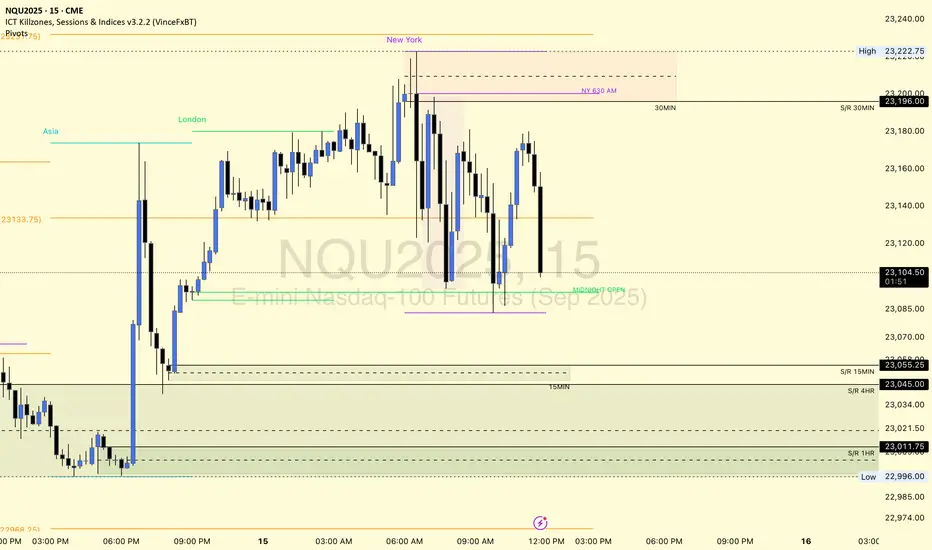
H2 or High 2H2 or High 2 from Al Brooks teachings is an Entry Point. With the news coming , will this continue to trend upwards until the news ??
Eyes on the Gap – Discipline Over FOMO NQ📌 Waiting for High-Probability Levels to Engage
Right now, price has been stuck in a multi-week range, coiling just beneath major resistance and above strong demand. I’m not forcing trades — I’m waiting for price to reach the key gap zone and confirmed strong support near 22,781.75.
No reason to act until the market gives me a clear setup.
The real move will come from the edges — not the middle.
🔹 Support Confluence: Gap fill zone + Strong Support label
🔹 Range Context: Price capped under ATH & recycling between session highs/lows
🔹 Bias: Bullish only after sweep or confirmed hold of the lower zone
💬 Discipline is waiting when others get chopped up in the middle. Let the trap spring — then strike.
#PlaymakerTrading #GapZone #SmartMoneyLevels #NQFutures #MarketStructure #SupportAndResistance

NQ Power Range Report with FIB Ext - 7/15/2025 SessionCME_MINI:NQU2025
- PR High: 23036.00
- PR Low: 23000.00
- NZ Spread: 80.5
Key scheduled economic events:
08:30 | CPI (Core|MoM|YoY)
Asian hours vol spike breakout swing into new ATHs
Session Open Stats (As of 12:15 AM 7/15)
- Session Open ATR: 290.39
- Volume: 42K
- Open Int: 276K
- Trend Grade: Neutral
- From BA ATH: -0.3% (Rounded)
Key Levels (Rounded - Think of these as ranges)
- Long: 23239
- Mid: 21525
- Short: 20383
Keep in mind this is not speculation or a prediction. Only a report of the Power Range with Fib extensions for target hunting. Do your DD! You determine your risk tolerance. You are fully capable of making your own decisions.
BA: Back Adjusted
BuZ/BeZ: Bull Zone / Bear Zone
NZ: Neutral Zone
Market Watch UPDATES! Stock Indices, Gold, Silver, US OILWelcome to the Market Watch Updates for Monday, July 14th.
In this video, we will give the forecast updates for the following markets:
S&P500, NASDAQ, DOW JONES, GOLD, SILVER and US OIL.
Enjoy!
May profits be upon you.
Leave any questions or comments in the comment section.
I appreciate any feedback from my viewers!
Like and/or subscribe if you want more accurate analysis.
Thank you so much!
Disclaimer:
I do not provide personal investment advice and I am not a qualified licensed investment advisor.
All information found here, including any ideas, opinions, views, predictions, forecasts, commentaries, suggestions, expressed or implied herein, are for informational, entertainment or educational purposes only and should not be construed as personal investment advice. While the information provided is believed to be accurate, it may include errors or inaccuracies.
I will not and cannot be held liable for any actions you take as a result of anything you read here.
Conduct your own due diligence, or consult a licensed financial advisor or broker before making any and all investment decisions. Any investments, trades, speculations, or decisions made on the basis of any information found on this channel, expressed or implied herein, are committed at your own risk, financial or otherwise.

MNQ at the Supply Buffet. Will It Eat or SpitMNQ is hovering just under local highs after a textbook rally into a potential supply shelf. Price is compressing into a wedge between short-term resistance and dynamic trend line support. This is where the market reveals its hand either we break clean and run, or we roll over and unwind the entire move.
Here’s my full breakdown including swing entries, scalp options, confluence layers, and what I’m watching through the Tokyo, London, and NY sessions.
Primary trend: Bullish
Current condition: Compression under resistance (23,100 zone)
Market posture: Still within the ascending channel, but showing signs of indecision
We’re stacked on top of well-respected demand levels and riding a well-tested trend line. But price has now spent 5 sessions ranging just under short-term supply, and that opens up both breakout and breakdown scenarios depending on how it reacts in this key zone.
BULLISH SCENARIO — Trend Continuation
This play assumes the channel holds and buyers defend the 22,700 breaker block.
Primary Entry: 22,700 (Key reclaim level / breaker block)
Aggressive Entry: 22,950 (early reaction from structure front-run)
TP1: 23,500 (equal highs and channel extension)
TP2: 24,000 (clean trend extension target)
SL: 22,000 (below trend line and deep value failure)
Confluences:
Breaker block support from July 3 demand leg
Anchored VWAP from July 7 sits just above entry zone
Perfect alignment with channel midpoint and dynamic support
Buyers defended 22,700 multiple times during NY and London sessions
Macro still favouring tech risk-on
This is the continuation play. If 22,700 holds, I expect a swift push through supply with high reward potential.
BEARISH SCENARIO — Structural Breakdown
This play assumes the trend line and 22,700 level give way, confirming a change in structure.
Trigger: Clean 15m or 30m close below 22,700 and no buyer reclaim
Entry on Retest: 22,680–22,700 zone after breakdown
TP1: 22,200 (mid-trend demand base)
TP2: 21,900 (deep value demand zone)
SL: Above 22,800 (back inside structure = idea invalid)
Confluences:
Overhead supply has held 4+ sessions
Multiple liquidity sweeps above 23,100 with no follow-through
Momentum divergence + distribution signs on 5m-15m
London session often traps longs just before breakdowns
This isn’t about calling tops it’s about recognising when support fails. If 22,700 goes, the dominoes start falling.
Scalper Setup (Tokyo/London Focus)
For intraday traders hunting reactive entries with tight stops.
Short Idea:
Setup: Price sweeps into 23,090–23,130 zone during low liquidity (Tokyo/London premarket)
Trigger: Rejection wick or bearish engulfing on 5m–15m
TP: 22,950 or 22,700
SL: 23,150
Long Idea:
Setup: Quick drop into 22,950–22,900 front-run zone (pre-NY)
Trigger: Bullish engulfing or delta flip
TP: 23,100–23,200
SL: 22,850
Chart Structure Summary:
23,090–23,130 Short-Term Supply, Resistance shelf, range ceiling
22,700–22,750 Breaker Block Key structure to hold for bulls
22,200–22,400 Mid Demand Base, Trend structure, good R/R long
21,900–22,050 Deep Value Demand, Swing long zone, last line for bulls
Strategy Notes:
Use 15m for structure, 5m for entry, and 1H to confirm trend
Volume delta and order flow helps confirm traps/sweeps
Watch VWAP if price holds above, bias remains up
Don’t trade blindly into supply without confirmation let it reject or break
This isn’t just a supply test it’s a decision point for the next 300+ ticks.
The market is either:
Absorbing above demand and about to explode, or slowly distributing before a trend break.
As always don’t marry a bias. Let the levels do the talking. React, don’t predict. Let me know in the comments how you’re planning to play this.

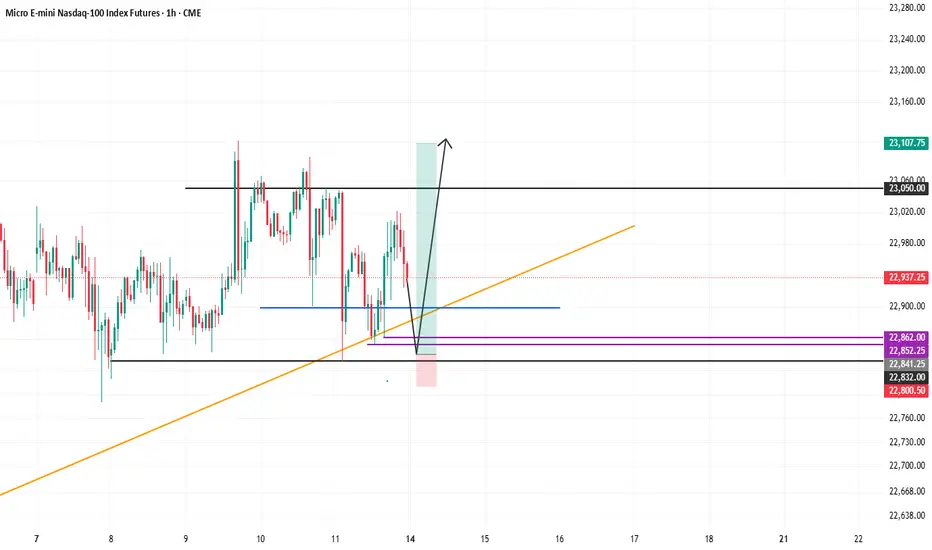
MNQ LONGHere we go again with confusing charts.
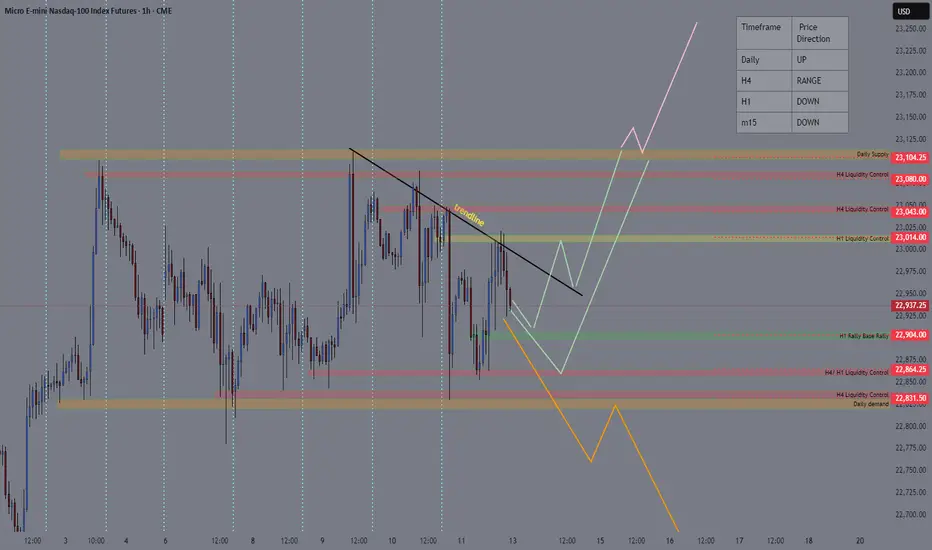
So to begin with, iam bullish until the orange trendline is broken, if its not broken and the price is still reacting positively to it as its doing so far, then iam very much bullish.
Also you should be aware that there is divergence started to show up on the daily and it looks massive on the 4h tf, also price swept last high and moved lower, even though the trend is still intact, it still shows some weakness.
my confidence in this setup is 7 out of 10
Since the price action is bearish for now, then if you want you can take some short until 22840, then go long from here.
2025-07-14 - priceactiontds - daily update - nasdaqGood Evening and I hope you are well.
nasdaq e-mini futures
comment:
The biggest surprise for next week would be a huge gap down Sunday futures open and having that gap stay open. If bears could actually do something like that and trap all bulls who bought above 22600, that would be amazing.
Spoiler: Bears could not. Another gap down and bear trap. It’s sad but the reality. Don’t expect strong bears all of the sudden.
current market cycle: bull trend
key levels: 22000 - 23100
bull case: Bulls defended 22800 which is still as bullish as it gets. Don’t make it more complicated than it is. We are going sideways under the ath, can print a new one any given day. Since I don’t have any targets above 23100ish, I won’t make stuff up here. I only wait for the profit taking to begin to look for shorts.
Invalidation is below 22700.
bear case: Bears are sad. Need a daily close below 22700. If they prevent bulls from printing a new ath above 23111, I would be surprised. No need to write more here until we see much much bigger selling pressure.
Invalidation is above 23500.
short term: Neutral. Bears not doing enough and bulls going sideways under ath. No interest in buying, so I am neutral until big bears come around.
medium-long term - Update from 2024-06-29: No change in plans. I expect 20000 to get hit over the next 3 months and maybe 19000 again.
trade of the day: Long the double bottom above 22800 or the retest on US open around 22830. Bears failed to print consecutive good looking 30m/1h bear bars, so a reversal was the most likely outcome after the double bottom.
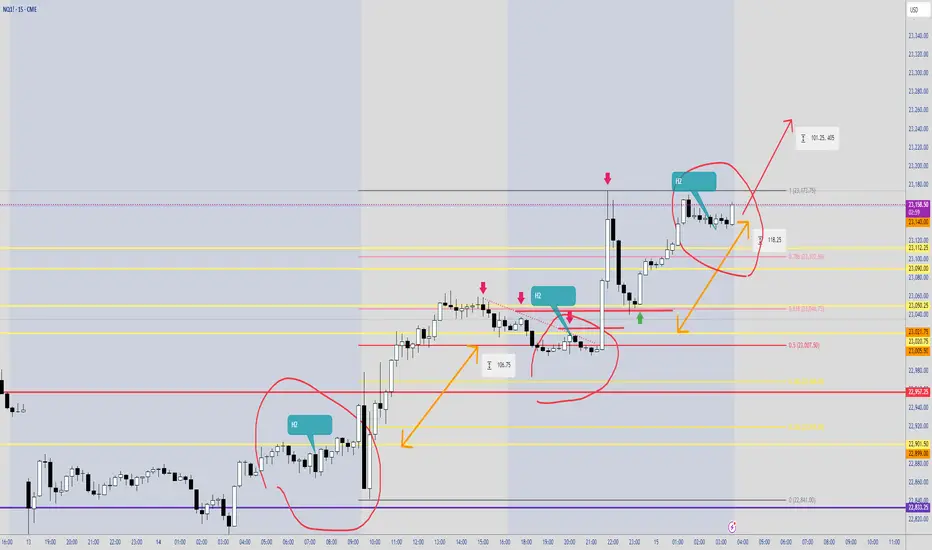
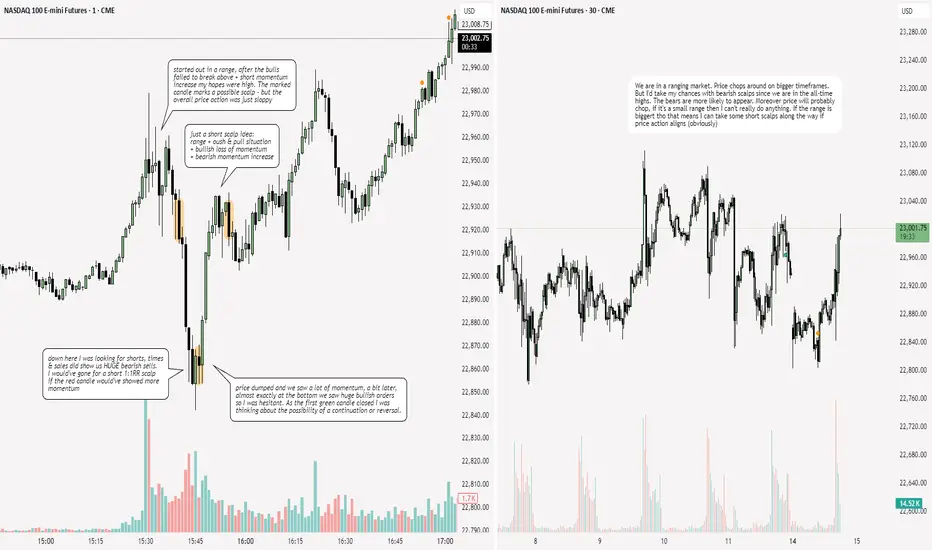
07/14 Nasdaq TradeThis time I had to wait for the red candle to create the wick for me to enter. I just needed that because we already had enough volume. Nasdaq is dangerous with this type of time frames. So review
Yellow Part: Variation
Blue Part: The wick that the red candle was creating for me to enter mroe confidently and using the wick as a stop loss.
Red Part: Execute the volume is on your side

NQ: 217th trading session - recapI'm back after a week and it feels great. I do think I really needed a break. I'm back with a new mindset, with optimism and a redifined plan. Here are some questions I will need to answer for myself:
- bullish times & sales increase - Watch out for it?
- breakeven for short scalps?
NASDAQ Futures: Consolidation Signals Potential Bearish Trend NeCurrent Price: 22959.0
Direction: SHORT
Targets:
- T1 = 22400
- T2 = 22200
Stop Levels:
- S1 = 23150
- S2 = 23320
**Wisdom of Professional Traders:**
This analysis synthesizes insights from thousands of professional traders and market experts, leveraging collective intelligence to identify high-probability trade setups. The wisdom of crowds principle suggests that aggregated market perspectives from experienced professionals often outperform individual forecasts, reducing cognitive biases and highlighting consensus opportunities in NASDAQ Futures.
**Key Insights:**
NASDAQ Futures are currently consolidating after reaching new highs earlier this quarter. This period of range-bound activity is marked by a decreasing daily trading range, suggesting market indecision among investors. The emergence of lower highs and lower lows in recent sessions signals a potential bearish momentum in the near term, with key support levels being monitored closely.
Additionally, macroeconomic factors such as global geopolitical tensions and tariff developments are contributing to investor caution. Recent data highlights the sensitivity of this asset to broader market sentiment. A break below key support might further solidify bearish sentiment, creating downside momentum.
**Recent Performance:**
In recent weeks, NASDAQ Futures rallied to achieve an all-time high but have since moved into a phase of consolidation. Price action has narrowed considerably, with the daily range contracting to 158 points from 192 points, reflecting decreasing volatility. The consolidation reflects growing caution in the market amidst an environment of tightening economic conditions and continued uncertainty.
**Expert Analysis:**
Market analysts have pointed out that consolidation following a strong rally is not uncommon. However, technical indicators are showing early signs of weakness. NASDAQ Futures currently trade near critical support levels aligned with the 50-day simple moving average (SMA). A breakdown below these levels could trigger a more significant correction to the downside. Resistance at $23,200 remains strong, and the inability to breach this level confirms bearish sentiment. Furthermore, a lack of supportive macroeconomic catalysts could prolong this period of weak momentum or further amplify the downside risks.
**News Impact:**
Recent market news includes heightened geopolitical tensions and the continued ripple effects of economic tariffs. These developments have dampened sentiment across equity markets, contributing to heightened caution and consolidation trends. Investors should carefully analyze updates on these fronts, as any resolution or escalation has the potential to swing markets significantly.
**Trading Recommendation:**
Given the consolidation observed in the NASDAQ Futures and the emerging signs of bearish momentum, a short position with targets at $22,400 and $22,200 is recommended. This setup is aligned with technical indicators and key macroeconomic concerns currently influencing market dynamics. Stop levels are set at $23,150 and $23,320 to manage risk in case of unexpected bullish reversals.

NQ Power Range Report with FIB Ext - 7/14/2025 SessionCME_MINI:NQU2025
- PR High: 22890.50
- PR Low: 22803.00
- NZ Spread: 195.0
No key scheduled economic events
0.33% weekend gap to previous week low, unfilled
Session Open Stats (As of 1:15 AM 7/14)
- Session Open ATR: 289.88
- Volume: 36K
- Open Int: 270K
- Trend Grade: Neutral
- From BA ATH: -1.0% (Rounded)
Key Levels (Rounded - Think of these as ranges)
- Long: 23239
- Mid: 21525
- Short: 20383
Keep in mind this is not speculation or a prediction. Only a report of the Power Range with Fib extensions for target hunting. Do your DD! You determine your risk tolerance. You are fully capable of making your own decisions.
BA: Back Adjusted
BuZ/BeZ: Bull Zone / Bear Zone
NZ: Neutral Zone
NASDAQ: Time For A Pullback?In this Weekly Market Forecast, we will analyze the NASDAQ for the week of July 14 - 18th.
The NASDAQ had a strong week, until Tariff Tensions Friday arrived.
This by itself doesn't mean we should start looking for sells. Just like the S&P 500, I'm expecting short term bearishness, as price goes from ERL to IRL.
With Tuesday CPI Data coming, this short term consolidation is to be expected until the news is announced.
Let the markets pick a direction, and flow with it.
Have a plan of action in place so you can react to the price action promptly!
Enjoy!
May profits be upon you.
Leave any questions or comments in the comment section.
I appreciate any feedback from my viewers!
Like and/or subscribe if you want more accurate analysis.
Thank you so much!
Disclaimer:
I do not provide personal investment advice and I am not a qualified licensed investment advisor.
All information found here, including any ideas, opinions, views, predictions, forecasts, commentaries, suggestions, expressed or implied herein, are for informational, entertainment or educational purposes only and should not be construed as personal investment advice. While the information provided is believed to be accurate, it may include errors or inaccuracies.
I will not and cannot be held liable for any actions you take as a result of anything you read here.
Conduct your own due diligence, or consult a licensed financial advisor or broker before making any and all investment decisions. Any investments, trades, speculations, or decisions made on the basis of any information found on this channel, expressed or implied herein, are committed at your own risk, financial or otherwise.

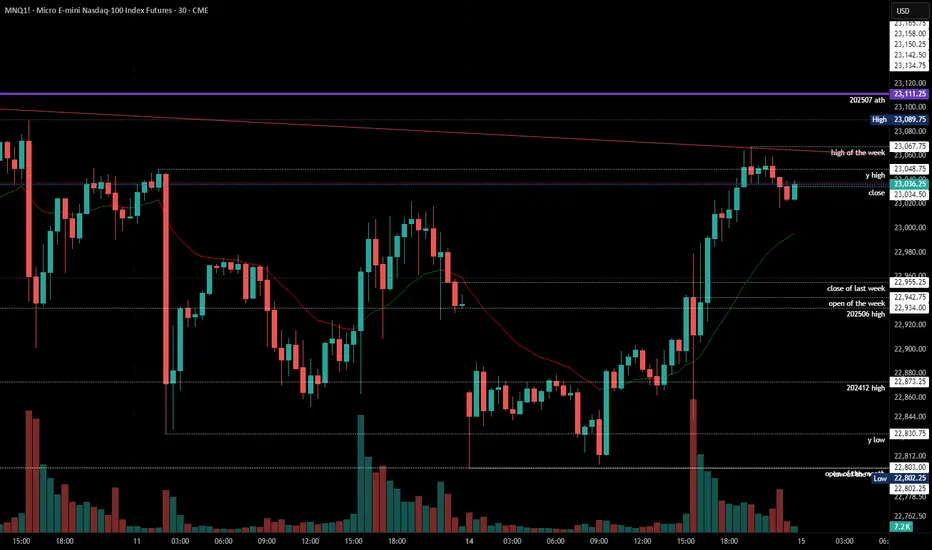
NASDAQ TRADING IDEA FOR 14-18 JULY 2025The price of NASDAQ is ranging between daily supply zone (23100) and daily demand (22830) and respecting trendline to find next liquidity control at h1 base at 22904 or H4/H1 liquidity control at 22864. I am looking for long opportunities at that area depend on how the price action for and wait confirmation before taking long position.
The price will continue to rise if daily supply breakout and form a new higher high at daily timeframe.
The market will shift direction if the daily demand breakout and I’m focusing to find opportunity taking short position at important key level/zone.