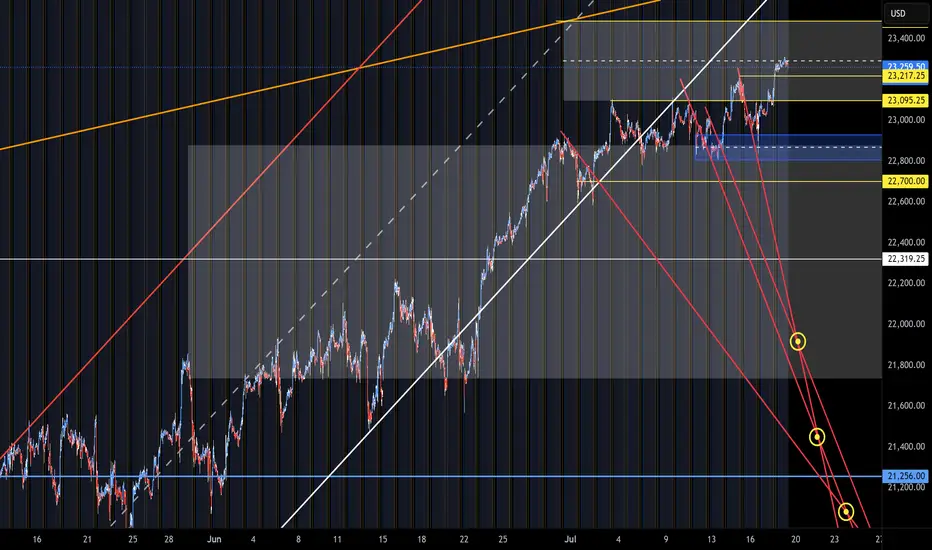
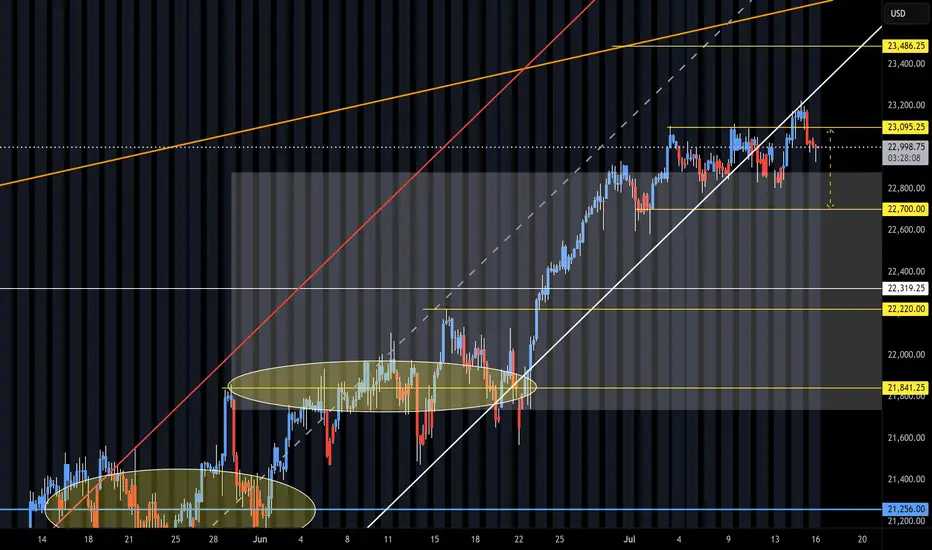
NQ Targets (07-18-25)I have not posted a Target call in awhile, this one is Long to upper TZ (23,486) and Short to YTD Open level. Prior use of Diablo's to Target drop was prior to NAZ 25% drop (11/24 Post's).
We are due for some drop retesting as we watch typical Long Side Tweets, Tricks and Games start to fizzle some. Today into Monday will be a key signal.
NQU2025 trade ideas
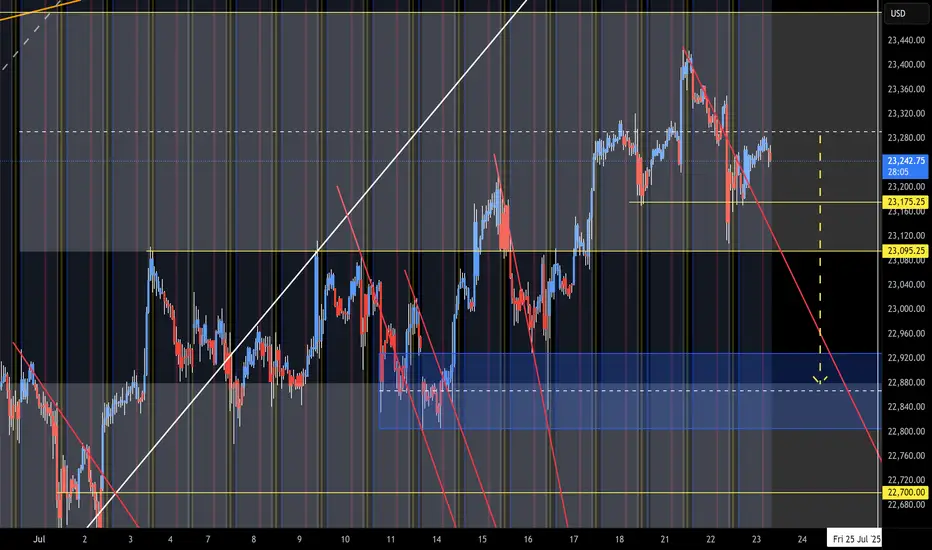
NQ Range (07-23-25)The O/N slight lift back to Mid Level of range. The big Tweet regarding Japan, did show up after the close. Now we need to see how the Open Drive & Reg Session move today, may be snail lift higher 1st. The next bullish move would be F-M Long play. The selling just does not have much force or is part of the head fake prior to a decent drop test. Still Scalp Shorts to KL's and wait on some conviction selling to eventually show up.
Nasdaq in future Everything's clear on chart
I wanna see a bullish move on NQ first to create a up run leg and come back to the lower 50 percent of that leg then ...
Scalper’s Paradise Part 3 – The Power of Order Flow and DOMWelcome back to Scalper’s Paradise! In this third part of the series, I want to take you into one of the most powerful tools in professional trading: Order Flow and the Depth of Market (DOM).
I chose this topic because during my time as an institutional trader, this was our entire world. We didn’t use indicators. We didn’t guess. We traded exclusively based on what we could see happening live in the DOM and Time & Sales. Every decision was made tick by tick, based on real market activity.
That experience shaped the way I view markets forever—and today, I want to share that perspective with you.
What Is Order Flow, Really?
To me, Order Flow is the most honest information the market can give you. It doesn’t predict, it reveals. It shows who is actually making moves right now. When I was sitting at my institutional desk, I didn’t look at moving averages or oscillators. I looked at who was being aggressive: were market buyers lifting offers, or were sellers smashing the bid?
Watching the tape (Time & Sales) and the footprint chart was like watching a fight unfold in real time. No filters, no guesses. Just raw interaction between buyers and sellers. That’s where real decisions are made.
The DOM: My Daily Reality as a Trader
The DOM (Depth of Market) was the first thing I looked at every morning, and the last thing I closed at night. It shows all visible limit orders resting at each price level. But there’s a catch: not everything you see is real.
In the institution, we were trained to spot real interest versus manipulation. Stacked bids might look strong, but if they disappear the moment price drops tells you that there was never a true intent. Iceberg orders were more interesting, when price gets hit again and again and doesn’t move, that usually meant someone was absorbing quietly.
Reading the DOM is like reading an X-ray of the market’s intentions. And yes, there’s a lot of noise, a lot of deception. But once you learn to read through it, it’s the most powerful tool you’ll ever have.
How We Used Order Flow on the Institutional Side
At the institution, we never chased price. That was rule number one. We let the market come to us (meaning: we used Limit Orders as often as possible) and we used Order Flow to guide every decision.
One of the most important concepts was absorption . If we needed to build a large long position, we didn’t just slam the ask. We would let sellers come in and hit our bids again and again and again. If price didn’t break lower, that told us we were in control.
On the flip side, when we needed to move the market , we switched gears. We used market orders aggressively to push through key levels, forcing reactions, triggering stops, and creating follow-through.
And yes, there were times when we intentionally created traps . We’d push price into obvious zones, make it look like a breakout, then fade it, because we knew how the market reacts afterwards. Order Flow was the only way to read those games in real time.
How You Can Use This as a Retail Trader
I know what you might be thinking: “I’m just a retail trader, how can I possibly use tools like Order Flow or DOM the way institutions do?”
The good news is: you don’t have to compete with institutions, you just need to read their intentions.
Here’s how I would approach it today:
1) Open a footprint chart and look for imbalances, areas where one side is clearly more aggressive. Watch for absorption or sudden volume spikes.
2) Watch the Time & Sales feed. Is there a flurry of trades hitting the ask, but price isn’t moving? That’s someone selling into strength.
3) Use the DOM around key areas like VWAP, previous day high/low, or liquidity clusters. Are orders getting pulled? Is size appearing suddenly? These are all signals.
You don’t need to be early. Let the big player act first, then confirm what you’re seeing across Order Flow and DOM. When everything aligns, that’s your edge.
Bringing It All Together
In Part 1, I shared how we used VWAP and Volume Profile as benchmarks to evaluate execution quality. In Part 2, I showed you how I identify institutional activity using raw volume and 10-second charts. And now, in Part 3, you’ve seen the real-time decision-making tools: Order Flow and DOM.
These aren’t indicators. They’re not theories. They’re the actual battlefield where institutions operate and where I learned to trade.
My goal with this series has always been simple: to give you access to the same mindset I used at the institutional level, but through a lens that makes sense for your reality as a retail trader.
Don’t try to outsmart the market. Observe it. Align with the big players. Let their behavior guide your decisions.
That’s how I learned to trade professionally—and it’s exactly how you can start thinking and acting like a pro, even without the size.
Part 1:
Part 2:
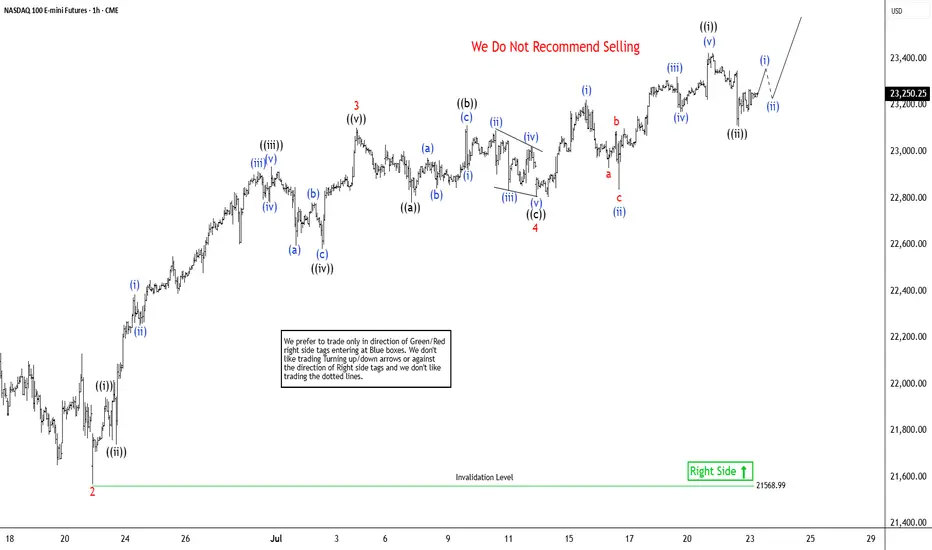
Elliott Wave View: Nasdaq Futures (NQ_F) Poised To Extend HigherThe Nasdaq Futures (NQ_F) favors higher in bullish impulse sequence from April-2025 low. It already broke above December-2024 high & expect short term pullback in 3, 7 or 11 swings to remain supported. Impulse sequence unfolds in 5, 9, 13, 17, 21….. swings count. It ended daily corrective pullback in double correction at 16460 low of 4.07.2025 low. On daily, it should extend into 28864 – 26152 area to finish April cycle before next pullback start. Above there, it favors rally in (3) of ((1)). It placed (1) of ((1)) at 21858.75 high, (2) at 21071.50 low as shallow connector & favoring upside in 5 of (3) against 7.13.2025 low. Every pullback after 4.21.2025 low was shallow & unfolded in 3, 7 or 11 swings calling for more upside as long as it stays above 5.30.2025 low. Within (3), it ended 1 at 22222 high, 2 at 21566.75 low, 3 at 23102.50 high, 4 at 22803 low & favors upsides in 5 of (3). Wave 4 as flat correction ended in 7.13.2025 low of 22803 low.
Below 3 of (3) high, it placed ((a)) at 22779.75 low, ((b)) at 23112 high & ((c)) at 22803 low as flat connector against 6.22.2025 low. Above there, it ended ((i)) at 23424.75 high as diagonal & ((ii)) at 23108 low in 3 swing pullbacks. Above there, it should continue rally in ((iii)) of 5, which will confirm above 23424.75 high to avoid double correction. Within ((i)), it placed (i) at 23222.75 high, (ii) at 22835.5 low, (iii) at 23320.75 high, (iv) at 23169.50 low & (v) at 23424.75 high. Currently, it favors upside in 5 of (3) into 23493.5 – 23934.5 area, above 7.13.2025 low before (4) pullback. Based on swing sequence, it already has enough number of swings in (3) to call the cycle completed. But as long as it stays above price trendline, passing through 2 & 4, it should continue upside into extreme area. We like to buy the next pullback in 3, 7 or 11 swings at extreme area for intraday rally. It favors upside in April-2025 cycle & expected to remain supported in (4) & later in ((2)) pullback as next buying opportunity.
2025-07-21 - priceactiontds - daily update - nasdaqGood Evening and I hope you are well.
comment: Melt-up and bears failed to close below last weeks high, which means we are still max bullish. Until bears print below 23200, longs just make more sense than trying to look for shorts.
current market cycle: bull trend
key levels: 23000 - 23500
bull case: Bulls remain in full control until we get a daily close below 22700. First target for the bears is a lower low, which means getting below today’s spike 23225. That would be a start but likely means sideways rather than more selling. If we stay above 23200, we can continue to print many more new highs.
Invalidation is below 22700.
bear case: Bears obviously are not doing enough. They need to print 23200 and that would only be the first small start. It would open the possibility for a test of 23000 but since we are barely printing any red bars and have not broken any bull trend line so far, it’s stupid to look for shorts. Wait for much bigger selling pressure.
Invalidation is above 23500.
short term: Neutral but if anything I am looking for long scalps against support like the 1h 20ema.
medium-long term - Update from 2024-06-29: No change in plans. I expect 20000 to get hit over the next 3 months and maybe 19000 again.
trade of the day: Long US open. Just a quick melt-up but I missed it.
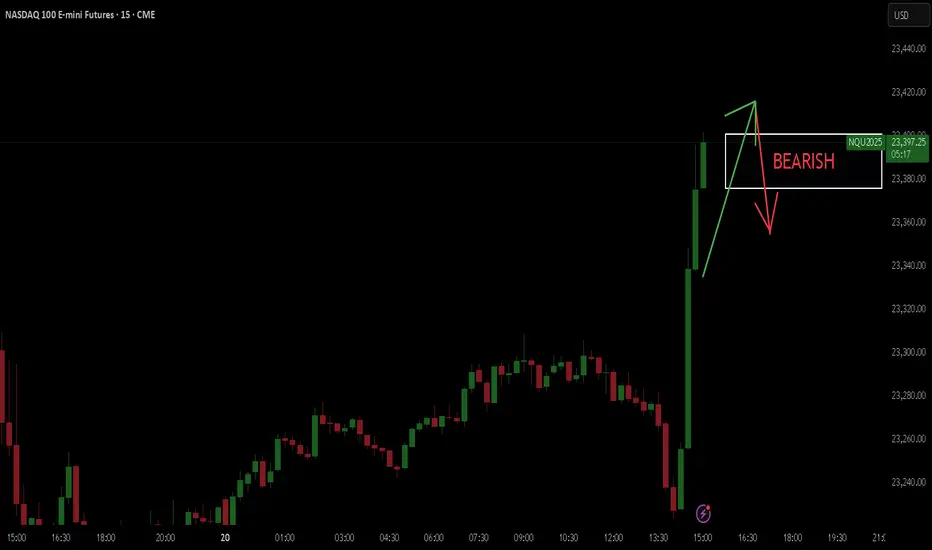
NQ Weekly Outlook & Game Plan 20/07/2025NQ Weekly Outlook & Game Plan
🧠 Fundamentals & Sentiment
Market Context:
NQ continues its bullish momentum, driven by institutional demand and a supportive U.S. policy environment.
📊 Technical Analysis:
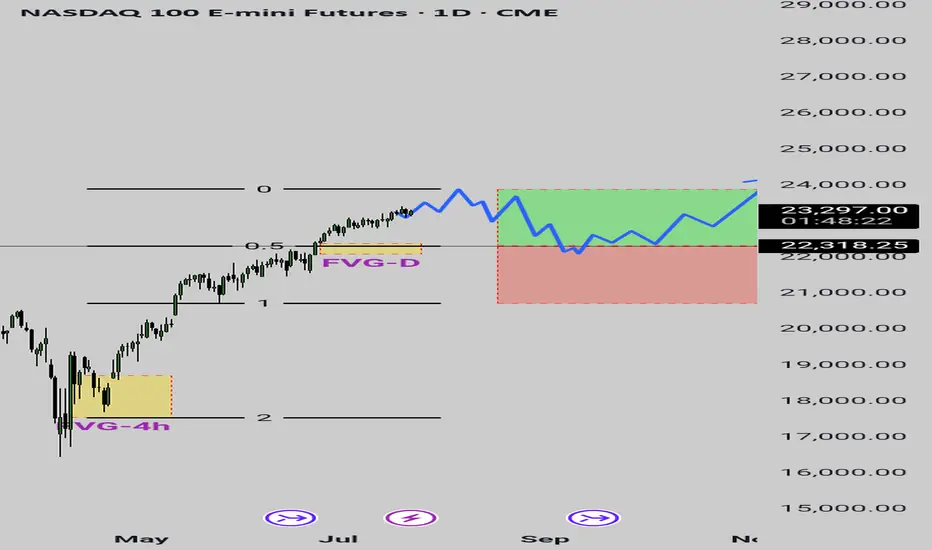
Price is currently in price discovery, and the weekly structure remains strongly bullish — so I prefer to follow the strength.
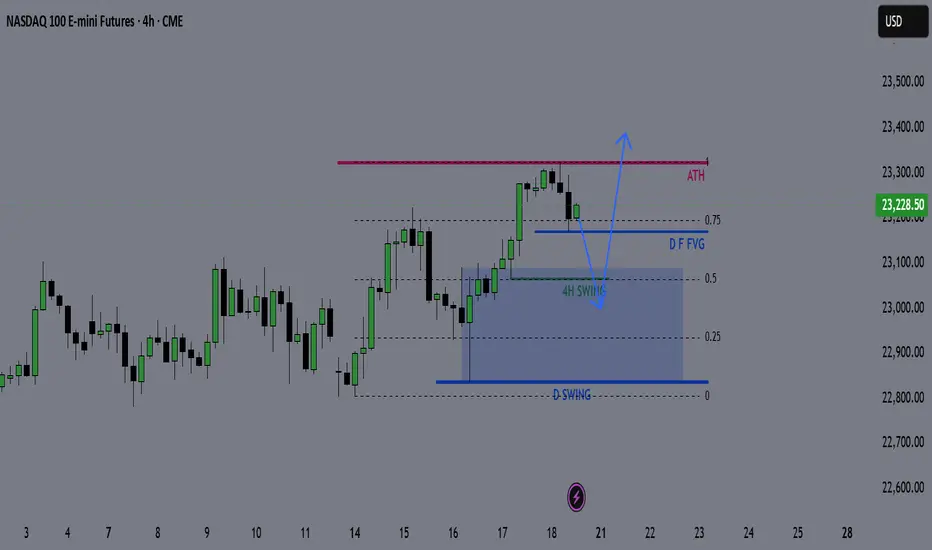
We might see a minor retracement before pushing further above the all-time high (ATH).
🎯 Game Plan:
I'm expecting a potential retracement to the 0.5 Fibonacci level, which is the discount zone in a bullish environment.
Interestingly, the 4H liquidity zone aligns perfectly with the 0.5 Fib level — this confluence suggests price may gather enough energy from there to make new highs.
✅ Follow for weekly recaps & actionable game plans.
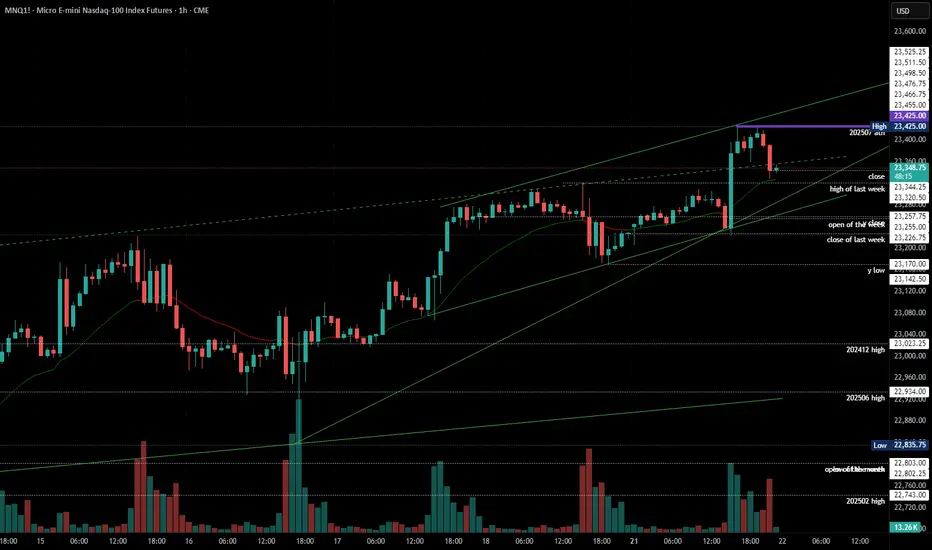
Emini Nasdaq 100. Daily Orderflow. 22.07.2025, TuesdayDaily orderflow and the thought process behind execution on Nasdaq

Stock Index Weekly Analysis: ES, NQ, YMWeekly Targets (Gun to my head!)
- ES: Neutral
- NQ: Neutral
- YM: $44,186

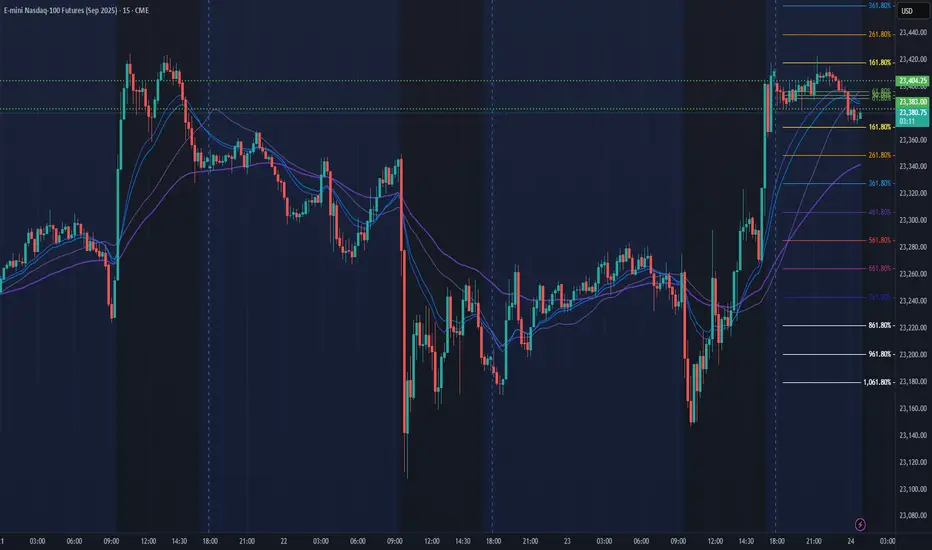
NQ Power Range Report with FIB Ext - 7/24/2025 SessionCME_MINI:NQU2025
- PR High: 23404.25
- PR Low: 23383.00
- NZ Spread: 47.75
Key scheduled economic events:
08:30 | Initial Jobless Claims
09:45 | S&P Global Manufacturing PMI
- S&P Global Services PMI
10:00 | New Home Sales
Front run ATH, advertising breakout potential
Session Open Stats (As of 12:15 AM 7/24)
- Session Open ATR: 258.10
- Volume: 18K
- Open Int: 271K
- Trend Grade: Neutral
- From BA ATH: -0.1% (Rounded)
Key Levels (Rounded - Think of these as ranges)
- Long: 23811
- Mid: 22096
- Short: 20383
Keep in mind this is not speculation or a prediction. Only a report of the Power Range with Fib extensions for target hunting. Do your DD! You determine your risk tolerance. You are fully capable of making your own decisions.
BA: Back Adjusted
BuZ/BeZ: Bull Zone / Bear Zone
NZ: Neutral Zone
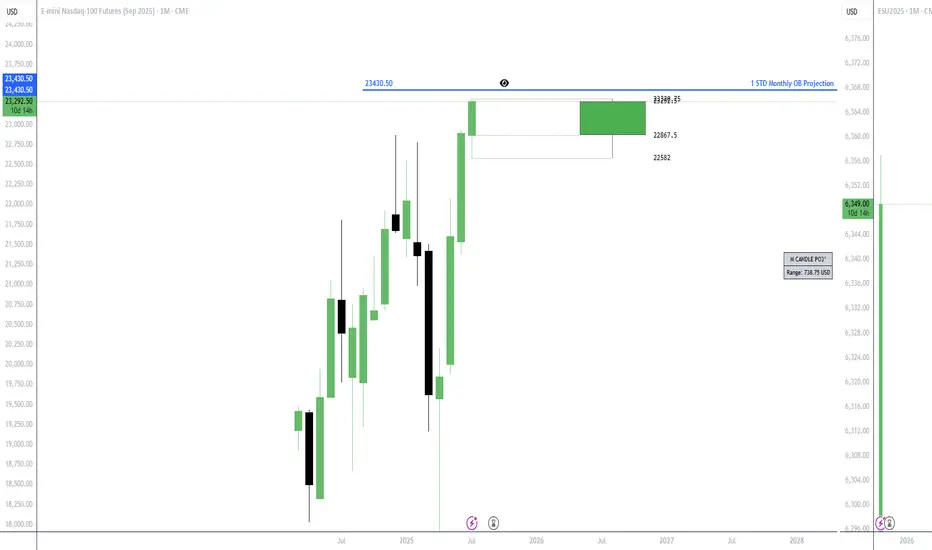
NQ projection!I´m Bullish on the monthly chart on NQ. My projected target for upside is the one you see in the chart. It´s projected from the Monthly bullish orderblock, 1 standard diviation!
NQ Short (07-16-25)NAZ again can't hold on the Monday off session pump during the Reg Session and does hit lower zone of 22,920. Next trick is Gov't controlled news (released in off session of course) should that not lift it then KL's 881-780 may be next.
The NAZ will go lower under 780 and will be a Strong Short under 22,700. The issue is with getting past the off session propping/rigging (up). Circles to the left are drop target zones that are likely to be revisited as ultimately the NAZ goes sideways in a larger range. The current 14 day sideways moves feels like an Long Mop up or Long Trap. The NAZ will need Tweets, O/N Prop moves and Dead Zone magic lifting to stay away from the Danger Zone of sell orders near 22,881-780.
NASDAQ: Still Bullish! Look For Valid Buys!Welcome back to the Weekly Forex Forecast for the week of July 21-25th.
In this video, we will analyze the following FX market:
NASDAQ (NQ1!) NAS100
The Stock Indices are strong, and showing no signs of selling off. Buy it until there is a bearish BOS.
Enjoy!
May profits be upon you.
Leave any questions or comments in the comment section.
I appreciate any feedback from my viewers!
Like and/or subscribe if you want more accurate analysis.
Thank you so much!
Disclaimer:
I do not provide personal investment advice and I am not a qualified licensed investment advisor.
All information found here, including any ideas, opinions, views, predictions, forecasts, commentaries, suggestions, expressed or implied herein, are for informational, entertainment or educational purposes only and should not be construed as personal investment advice. While the information provided is believed to be accurate, it may include errors or inaccuracies.
I will not and cannot be held liable for any actions you take as a result of anything you read here.
Conduct your own due diligence, or consult a licensed financial advisor or broker before making any and all investment decisions. Any investments, trades, speculations, or decisions made on the basis of any information found on this channel, expressed or implied herein, are committed at your own risk, financial or otherwise.

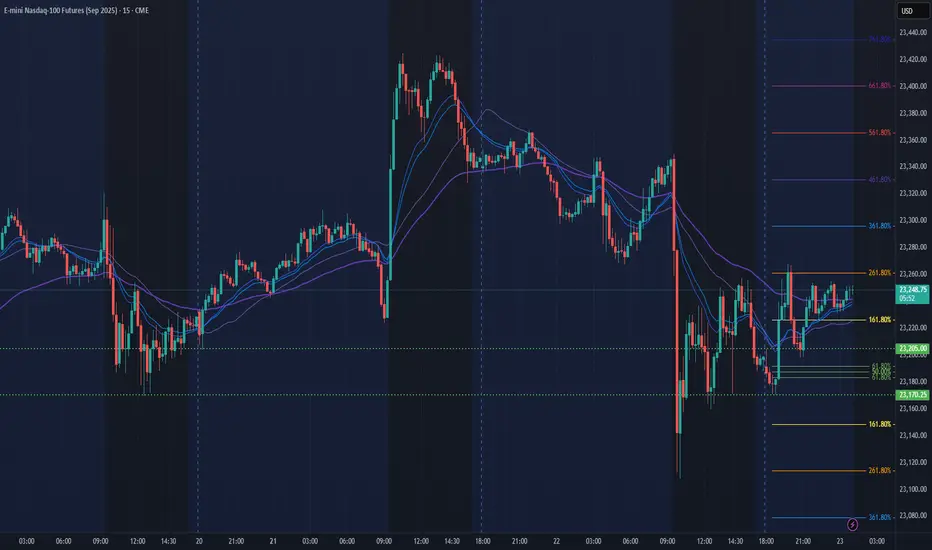
NQ Power Range Report with FIB Ext - 7/23/2025 SessionCME_MINI:NQU2025
- PR High: 23205.00
- PR Low: 23170.25
- NZ Spread: 77.75
Key scheduled economic events:
10:00 | Existing Home Sales
10:30 | Crude Oil Inventories
Session Open Stats (As of 12:25 AM 7/23)
- Session Open ATR: 261.82
- Volume: 34K
- Open Int: 270K
- Trend Grade: Neutral
- From BA ATH: -0.7% (Rounded)
Key Levels (Rounded - Think of these as ranges)
- Long: 23811
- Mid: 22096
- Short: 20383
Keep in mind this is not speculation or a prediction. Only a report of the Power Range with Fib extensions for target hunting. Do your DD! You determine your risk tolerance. You are fully capable of making your own decisions.
BA: Back Adjusted
BuZ/BeZ: Bull Zone / Bear Zone
NZ: Neutral Zone
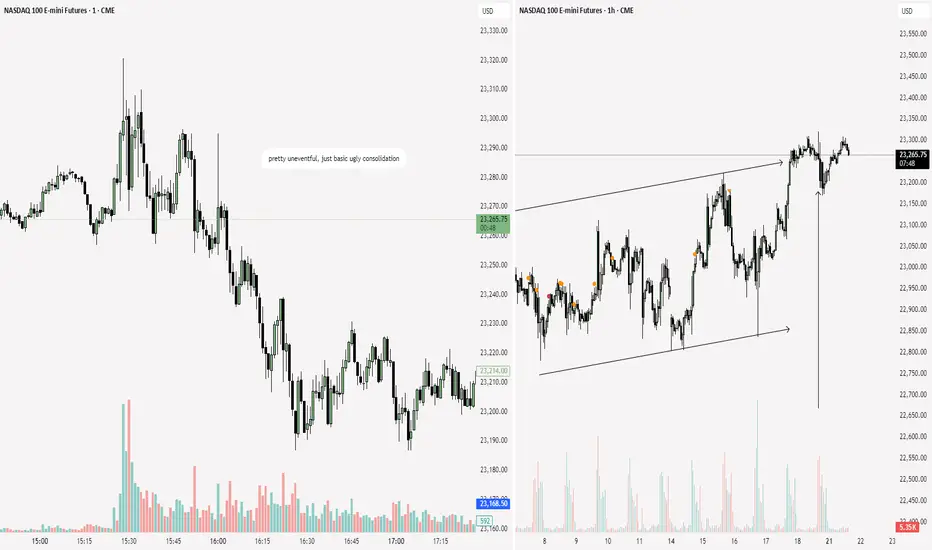
NQ: 220th trading session - recapForgot to post it - nothing happened so it's not that deep but I cannot keep forgetting man
Nasdaq Short Cell or Sell !We Look for the ATM (All Time High) always, But markets Keep Making Higher Highs and New ATMs .
Keep in mind , Nobody Knows the Next Move Or if it goes Higher Or Lower.
We assume and try to Resume as Long As we Can !
The Market is somehow About Survival. If you Survive the next level to achieve is to keep your losses Small when you are wrong and let your profits run as long as they are valid Then you have entered the Realm of 10% profitable traders.
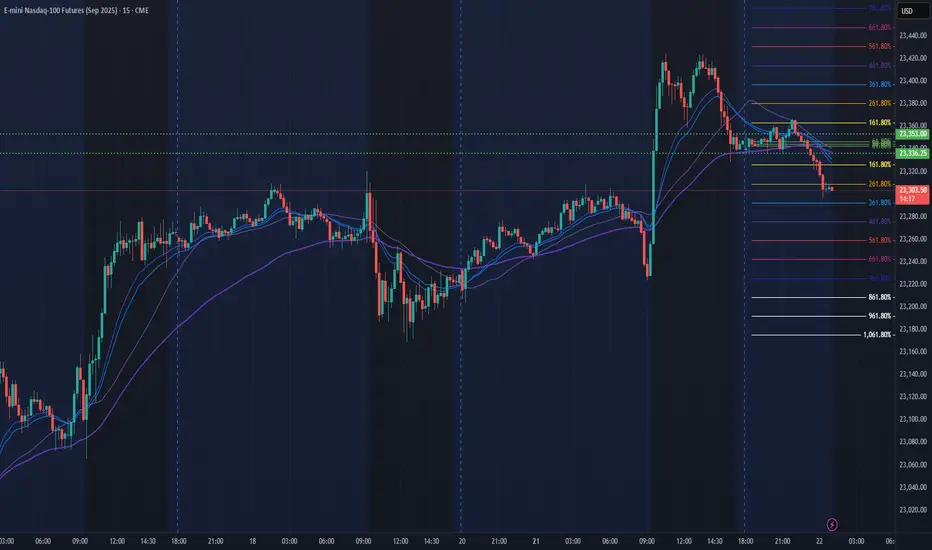
NQ Power Range Report with FIB Ext - 7/22/2025 SessionCME_MINI:NQU2025
- PR High: 23353.00
- PR Low: 23336.00
- NZ Spread: 38.0
Key scheduled economic events:
08:30 | Fed Chair Powell Speaks
Session Open Stats (As of 1:45 AM 7/22)
- Session Open ATR: 260.85
- Volume: 19K
- Open Int: 277K
- Trend Grade: Neutral
- From BA ATH: -0.1% (Rounded)
Key Levels (Rounded - Think of these as ranges)
- Long: 23811
- Mid: 22096
- Short: 20383
Keep in mind this is not speculation or a prediction. Only a report of the Power Range with Fib extensions for target hunting. Do your DD! You determine your risk tolerance. You are fully capable of making your own decisions.
BA: Back Adjusted
BuZ/BeZ: Bull Zone / Bear Zone
NZ: Neutral Zone
NQ Short (07-14-25)The NAZ appears to be due for a Drop Test back inside the lower range. F-M Long play and O/N lift moves seem to be loosing their effectiveness. Looking for a 22,300-200 target on drop and if not, look for U Turn under 23,300.

DIYWallSt Trade Journal: Perfect Morning Signals & Rate Cut bets07/15/25 Trade Journal, and ES_F Stock Market analysis
EOD accountability report: +404.50
Sleep: 7 hours
Overall health: Good
VX Algo System Signals from (9:30am to 2pm)
— 8:41 AM Market Structure flipped bullish on VX Algo X3!
— 9:33 AM VXAlgo ES X1 Sell Signal (triple sell)
— 9:40 AM Market Structure flipped bearish on VX Algo X3!
— 1:20 PM VXAlgo ES X1 Buy signal (triple buy)
What’s are some news or takeaway from today? and What major news or event impacted the market today?
We got great signals at the start of the day and that really helped with today's trading. I had some meetings today and stufff to take care of so i decided to lock out the funded account around noon and called a day.
News
— 9:54 AM
*TRADERS STICK TO BETS ON SEPTEMBER FED RATE CUT AFTER INFLATION REPORT
What are the critical support levels to watch?
--> Above 6295= Bullish, Under 6285= Bearish
Video Recaps -->https://www.tradingview.com/u/WallSt007/#published-charts

Shorting NQ Yep, weakness started to creep in on NQ this time.
Firstly, the higher timeframes shows massive divergence, even when whales tried to push the price high and continue the trend, massive shorts came in with massive volume. It only tells me that bears are in control this time, and they are coming in with force.
So technically, iam looking for a short up until 22,858
What is really confusing is that also gold is showing weakness which is really something odd, so either iam right in my analysis for Gold and NQ or iam wrong in one of them.
But we will see.

NQ Range (07-08-25)White arrow is stall/drop zone and yellow is strong short. The O/N continues to reset any drops that happen in most Reg Sessions. It appears to me that a weak/fake Euphoric Stage is being played out. The idea of chasing the NAZ (after the O/N redirect) is the game, no chase and the game will end. The O/N has been redirecting for about 2 years (can continue). Again, the recent 25% drop was erased with a Tweet & news release (10 min 2,000 point) move and a few O/N's. Just feels like a fake chase play since the pop of the bottom.

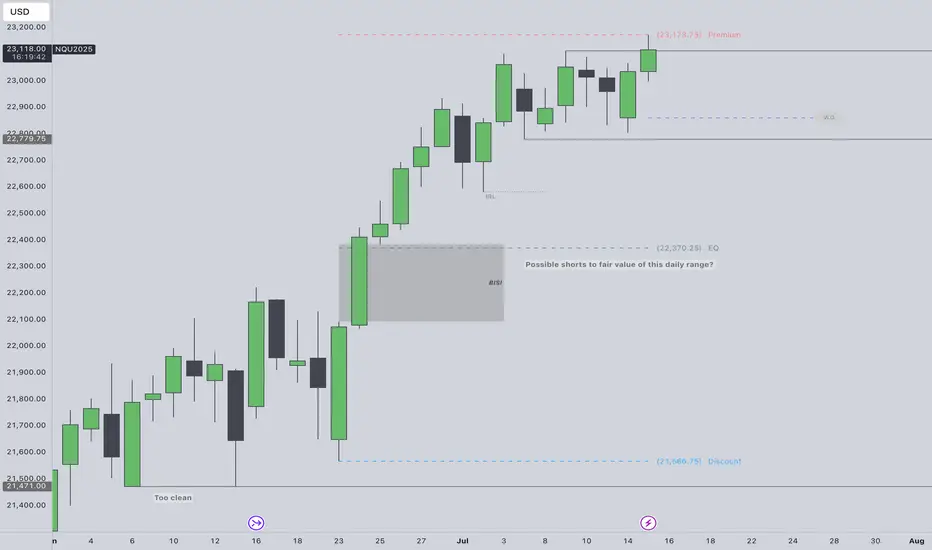
To fade all time highs or not?Not trying to fade ATH run but the SSL in this daily range looks too obvious to me. Super premium.
Price was in a consolidation July 7th - 14th. Took external range high today. I really could see shorts playing out if theres a intraweek reversal confirmed after purging the ERH.
Would need to see 1h CISD confirm intraweek reversal to the downside then trade the daily continuation lower targeting 22,779, 22,578 & EQ of the range at 22,370. Also, the daily BISI that needs sellside delivery.
CPI scheduled this week. PPI following.