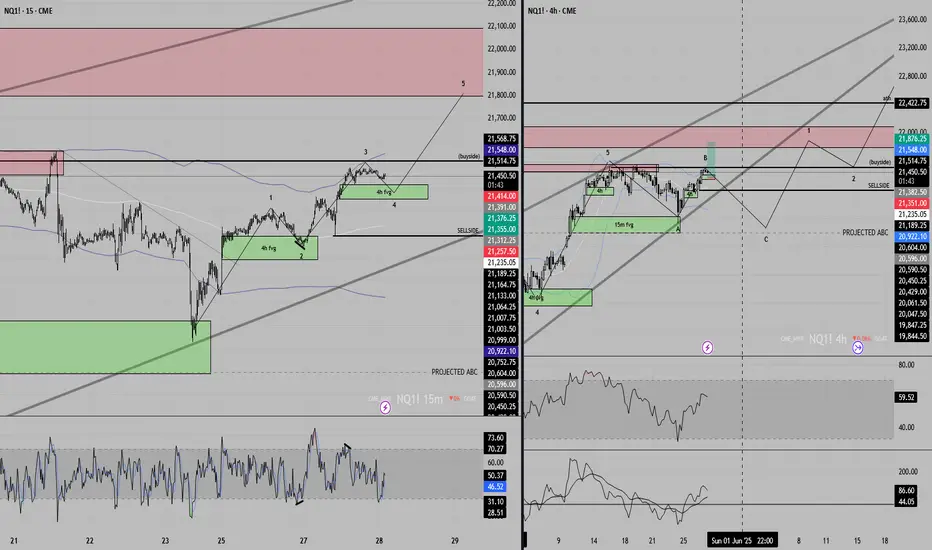
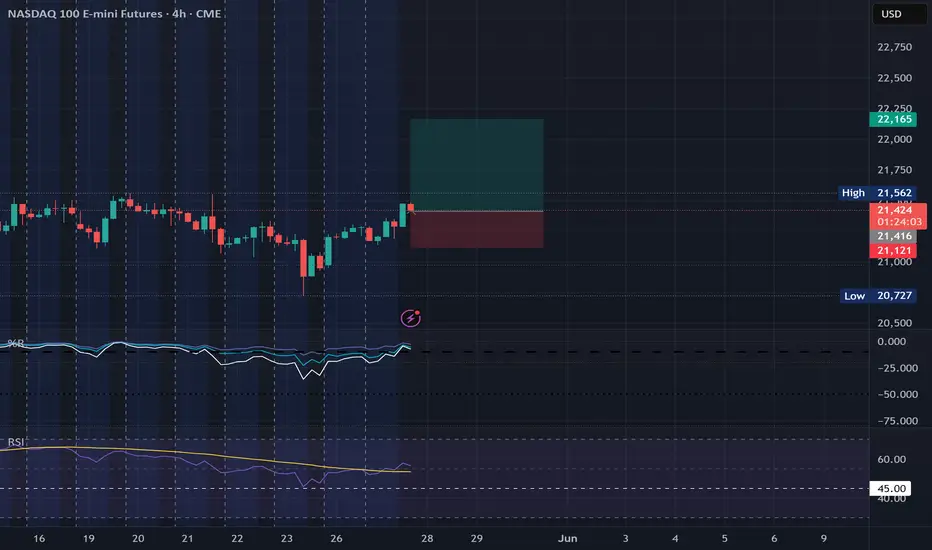
Potential Reversal Level on NasdaqLooking for Price to retrace as far as the H1 OB (max 21,440.00 to remain bullish), to potentially provide a reaction and continue his grind higher or at least return back to 50% of today range.
NQ1! trade ideas

Nvidia Earnings Boost, Trade Tariffs Legitimacy, NQ trade ideaCME_MINI:NQ1!
Big Picture Context: .
NQ futures rallied after NVIDIA posted an earnings beat and after the Manhattan-based Court of International Trade blocked President Trump's Liberation Day tariffs.
Goldman Sachs noted that the ruling on Liberation Day tariffs gives the administration 10 days to halt tariff collection, but does not affect sectoral tariffs. The administration can still impose across-the-board and country-specific tariffs under other legal authorities.
Jobless claims and continuing claims have come in higher.
What has the market done?
The rally faded in the overnight session. However, the catalysts provided energy for prices to move higher. Currently, price is trading above the prior week’s high, yesterday’s high, and it is also trading above the yearly open, and 2025 VPOC and mcVPOC for the last 3 weeks.
What is it trying to do?
The market is negating the recent bear market territory sell-off and negating a bear market rally. It is propelling higher.
How good of a job is it doing?
The market has created good structure and micro composites, despite some gaps left open, and it has created higher lows since last Friday.
What is more likely to happen from here?
Scenario 1: Long Continuation
In this scenario, we are looking for NQ to turn at the immediate 2025 LVN support area. If it edges higher, we will be looking for potential long opportunities above the 21710–21720 area, targeting overnight highs and potentially the next HVN.
Scenario 2: Gap Close and Reversal
In this scenario, we are looking for a pullback, testing pHi and pWk-Hi. We will look for a rounded base that consolidates here on a lower timeframe, such as the 5-minute timeframe, and look for a reversal back towards the 21710–21720 level.
pWk-Hi: prior Week's High
pHi: prior Day's High
HVN: High Volume Node
LNV: Low Volume Node
VPOC: Volume Point of Control
C: Composite (prefix before VAL, VAH, VPOC, VP, AVP)
mC: micro-Composite (prefix before VAL, VAH, VPOC, VP, AVP)

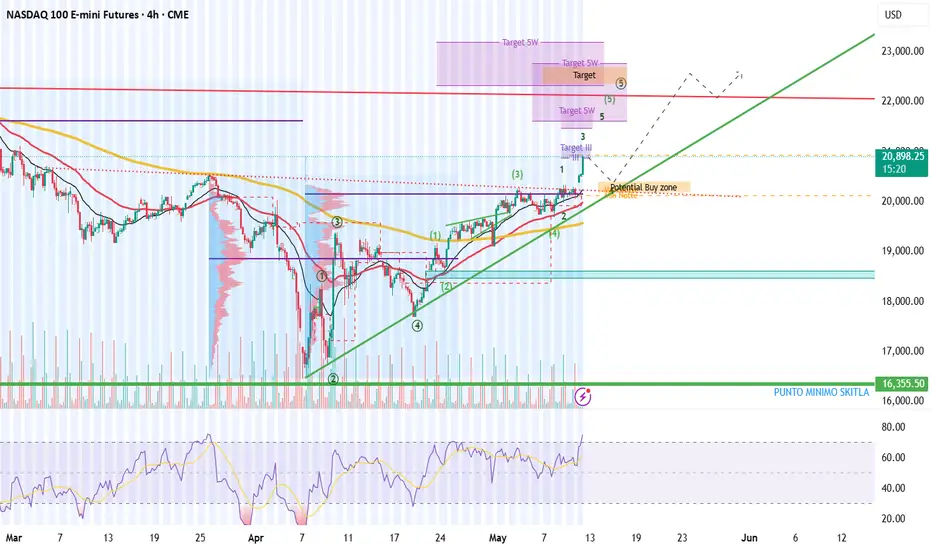
NASDAQ - Long strategyNASDAQ - Long strategy
After this big impulse is expected a retracement of price.
In this moment there isn't any certains .. we are a boat in Trump sea ..
From technical point of view we can approuch divided entry trade..
By anailys we can have a retracement for wave 4 and after a new long until end of 5 Wave .. ofter this last wave we can have a deep new short wave.
Final targer should be 22500
NQM2025 outlook for the week ahead 05/19/2025Hello World.
for the week ahead i have a bullish bias im looking to target the bearish fvg created on mon 24 feb 2025 ( daily TF) i expect the fvg formed on tue 13may2025 (Daily TF) reject the price higher, if the bullish fvg didnt hold maybe we will se a drop to the V.I bellow.
i will give updates

NQ Target 23.015 - 23.360 by Ray ( 8 years old)Ray is Long NQ (nasdaq futures) weekly analysis for NQ with higher price target 23.015 to 23.360 after his STD indicator and inefficiencies

NQ Power Range Report with FIB Ext - 5/29/2025 SessionCME_MINI:NQM2025
- PR High: 21597.00
- PR Low: 21489.00
- NZ Spread: 241.5
Key scheduled economic events:
08:30 | Initial Jobless Claims
- GDP
12:00 | Crude Inventories
Open session with momentum break beyond 21600
- 2% value increase before London hours
Session Open Stats (As of 1:15 AM 5/29)
- Session Open ATR: 455.84
- Volume: 81K
- Open Int: 267K
- Trend Grade: Neutral
- From BA ATH: -3.7% (Rounded)
Key Levels (Rounded - Think of these as ranges)
- Long: 22096
- Mid: 20383
- Short: 19246
Keep in mind this is not speculation or a prediction. Only a report of the Power Range with Fib extensions for target hunting. Do your DD! You determine your risk tolerance. You are fully capable of making your own decisions.
BA: Back Adjusted
BuZ/BeZ: Bull Zone / Bear Zone
NZ: Neutral Zone

25.05.29 nasdaq analysis📊
The Nasdaq has broken through its short-term resistance trendline and turned upward.
NVIDIA’s strong earnings report acted as a positive catalyst, leading to a rebound,
and the Asian session helped extend the upward momentum.
📈
On the daily chart, the previous high of 21,813 (Feb 25, 2024) has been broken to the upside.
The current price is within the range of the prior candle (21,652–22,245),
with the next major resistance at 21,968, which coincides with a key supply zone.
This level may trigger some short-term profit-taking.
🕒
After the breakout, the Nasdaq is consolidating in a sideways pattern while making higher highs.
Currently, there is no clear entry point for long positions, and traders should manage risk carefully.
The upper target remains at 21,968, but the volatility during pullbacks might challenge entry holding power.
📉
If price breaks below 21,408, we may see downside continuation toward the lower red support zone.
Unless this level breaks, initiating short positions at current levels would be considered premature.
📌 Conclusion
After the breakout, the Nasdaq is nearing overbought territory; a cautious stance is advised.
Longs are more favorable on a pullback entry strategy.
Shorts only become valid if 21,408 is breached with strong downside momentum.
Any additional pivot zones or trade setups will be shared in future updates.

Nasdaq Bulls Back in the Fight – 21K Is the Battlefield📍 The 21K Line in the Sand – Nasdaq’s Second Chance Setup
The bounce off the purple EMA was no joke — big reaction, and now we’re reclaiming key structure: back above VWAP (red), white EMA, and even the weekly pivot (straight orange line).
That pivot zone at 21K is still the line in the sand. I do expect a potential breach — maybe even a quick liquidity sweep — but if buyers step in with momentum and reclaim, I’m interested in longs again.
⚔️ This is a momentum shift — structure's back in favor of bulls, and until we lose 21K with conviction, I’m treating dips into that area as buyable.
📍And if price overreacts? I’m watching 20,750 as a “second chance” zone. Strong bounce there before — I’m not ignoring that twice.
This is still a two-sided game, but for now, bulls are back in position. Let’s see if they hold the line.

Nas100 AnalysisI can see that the bulls are trying to step in .
I am waiting for price to close above my zone to look for entrys
NQ: 198th trading session - recapToday was a good day, I arrived pretty late so I couldn't really do that much pre market prep, tbh it's not like I do that much but yk. You best believe my dumb*ss was speeding on my broken bicycle...
I was pretty focused. I am locked back in. But I won't be there friday, cuz I'm meeting up with a girl. I am f*cking pissed off at myself that I let myself do sh*t like that but whatever. We only live once ahh

Nasdaq - 1 - 2 Months wavesAS outlined in the graph. Based on the current fib level it doesn't seem like a good enough correction, so I am assuming it could be an extensive correction wave. Great short zone at this moment.

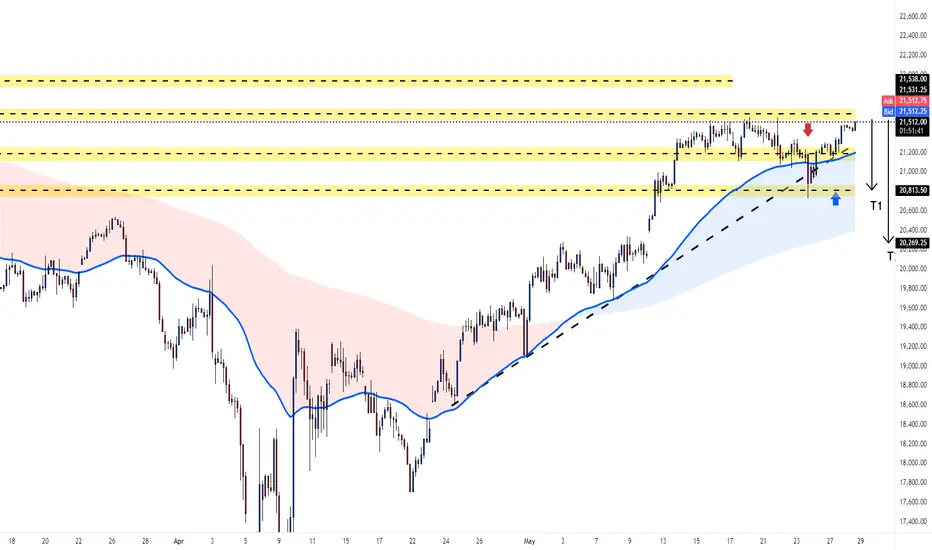
This is a 4-hour chart of the NASDAQ 100 index (NQ1!). Analysis:
Trend and Support: The chart shows an ascending trendline (black dashed line) acting as support, with the price recently bouncing off it around the 20,260 level. This suggests the uptrend remains intact for now.
Price Action: The price has pulled back from a high near 21,500 ish and is currently consolidating around 21,000. The recent bounce off the trendline indicates potential buying interest at lower levels.
Key Levels:
Resistance Zone: The yellow shaded area between 21,200 and 21,550 is a resistance zone where the price previously struggled.
Support Zone: The area around 20,800–20,900 (another yellow shaded area) may act as immediate support if the price dips again.
Targets: T1 (20,813.50) and T2 (20,626.25) are marked as potential downside targets if the price breaks below the trendline. On the upside, breaking above 21,550 could target 21,800 (top of the resistance zone).
Market Sentiment: The order book on the right shows the current ask at 21,531.25 and bid at 21,506.25, with a tight spread indicating decent liquidity. The price is slightly below the ask, suggesting some selling pressure or hesitation to break higher immediately.
Potential Scenarios:
Bullish: If the price holds above the trendline and breaks 21,400, it could rally toward 21,800 or higher.
Bearish: A break below the trendline and 20,800 support could lead to a deeper pullback toward T1 (20,813.50) or T2 (20,626.25).
Insight: The NASDAQ 100 is in an uptrend but facing resistance near 21,400. Watch for a breakout above this level for bullish confirmation or a break below the trendline for a bearish move. The 20,800–20,900 zone is a key support to monitor.
NQ looking for higher prices!Today we took out liquidity during London and then pushed through tuesdays highs and now we are looking for a retrace for AM higher prices up to Equal highs!


long nasdaqheres 2 very basic examples of what i think could play out on the nasdaq... personally i think were overbought and need a pullback.. not looking to short this market tho, am watching for a momentous push threw the highs. or to get long on a pullback
NQ Power Range Report with FIB Ext - 5/28/2025 SessionCME_MINI:NQM2025
- PR High: 21480.00
- PR Low: 21453.50
- NZ Spread: 59.5
Key scheduled economic events:
14:00 | FOMC Meeting Minutes
Follow-through on daily print value increase rotation
- Closing in on 21600 front run pivot from previous week
Session Open Stats (As of 12:15 AM 5/28)
- Session Open ATR: 450.12
- Volume: 19K
- Open Int: 274K
- Trend Grade: Neutral
- From BA ATH: -5.3% (Rounded)
Key Levels (Rounded - Think of these as ranges)
- Long: 22096
- Mid: 20383
- Short: 19246
Keep in mind this is not speculation or a prediction. Only a report of the Power Range with Fib extensions for target hunting. Do your DD! You determine your risk tolerance. You are fully capable of making your own decisions.
BA: Back Adjusted
BuZ/BeZ: Bull Zone / Bear Zone
NZ: Neutral Zone

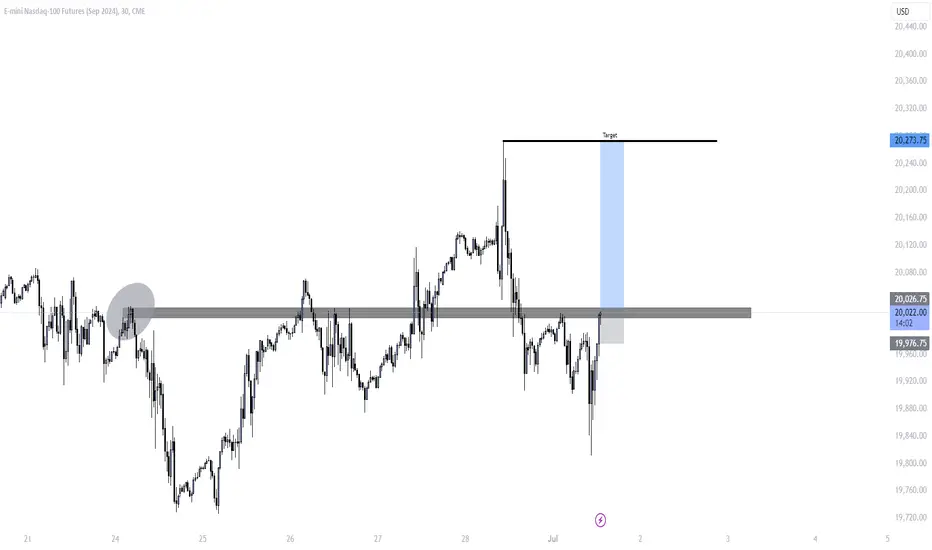
25.05.28 nasdaq analysis🕒 NASDAQ - 30-Minute Chart Analysis
Looking at the 30-minute chart, we can see an ascending triangle pattern forming on NASDAQ.
If resistance is broken to the upside, it would normally make sense to approach with a bullish bias. However, the presence of this pattern in this context feels somewhat off, so even if a breakout occurs, I plan to let it go without entering.
Currently, my plan is to enter a short position if the price breaks below the red box area, which represents the ascending trendline.
The target for this trade is the blue box zone.
If the bottom of the blue box is broken as well, I will approach today’s market with a bearish strategy only.

Bullish on IndexsForgot to post, But we had asweep of liquidity, market structure shift with FVG making a ICT 2022 model, price bounced off FVG we can anticipate more bullish price nice target would be may,20 daily high

Bullish BreakoutThere's a lot of greed towards the upside in this current market state. Fear consolidation is confirmation of this. Stoploss below said fear consolidation pricing.
Nasdaq 100. Mistakes and Daily Orderflow 27.05.25Covered the mistakes that I have made while reading the price. Wanted the shorts although the daily and the 4H suggested bullish price action. The good think was didn't forced. Just left the market after booking partials and breakeven
Post that took one long towards the Volume Imbalance

NQ: 197th trading session - recapI'm back, haven't had great days. School stress is really annoying me rn. I can't concentrade. Tomorrow, I will skip school and trade, I will be locked in, hopefully. And thursdays a holiday day in Germany - hopefully not in the US so the markets open...

Nasdaq 100 3 Bar Trendline now Intact!Hey traders so as you can see you don't need indicators just a simple drawing of a straightline to try to get on the right side of the market. Does it always work NO but most of the time it does. So now we need to wait for the pullback before considering to enter from the long side. Have your order ready and always use risk management.
Don't chase the market let it come to you!
Enjoy,
Clifford

Quick Win on MNQ with Over $250 Profit — Here’s the Setup!Today’s trade was a perfect execution using an inverse fair value gap. I spotted a bearish fair value gap that had been disrespected, and instead of fading it, I flipped the bias and used it as an inverse gap, anticipating price would not trade under it. With my stop just below, I targeted the buy-side liquidity near the London kill zone highs.
The result? A smooth ride to over 300 points and a $250+ profit in a single entry, reaching target with precision. This is how it’s done when you combine technical setups with market context. Keep your risk low, target the right liquidity zones, and let the market work for you.
#MNQ #FuturesTrading #TradeSetup #FairValueGap #PriceAction #TradingTips #MNQTrade #NasdaqFutures #LiquidityHunt
