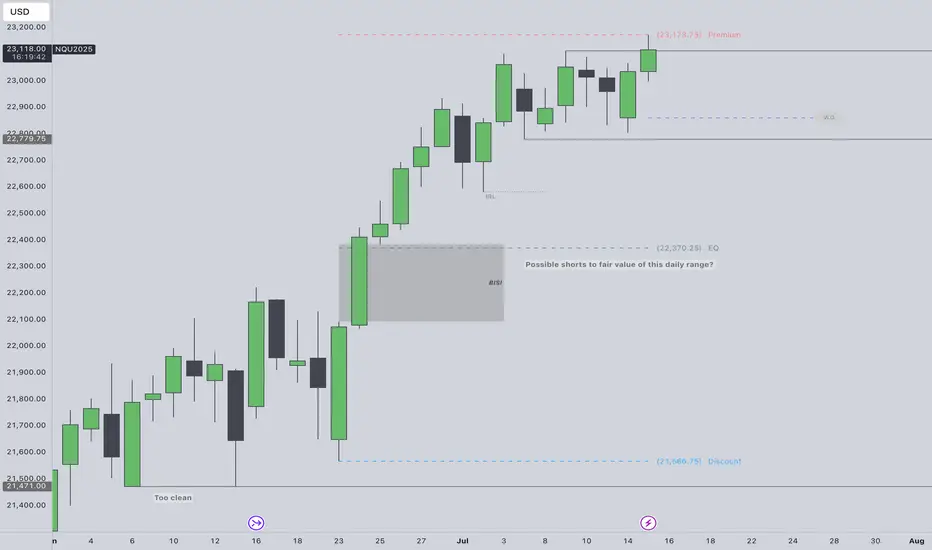
To fade all time highs or not?Not trying to fade ATH run but the SSL in this daily range looks too obvious to me. Super premium.
Price was in a consolidation July 7th - 14th. Took external range high today. I really could see shorts playing out if theres a intraweek reversal confirmed after purging the ERH.
Would need to see 1h CISD confirm intraweek reversal to the downside then trade the daily continuation lower targeting 22,779, 22,578 & EQ of the range at 22,370. Also, the daily BISI that needs sellside delivery.
CPI scheduled this week. PPI following.
NQ1! trade ideas
MNQ LongDont have the time to explain much on what is going on for this chart.
I think there is a good chance for a long position, but we will see

MNQ at the Supply Buffet. Will It Eat or SpitMNQ is hovering just under local highs after a textbook rally into a potential supply shelf. Price is compressing into a wedge between short-term resistance and dynamic trend line support. This is where the market reveals its hand either we break clean and run, or we roll over and unwind the entire move.
Here’s my full breakdown including swing entries, scalp options, confluence layers, and what I’m watching through the Tokyo, London, and NY sessions.
Primary trend: Bullish
Current condition: Compression under resistance (23,100 zone)
Market posture: Still within the ascending channel, but showing signs of indecision
We’re stacked on top of well-respected demand levels and riding a well-tested trend line. But price has now spent 5 sessions ranging just under short-term supply, and that opens up both breakout and breakdown scenarios depending on how it reacts in this key zone.
BULLISH SCENARIO — Trend Continuation
This play assumes the channel holds and buyers defend the 22,700 breaker block.
Primary Entry: 22,700 (Key reclaim level / breaker block)
Aggressive Entry: 22,950 (early reaction from structure front-run)
TP1: 23,500 (equal highs and channel extension)
TP2: 24,000 (clean trend extension target)
SL: 22,000 (below trend line and deep value failure)
Confluences:
Breaker block support from July 3 demand leg
Anchored VWAP from July 7 sits just above entry zone
Perfect alignment with channel midpoint and dynamic support
Buyers defended 22,700 multiple times during NY and London sessions
Macro still favouring tech risk-on
This is the continuation play. If 22,700 holds, I expect a swift push through supply with high reward potential.
BEARISH SCENARIO — Structural Breakdown
This play assumes the trend line and 22,700 level give way, confirming a change in structure.
Trigger: Clean 15m or 30m close below 22,700 and no buyer reclaim
Entry on Retest: 22,680–22,700 zone after breakdown
TP1: 22,200 (mid-trend demand base)
TP2: 21,900 (deep value demand zone)
SL: Above 22,800 (back inside structure = idea invalid)
Confluences:
Overhead supply has held 4+ sessions
Multiple liquidity sweeps above 23,100 with no follow-through
Momentum divergence + distribution signs on 5m-15m
London session often traps longs just before breakdowns
This isn’t about calling tops it’s about recognising when support fails. If 22,700 goes, the dominoes start falling.
Scalper Setup (Tokyo/London Focus)
For intraday traders hunting reactive entries with tight stops.
Short Idea:
Setup: Price sweeps into 23,090–23,130 zone during low liquidity (Tokyo/London premarket)
Trigger: Rejection wick or bearish engulfing on 5m–15m
TP: 22,950 or 22,700
SL: 23,150
Long Idea:
Setup: Quick drop into 22,950–22,900 front-run zone (pre-NY)
Trigger: Bullish engulfing or delta flip
TP: 23,100–23,200
SL: 22,850
Chart Structure Summary:
23,090–23,130 Short-Term Supply, Resistance shelf, range ceiling
22,700–22,750 Breaker Block Key structure to hold for bulls
22,200–22,400 Mid Demand Base, Trend structure, good R/R long
21,900–22,050 Deep Value Demand, Swing long zone, last line for bulls
Strategy Notes:
Use 15m for structure, 5m for entry, and 1H to confirm trend
Volume delta and order flow helps confirm traps/sweeps
Watch VWAP if price holds above, bias remains up
Don’t trade blindly into supply without confirmation let it reject or break
This isn’t just a supply test it’s a decision point for the next 300+ ticks.
The market is either:
Absorbing above demand and about to explode, or slowly distributing before a trend break.
As always don’t marry a bias. Let the levels do the talking. React, don’t predict. Let me know in the comments how you’re planning to play this.

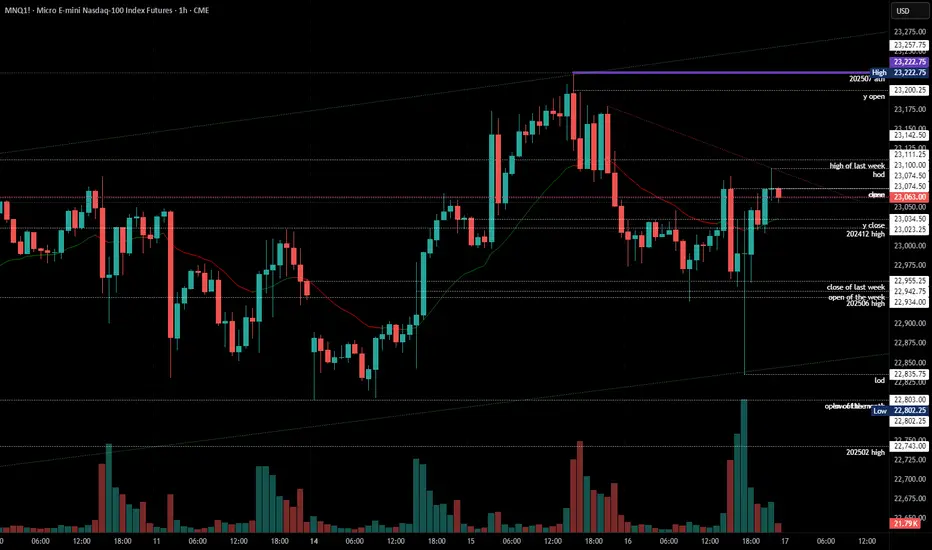
NQ Weekly Recap-Projection 13.07.2025NQ Weekly Recap + Outlook
1️⃣ Recap:
NQ made a new All-Time High, but the breakout ended up being a deviation. Price got rejected and started pulling back.
This signals potential weakness and suggests price may want to explore lower levels.
2️⃣ Bearish Scenario:
📍Target: Daily Swing low (Blue line)
📍Deeper target: Weekly Fair Value Gap (Purple zone)
I’ll look for LTF confirmations around these zones to position for potential longs.
3️⃣ Bullish Catalyst Watch:
There’s increasing speculation that Powell may resign this week.
If that happens, we could see:
✅ Strong bullish momentum
✅ Little to no retracement
✅ Immediate push into new ATHs
Weekly Plan Summary:
🔸 Scenario 1 - Pullback Continuation:
Look for reactive long setups at Daily Swing or W FFVG zone.
🔸 Scenario 2 - Powell Resignation:
Expect a breakout move with momentum — potentially no retrace.
Stay nimble. Trade what the chart confirms, not what the news promises.

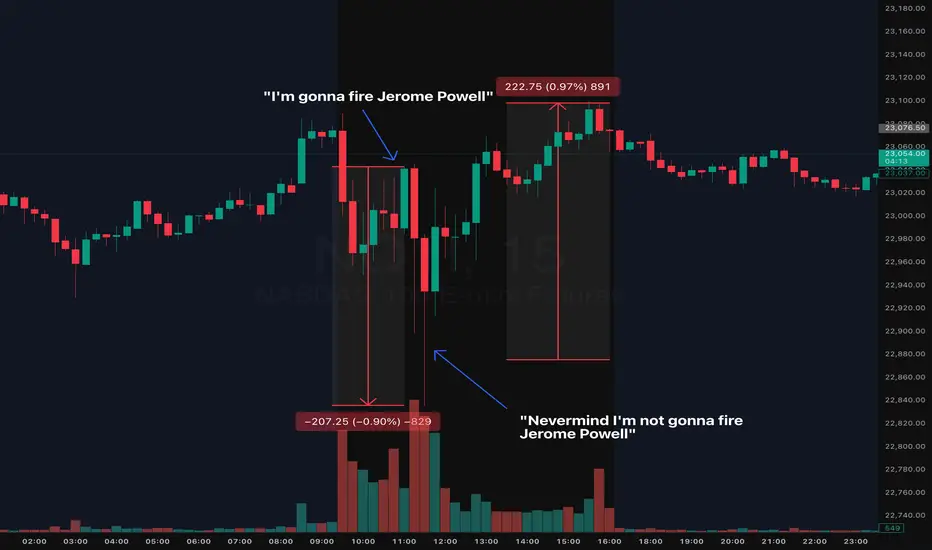
2025 Trading Final Boss: Daily Market Manipulation, The New NormMarking this point in history because we'll likely forget and move on.
During the early hours of the July 16th NYC session, we saw indices quickly flush ( CME_MINI:NQ1! CME_MINI:ES1! ) nearly 1% on the news that Trump will fire Jerome Powell. The dip was bought almost instantly.
Shortly after the dip was bought (roughly 0.50% recovery), guess what? Trump announced, he is "not considering firing Jerome Powell". The dip then recovered and achieved a complete V to finish the day somewhat green. Make what you want of it but always use a stop loss in these tough conditions.
Welcome to 2025 Trading Final Boss
NQ Power Range Report with FIB Ext - 7/17/2025 SessionCME_MINI:NQU2025
- PR High: 23072.00
- PR Low: 23031.25
- NZ Spread: 91.25
Key scheduled economic events:
08:30 | Initial Jobless Claims
- Retail Sales (Core|MoM)
- Philadelphia Fed Manufacturing Index
Session Open Stats (As of 12:35 AM 7/17)
- Session Open ATR: 274.88
- Volume: 18K
- Open Int: 268K
- Trend Grade: Neutral
- From BA ATH: -0.8% (Rounded)
Key Levels (Rounded - Think of these as ranges)
- Long: 23239
- Mid: 21525
- Short: 20383
Keep in mind this is not speculation or a prediction. Only a report of the Power Range with Fib extensions for target hunting. Do your DD! You determine your risk tolerance. You are fully capable of making your own decisions.
BA: Back Adjusted
BuZ/BeZ: Bull Zone / Bear Zone
NZ: Neutral Zone
2025-07-16 - priceactiontds - daily update - nasdaqcomment: Bond markets are going ballistic. Fun times ahead. Technically it’s a trading range under ath and bears are too weak to print any decent bear bar on the daily tf.
current market cycle: bull trend
key levels: 22600 - 23300
bull case: Bulls are might fine. No daily bar is closing on it’s low and we are printing bull bar after bull bar. Daily 20ema is around 22700 and as long as we stay above, bulls remain in full control. Not event imminent firing of JPow and the bond market implosion are stopping this. Truly astonishing.
Invalidation is below 22700.
bear case: Bears are pathetic. Need lower lows below 22770. That’s it. Even if we get them, daily 20ema should be support unless an event triggers big time.
Invalidation is above 23300.
short term: Neutral. Bears barely doing anything but I have no interest in buying this frenzy, given the risks we are facing. We will go down hard soon but right now nothing about this is bearish. I do think the only bearish scenario could be that Jpow resigns/gets fired tomorrow/Friday and we drop down hard to next big support around 22000. I’d be surprised if we could get that low tbh.
medium-long term - Update from 2024-06-29: No change in plans. I expect 20000 to get hit over the next 3 months and maybe 19000 again.
trade of the day: Short US open was my preferred trade today but stop had to be 23223, so far away and target was not all that big since 23000 was the obvious support. The drop down to 22835 was a bit much but given the news, it could have easily led to a much bigger sell-off if the markets weren’t ignoring literally every risk under the sun.
Market Watch UPDATES! Stock Indices, Gold, Silver, US OILWelcome to the Market Watch Updates for Monday, July 14th.
In this video, we will give the forecast updates for the following markets:
S&P500, NASDAQ, DOW JONES, GOLD, SILVER and US OIL.
Enjoy!
May profits be upon you.
Leave any questions or comments in the comment section.
I appreciate any feedback from my viewers!
Like and/or subscribe if you want more accurate analysis.
Thank you so much!
Disclaimer:
I do not provide personal investment advice and I am not a qualified licensed investment advisor.
All information found here, including any ideas, opinions, views, predictions, forecasts, commentaries, suggestions, expressed or implied herein, are for informational, entertainment or educational purposes only and should not be construed as personal investment advice. While the information provided is believed to be accurate, it may include errors or inaccuracies.
I will not and cannot be held liable for any actions you take as a result of anything you read here.
Conduct your own due diligence, or consult a licensed financial advisor or broker before making any and all investment decisions. Any investments, trades, speculations, or decisions made on the basis of any information found on this channel, expressed or implied herein, are committed at your own risk, financial or otherwise.

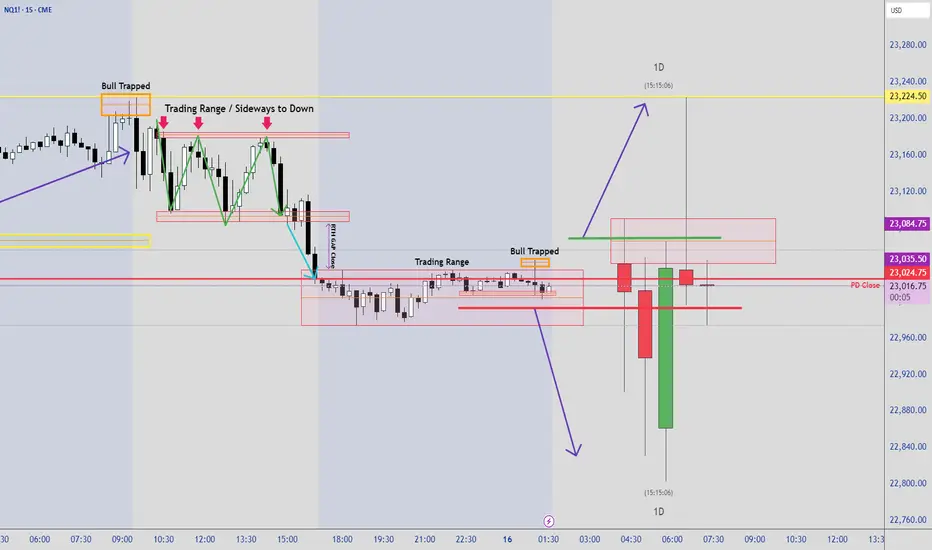
2nd Leg Down Likely on the DailyNews impact yesterday pushes the market higher only to reverse throughout the day. A retest of swing low is expected for a bearish continuation. With another news coming, perhaps a minor pullback then chop and drop.
NQ Power Range Report with FIB Ext - 7/16/2025 SessionCME_MINI:NQU2025
- PR High: 23034.25
- PR Low: 22973.75
- NZ Spread: 135.5
Key scheduled economic events:
08:30 | PPI
10:30 | Crude Oil Inventories
AMP margins raised overnight for expected PPI volatility
Session Open Stats (As of 12:25 AM 7/16)
- Session Open ATR: 277.22
- Volume: 27K
- Open Int: 277K
- Trend Grade: Neutral
- From BA ATH: -0.8% (Rounded)
Key Levels (Rounded - Think of these as ranges)
- Long: 23239
- Mid: 21525
- Short: 20383
Keep in mind this is not speculation or a prediction. Only a report of the Power Range with Fib extensions for target hunting. Do your DD! You determine your risk tolerance. You are fully capable of making your own decisions.
BA: Back Adjusted
BuZ/BeZ: Bull Zone / Bear Zone
NZ: Neutral Zone
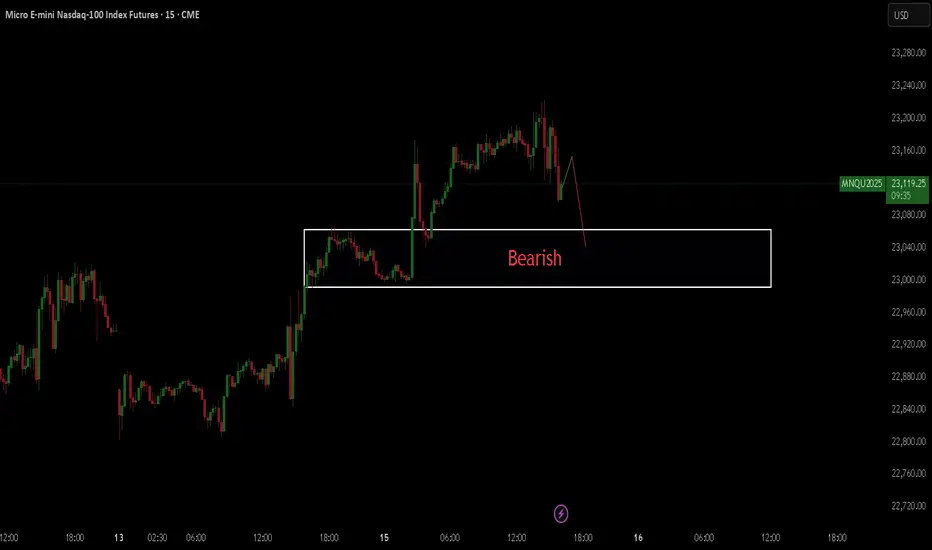
NASDAQ BEARISHHello, with my skills and my analysis I see that the Nasdaq market has a good chance of falling.
$NQ Supply and Demand Zones 7/15/25This for sharing my S/D zones for SEED_ALEXDRAYM_SHORTINTEREST2:NQ specifically.
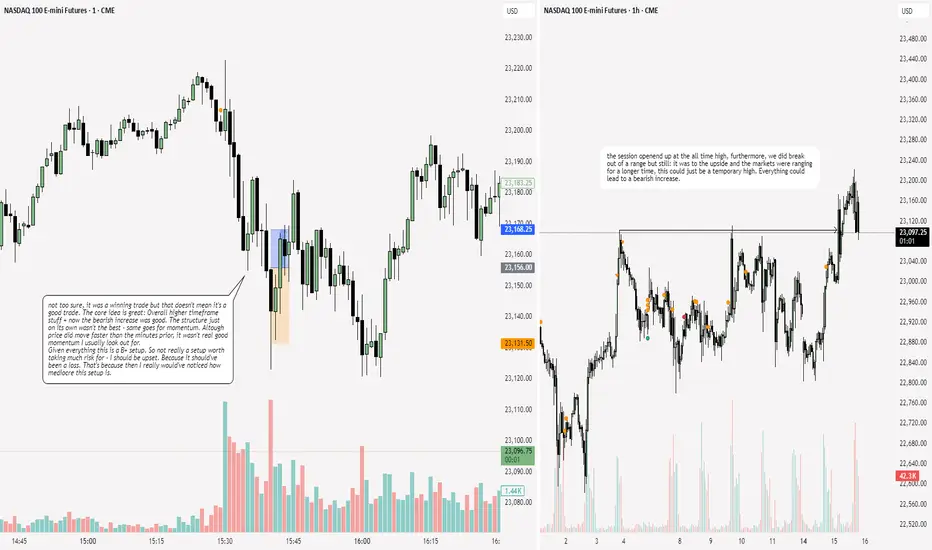
NQ: 218th trading session - recapYeaaa although I did make $2,000 profits it wasn't the best thing ever. I mean I gotta cut myself some slack: The higher timeframe bias was pretty good. And the structure wasn't too shabby. It really was the momentum that turned an A+/S tier setup into a B+ setup which is a HUGE jump.
NQ Power Range Report with FIB Ext - 7/15/2025 SessionCME_MINI:NQU2025
- PR High: 23036.00
- PR Low: 23000.00
- NZ Spread: 80.5
Key scheduled economic events:
08:30 | CPI (Core|MoM|YoY)
Asian hours vol spike breakout swing into new ATHs
Session Open Stats (As of 12:15 AM 7/15)
- Session Open ATR: 290.39
- Volume: 42K
- Open Int: 276K
- Trend Grade: Neutral
- From BA ATH: -0.3% (Rounded)
Key Levels (Rounded - Think of these as ranges)
- Long: 23239
- Mid: 21525
- Short: 20383
Keep in mind this is not speculation or a prediction. Only a report of the Power Range with Fib extensions for target hunting. Do your DD! You determine your risk tolerance. You are fully capable of making your own decisions.
BA: Back Adjusted
BuZ/BeZ: Bull Zone / Bear Zone
NZ: Neutral Zone
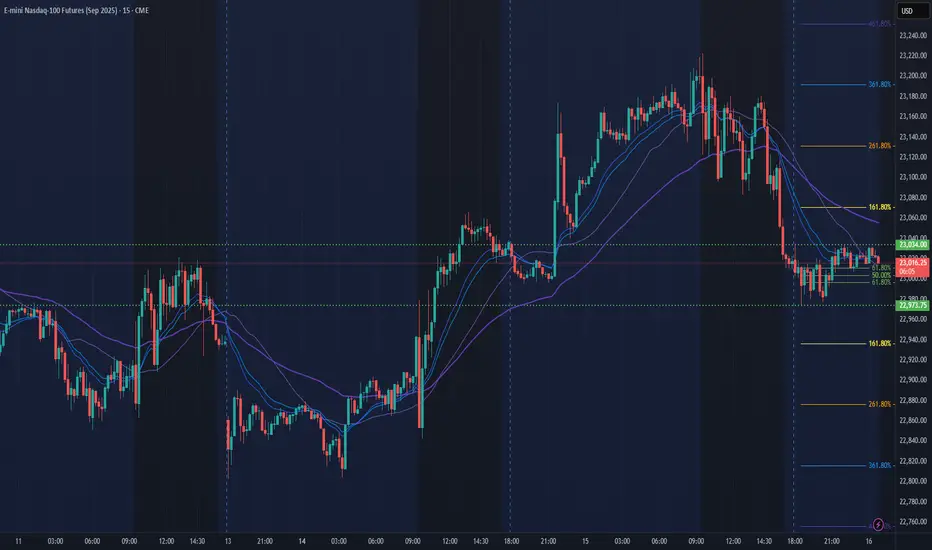
NASDAQ Futures: Consolidation Signals Potential Bearish Trend NeCurrent Price: 22959.0
Direction: SHORT
Targets:
- T1 = 22400
- T2 = 22200
Stop Levels:
- S1 = 23150
- S2 = 23320
**Wisdom of Professional Traders:**
This analysis synthesizes insights from thousands of professional traders and market experts, leveraging collective intelligence to identify high-probability trade setups. The wisdom of crowds principle suggests that aggregated market perspectives from experienced professionals often outperform individual forecasts, reducing cognitive biases and highlighting consensus opportunities in NASDAQ Futures.
**Key Insights:**
NASDAQ Futures are currently consolidating after reaching new highs earlier this quarter. This period of range-bound activity is marked by a decreasing daily trading range, suggesting market indecision among investors. The emergence of lower highs and lower lows in recent sessions signals a potential bearish momentum in the near term, with key support levels being monitored closely.
Additionally, macroeconomic factors such as global geopolitical tensions and tariff developments are contributing to investor caution. Recent data highlights the sensitivity of this asset to broader market sentiment. A break below key support might further solidify bearish sentiment, creating downside momentum.
**Recent Performance:**
In recent weeks, NASDAQ Futures rallied to achieve an all-time high but have since moved into a phase of consolidation. Price action has narrowed considerably, with the daily range contracting to 158 points from 192 points, reflecting decreasing volatility. The consolidation reflects growing caution in the market amidst an environment of tightening economic conditions and continued uncertainty.
**Expert Analysis:**
Market analysts have pointed out that consolidation following a strong rally is not uncommon. However, technical indicators are showing early signs of weakness. NASDAQ Futures currently trade near critical support levels aligned with the 50-day simple moving average (SMA). A breakdown below these levels could trigger a more significant correction to the downside. Resistance at $23,200 remains strong, and the inability to breach this level confirms bearish sentiment. Furthermore, a lack of supportive macroeconomic catalysts could prolong this period of weak momentum or further amplify the downside risks.
**News Impact:**
Recent market news includes heightened geopolitical tensions and the continued ripple effects of economic tariffs. These developments have dampened sentiment across equity markets, contributing to heightened caution and consolidation trends. Investors should carefully analyze updates on these fronts, as any resolution or escalation has the potential to swing markets significantly.
**Trading Recommendation:**
Given the consolidation observed in the NASDAQ Futures and the emerging signs of bearish momentum, a short position with targets at $22,400 and $22,200 is recommended. This setup is aligned with technical indicators and key macroeconomic concerns currently influencing market dynamics. Stop levels are set at $23,150 and $23,320 to manage risk in case of unexpected bullish reversals.

NASDAQ: Time For A Pullback?In this Weekly Market Forecast, we will analyze the NASDAQ for the week of July 14 - 18th.
The NASDAQ had a strong week, until Tariff Tensions Friday arrived.
This by itself doesn't mean we should start looking for sells. Just like the S&P 500, I'm expecting short term bearishness, as price goes from ERL to IRL.
With Tuesday CPI Data coming, this short term consolidation is to be expected until the news is announced.
Let the markets pick a direction, and flow with it.
Have a plan of action in place so you can react to the price action promptly!
Enjoy!
May profits be upon you.
Leave any questions or comments in the comment section.
I appreciate any feedback from my viewers!
Like and/or subscribe if you want more accurate analysis.
Thank you so much!
Disclaimer:
I do not provide personal investment advice and I am not a qualified licensed investment advisor.
All information found here, including any ideas, opinions, views, predictions, forecasts, commentaries, suggestions, expressed or implied herein, are for informational, entertainment or educational purposes only and should not be construed as personal investment advice. While the information provided is believed to be accurate, it may include errors or inaccuracies.
I will not and cannot be held liable for any actions you take as a result of anything you read here.
Conduct your own due diligence, or consult a licensed financial advisor or broker before making any and all investment decisions. Any investments, trades, speculations, or decisions made on the basis of any information found on this channel, expressed or implied herein, are committed at your own risk, financial or otherwise.

NQ: 224th trading session - recapWasn't too focused today which is definitely not good. Atleast there wasn't any big setup today. But still, shouldn't happen
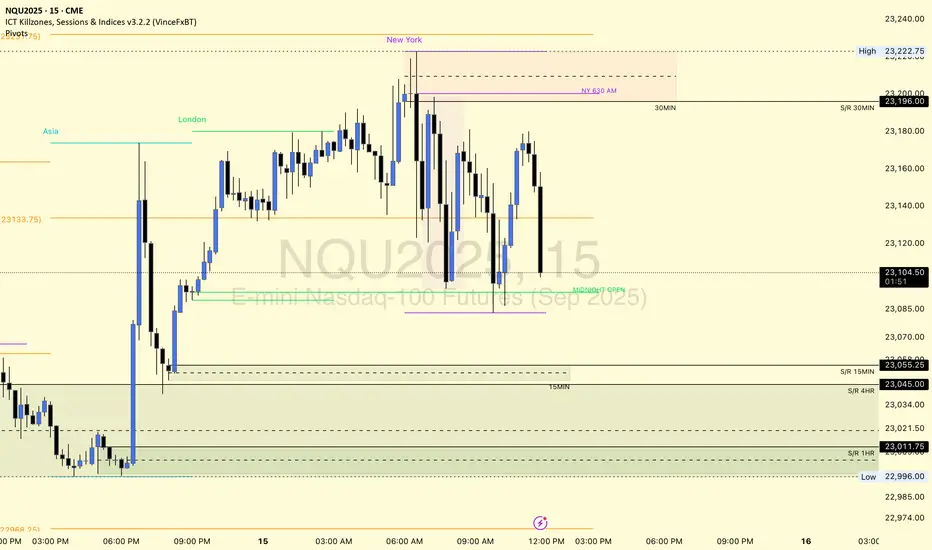
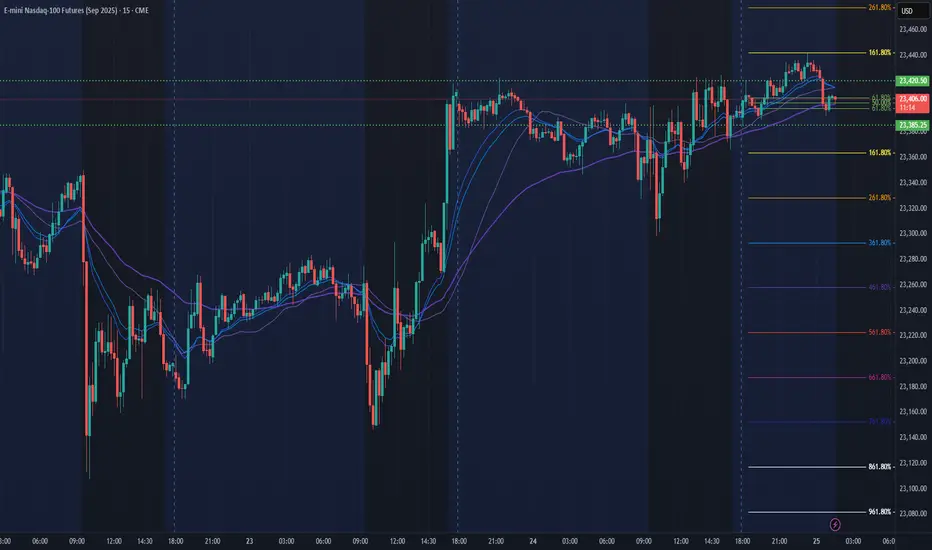
NQ potential short setupGlobex High Sweep Setup : Price tagged the overnight high. Liquidity hunt likely before rejection.
Double Top Reversal : Classic short trigger with weakening momentum.
CVD and price: Price and CVD making higher highs — bullish pressure?
STRAT 3-1-2 Setup : Breakout above internal bar range could flip bias long.
Update after posting the chart: As this is a contrarian trade, please wait for short entry confirmation. The market is quite bullish, and a move down might be quite bumpy, with expected stop runs. Market has already run past the double top with huge bullish movement. The market has already run past the double top with a bullish moment.
The next point of reversal could be at the daily pivot R1 at 23,435.25.

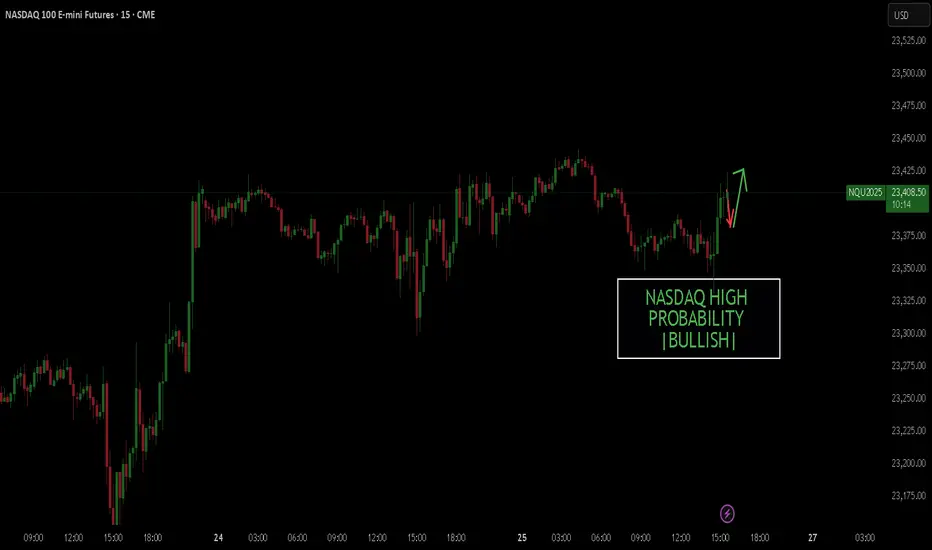
NASDAQ BULLISHHello, I hope you are well today. I just noticed that the Nasdaq could be starting a new bullish trend with an 85% probability.

NQ Power Range Report with FIB Ext - 7/25/2025 SessionCME_MINI:NQU2025
- PR High: 23420.50
- PR Low: 23385.00
- NZ Spread: 79.5
Key scheduled economic events:
08:30 | Durable Goods Orders
Session open ATH break and retrace
Session Open Stats (As of 12:45 AM 7/25)
- Session Open ATR: 248.86
- Volume: 20K
- Open Int: 274K
- Trend Grade: Long
- From BA ATH: -0.0% (Rounded)
Key Levels (Rounded - Think of these as ranges)
- Long: 23811
- Mid: 22096
- Short: 20383
Keep in mind this is not speculation or a prediction. Only a report of the Power Range with Fib extensions for target hunting. Do your DD! You determine your risk tolerance. You are fully capable of making your own decisions.
BA: Back Adjusted
BuZ/BeZ: Bull Zone / Bear Zone
NZ: Neutral Zone
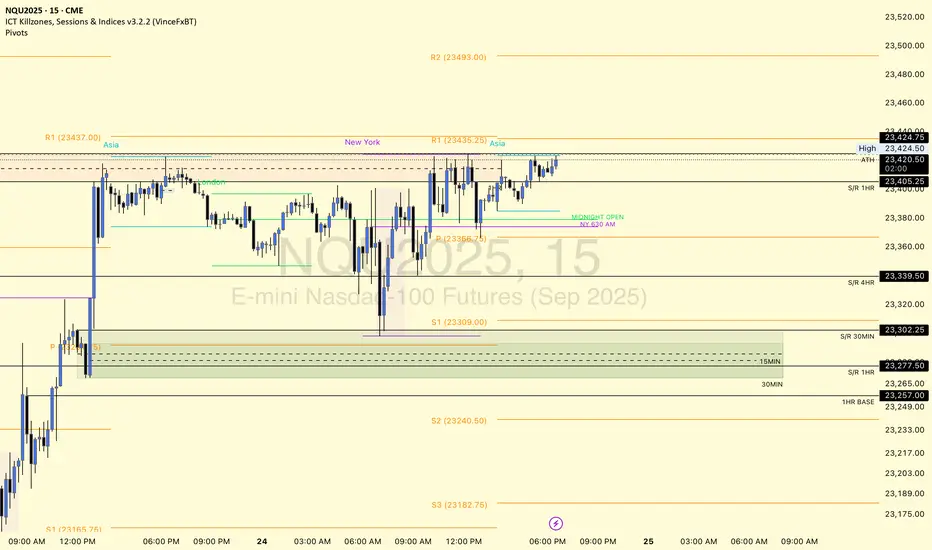
$NQ SUPPLY AND DEMAND ZONES 7/24/25www.tradingview.com
This is SEED_ALEXDRAYM_SHORTINTEREST2:NQ chart for my YouTube community.
Intrigued to see if we sweep for a new ATH or a rejection to test demand levels below.
With a new ATH, gotta wait for more S/D S/R levels to be created.
Will resort to imbalance playbook or S/R play until then.
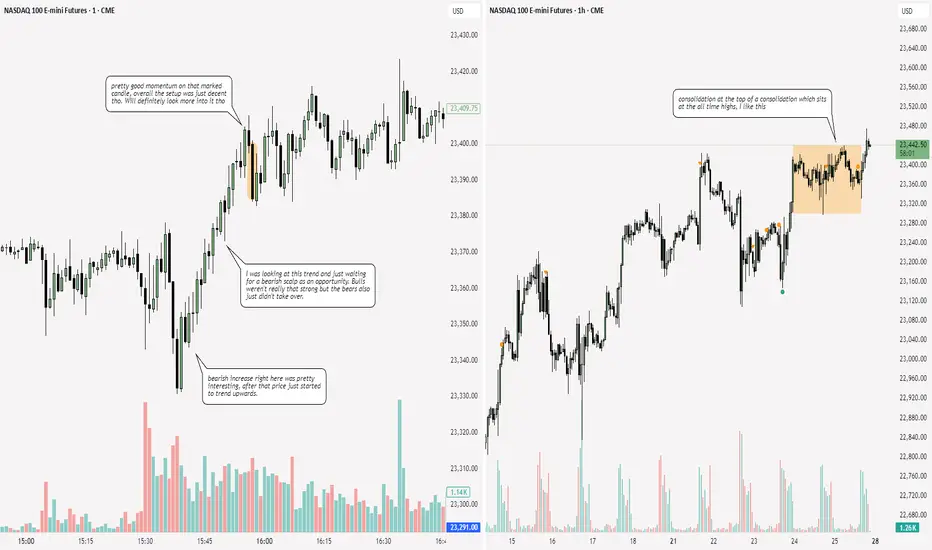
NQ: 223rd trading session - recapThis is yesterdays session! I did not trade today, I was busy. I will trade tomorrow and I'll also active my XFA account tmrw
