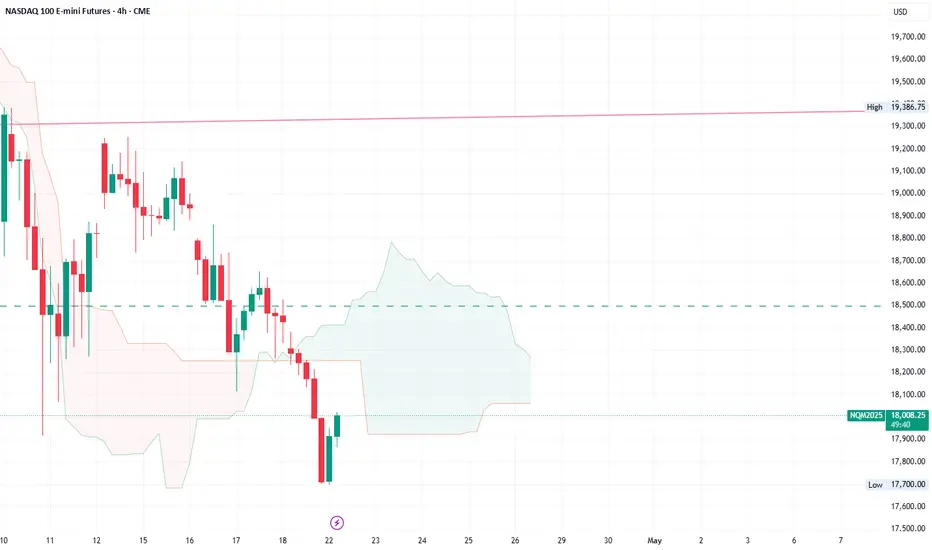
2025-04-23 - priceactiontds - daily update - nasdaqnasdaq e-mini futures
comment: Until bears close the gap down to 18500, this is bullish, no doubt about it. I just think that we have seen 3 legs up and we are at big resistance. There is a chance that we have see the high today for this bull leg in what is likely a bigger trading range or still a very small chance of the continuation of the bear trend. Tomorrow will likely be key for this week. If we find acceptance above 18700, no reason not to run all the stops up to 19400. Below 18700 last chance for the bulls is defending the bull gap 21600 and below we go down hard again.
current market cycle: trading range, triangle on the daily chart - that is dead once we go above 19400
key levels: 17800 - 19500
bull case: Bulls want to test the 50% retracement and run all the stops up to 19500. That is the only price that matters for them. That would mean we are making higher highs again and this bear trend is over for good. There really isn’t much more to it right now. Bulls just can’t let the market fall below 18600 or today’s rally was indeed the bull trap I expect it to be.
Invalidation is below 18600.
bear case: Bears want a lower high below 19388 and continue inside the triangle. If they can make lower lows again, the momentum would be dead and only really good news could help the bulls. Right now I prefer the triangle structure we are in and favoring the bears to trade back down to at least 18400 tomorrow/Friday. Above 19000 I don’t think many bears will hold short and hope that 19165 remains resistance.
Invalidation is above 19000/19170.
short term: Neutral at 18900. Bearish only below 18700 and how strong the move is. Bullish above 19000 for 19165 retest and maybe much higher to 19500.
medium-long term - Update from 2024-04-20: My most bearish target for 2025 was 17500ish, given in my year-end special. We had the clear W1 and W3 but now it’s messy.
Only a big tariff agreement news can move the markets and that can go either way. You have no edge in guessing what will happen, so having huge swing positions right now does not make much sense. If earnings go bad, we will go much lower. What is the next big support to be hit? The lows of 2022 at 12565. Can we really get there? With a deep recession and some bigger failings, sure but for now it’s unrealistic to expect it.
trade of the day: Long since Globex open but the selling above 19100 was a big warning and then market let the bulls out with a higher high but that was is. Easiest move was either holding long on Globex open or buying the double bottom 18630 with stop below the gap down to 18400ish.
NQ1! trade ideas

NQ Range (04-23-25)NAZ "Triangle of Churn", all Overnight with some Reg Session today. Seems more like knee jerk strength in low volume (or zero volume) zones. The U Turn off 17,750 was #39 or 40 since 1/22. The 2 Blue lines (upper) 2025 open price and (lower) 2024's. Danger Zones avoided, again (dash line channel below). 19,300 1st Short Zone, NAZ staying under or hitting with rejection may send it back for retest of DZ. 1,000 point days, we can be there by morning. Upper yellow bullseye may be for the Friday-Monday Long play should we pass 19,300. Seems manufactured a bit. Still viewing as insignificant noise/churn until we retest below hard and hold.

NQ: 176th trading session - recapYea, I stopped trading after 7 minutes. Really unfortunate. Pretty disappointed. But well, it is what it is.

NASDAQ analysis 03/100My analysis video on nasdaq 100 futures. This is in continuation with the past two videos.

X3: FUTURES NQ SCALP 1:1 Pending OrderFUTURES NQ SCALP 1:1FUTURES NQ SCALP 1:1 Pending Order
Risking 1% to make 1%
If price comes down and long not triggered: cancel it, I will update in comment.
NAS100, US100, NQ, NASDAQ short for day trade, with my back testing of this strategy, it hits multiple possible take profits, manage your position accordingly.
Risking 1% to make 1%
Use proper risk management
Looks like good trade.
Lets monitor.
Use proper risk management.
Disclaimer: only idea, not advice

MNQ!/NQ1! Day Trade Plan for 04/22/2025MNQ!/NQ1! Day Trade Plan for 04/22/2025
📈18210 18365
📉17910 17760
Thanks to all my followers! Truly appreciate the support!
Please like and share for more NQ levels Tues & Thurs 🤓📈📉🎯💰
*These levels are derived from comprehensive backtesting and research and a quantitative system demonstrating high accuracy. This statistical foundation suggests that price movements are likely to exceed initial estimates.*


NQ KEY ICT LEVELS - 23rd APRIL 2025Levels marked on the chart using my free indicator which marks out all of the ICT key levels which can be used for potential POIs where price might react

NQ KEY LEVELS - 23rd APRIL 2025Key levels marked by using low volume nodes for potential key levels where we may see price react.

NQ Power Range Report with FIB Ext - 4/23/2025 SessionCME_MINI:NQM2025
- PR High: 18771.75
- PR Low: 18644.00
- NZ Spread: 285.75
Key scheduled economic events:
09:45 | S&P Global Manufacturing PMI
- S&P Global Services PMI
10:00 | New Home Sales
10:30 | Crude Inventories
Major +1.5% session gap, unfilled to 18400
Session Open Stats (As of 12:15 AM 4/23)
- Session Open ATR: 752.66
- Volume: 58K
- Open Int: 241K
- Trend Grade: Bear
- From BA ATH: -17.4% (Rounded)
Key Levels (Rounded - Think of these as ranges)
- Long: 20954
- Mid: 19246
- Short: 16963
Keep in mind this is not speculation or a prediction. Only a report of the Power Range with Fib extensions for target hunting. Do your DD! You determine your risk tolerance. You are fully capable of making your own decisions.
BA: Back Adjusted
BuZ/BeZ: Bull Zone / Bear Zone
NZ: Neutral Zone

NQ: 175th trading session - recapRather good session today, good pre-market prep. However, I was a bit too tired which is obviously not good. But I walso don't want to put too much caffeine into my body that can't be healthy.
Also, take every clue you get as indication on what might happen. I know that you want "the range to break/ the pullback to continue", but if it simply doesn't do those things then take that as negative consolidation.

X3: FUTURES NQ SCALP 1:1 Pending OrderFUTURES NQ SCALP 1:1FUTURES NQ SCALP 1:1 Pending Order
Risking 1% to make 1%
If price comes down and long not triggered: cancel it, I will update in comment.
NAS100, US100, NQ, NASDAQ short for day trade, with my back testing of this strategy, it hits multiple possible take profits, manage your position accordingly.
Risking 1% to make 1%
Use proper risk management
Looks like good trade.
Lets monitor.
Use proper risk management.
Disclaimer: only idea, not advice


AMT Strat - 4/22/25 Morning TradeV-recovery from yesterday, we are building up good support. We go to PWL level/current POC, we see that strong reversal off of the middle line anchored VWAP, we are now targeting previous days POC.


NQ KEY ICT LEVELS - 22nd APRIL 2025Levels marked on the chart using my free indicator which marks out all of the ICT key levels which can be used for potential POIs where price might react

NQ KEY LEVELS - 22nd APRIL 2025Key levels marked by using low volume nodes for potential key levels where we may see price react.

NQ Power Range Report with FIB Ext - 4/22/2025 SessionCME_MINI:NQM2025
- PR High: 17934.25
- PR Low: 17863.75
- NZ Spread: 157.5
No key scheduled economic events
Rollover to 17700 inventory
- Responding above previous session close, beginning inside print
Session Open Stats (As of 12:45 AM 4/22)
- Session Open ATR: 744.58
- Volume: 42K
- Open Int: 242K
- Trend Grade: Bear
- From BA ATH: -20.6% (Rounded)
Key Levels (Rounded - Think of these as ranges)
- Long: 20954
- Mid: 19246
- Short: 16963
Keep in mind this is not speculation or a prediction. Only a report of the Power Range with Fib extensions for target hunting. Do your DD! You determine your risk tolerance. You are fully capable of making your own decisions.
BA: Back Adjusted
BuZ/BeZ: Bull Zone / Bear Zone
NZ: Neutral Zone


Nasdaq (NQ1!) Weekly Chart Analysis – What’s Next? (Week 16)📌 Title:
NASDAQ – 18,000 Holding, But Downside Risk Remains
Review of Last week's outlook:
I said that buying between 18,600 and 18,700 on the 12-hour chart would be reasonable,
but if a 12-hour candle closed below 18,500, it would be a major warning signal.
That strategy was valid at least until Tuesday.
But then three more 12-hour candles formed,
and Tuesday's closing price was 18,938.
The market opened Wednesday with a gap down at 18,790.
Looking at the chart at that time,
price had dropped below the 200-day line on the 2-day chart,
and the 12-hour chart was also not looking good.
So the strategy of buying near 18,600 on the 12-hour chart was no longer valid.
I had mentioned that if a 12-hour candle closed below 18,500,
it could get very dangerous.
And on the 4-hour chart, I had suggested short-term scalping was possible in the low 18,000s.
As expected, there was one bounce from that level,
but the price continued to fall after that.
📋 Description:
Now, NASDAQ is currently hovering near 18,000.
Although volatility remains low, price action continues to drift lower with weak momentum on higher timeframes.
Key Technical Observations:
• 📉 Still inside the 5-day bullish Ichimoku cloud
• 📍 17,000 = Bottom of the Bi-weekly Kumo + 3D 200SMA
• 📍 16,500 = Previous swing low, potential double bottom area
• 📈 18,400 = Needs to be reclaimed by weekly close to consider range recovery
A clean break below 17,700 could open the path toward 17,000, and possibly lower.
For now, this is a watch-and-react zone not yet a clear buy or sell signal, but conditions are forming for the next move.
🔁 Bias: Neutral to Bearish
⏳ Strategy: Wait for confirmation at 17,700 or breakdown
How low will we go :)Market Outlook: How Low Can It Go? 🚨
As the market faces increasing uncertainty, with trade wars, inflation concerns, and even talks of war looming, many are wondering just how low the market can go. Looking at the long-term weekly chart of the NASDAQ 100, we can draw several important insights. 📉
The chart clearly highlights key retracement levels from previous cycles:
2000-2002 saw the market plummet by 83% from its peak 🔴.
2008-2009 experienced a 57% drop 🟠.
In the current cycle, we have already seen a 26% drop from the previous highs, and many are wondering if we will see 37% similar moves as past market corrections.
Looking ahead, key levels to watch include:
60% and 70% retracements from the peak 🟢.
The 83% drop level which historically signals massive corrections 🔵.
The 93% drop from the top, which mirrors the all-time low seen during previous major market crashes 🟣.
The market has already shown signs of consolidation and increased volatility, with investors uncertain about the future direction. A possible recession or worsening economic conditions could push us closer to these historically low levels, especially if inflation continues to rise and trade tensions worsen.
The chart suggests the potential for further downside in the short term, and we could see the market move closer to the COVID lows again if these macroeconomic issues persist. ⏳
But here’s the key question: Are we heading back to these deep levels, or is there a glimmer of hope for a recovery in the near future? Let us know your thoughts in the comments below! 👇
Stay tuned for more updates on how the market is reacting to these pressures. 📊
This chart provides a historical perspective on the NASDAQ’s behavior during past recessions and could help guide your trading strategies moving forward.
Shark News🦈
Let me know your thoughts in the comments below...

2025-04-21 - priceactiontds - daily update - nasdaqGood Evening and I hope you are well.
comment: Very good trend by the bears but the close was bad for them. Giant tail below this daily bar and if they can not keep the market from retracing more than this 50%, we could reverse this to test 18200+ again. If we stay below 18000, I heavily favor the bears but for now I’m rather neutral and assess where we are before EU opens tomorrow.
current market cycle: bear trend continues for now
key levels: 16000 - 18500
bull case: Bulls need to break above the 50% retracement for today and can then continue higher to test the upper bear channel line around 18300. Any tariff news could get us there but todays news were bad at best. Bulls don’t have much until they reverse this day and claim 18170 again.
Invalidation is below 17700.
bear case: Bears got the breakout below and are on their way of retesting the lows but they have the problem, that we have not seen two consecutive decent trend days since 3 weeks ago when we sold from 20000. So what are the odds of another strong bear day tomorrow? Very low. Best for bears would be, if they kept the market below the 50% pb from today below 17940. This would leave a giant open gap and increase the odds of continuation down. Right now the bear channel down is very broad and I don’t think many bears will hold above 18000 and a decent bar above the 1h 20ema. If today was indeed the acceleration of this potential W5, we should see another strong trend day tomorrow and go for 17000.
Invalidation is above 18050ish.
short term: Bearish if we stay below 18000. Right now channel is broad and could go up to 18300. 1h 20ema should be latest resistance by the bears or we will likely test 18200 or 18300. If we continue down, next support is 17400, then my measured move target around 17250 and below is 17000.
medium-long term - Update from 2024-04-20: My most bearish target for 2025 was 17500ish, given in my year-end special. We had the clear W1 and W3 but now it’s messy.
trade of the day: Short from Globex open.
