NQ1! 18/03/25Alongside the bullish bonds, I am supporting a rally on equities now especially since everyone is bearish now. After the daily SMT created last week, Price has now retraced back into discount (OTE) and previous week's wick consequent encroachment, Opened a long into the New Week Opening Gap.
NQ1! trade ideas

MNQ 9:30 Open Trade Idea 💡 Trade Idea shown live here, beautiful setup that was respected very nicely during the 9:30 open.
The area we pointed out on the previous video:
Where I stated price was likely trading up to fill in that FVG before dropping lower was respected perfectly. I was rendering the video above when it happened. Hence, why you see me enter late here.
I could have been more patient and waited to enter at the 50% of the bearish fvg level. But regardless, I was able to profit $31 and make back the $30 I was in drawdown for. Had this been NQ we would've made over $695 on this one trade.
This is teaching us discernment in our decision making and how to trust our bias and trade ideas.
We caught over 130 points on this one MNQ trade and the potential was over 400 points as shown on this video.
We were targeting the bullish 1h fvg and sellside liquidity (equal lows)
If you guys found this insightful give it a like and comment down below. I would also love to know if any of you guys would like me to share any specific ideas or go over anything in particular. Let me know!
Forex, Crypto and Futures Trading Risk Disclosure:
The National Futures Association (NFA) and Commodity Futures Trading Commission (CFTC), the regulatory agencies for the forex and futures markets in the United States, require that customers be informed about potential risks in trading these markets. If you do not fully understand the risks, please seek advice from an independent financial advisor before engaging in trading.
Trading forex and futures on margin carries a high level of risk and may not be suitable for all investors. The high degree of leverage can work against you as well as for you. Before deciding to trade, you should carefully consider your investment objectives, level of experience, and risk appetite.
There is a possibility of losing some or all of your initial investment, and therefore, you should not invest money that you cannot afford to lose. Be aware of the risks associated with leveraged trading and seek professional advice if necessary.
BDRipTrades Market Opinions (also applies to BDelCiel and Aligned & Wealthy LLC):
Any opinions, news, research, analysis, prices, or other information contained in my content (including live streams, videos, and posts) are provided as general market commentary only and do not constitute investment advice. BDRipTrades, BDelCiel, and Aligned & Wealthy LLC will not accept liability for any loss or damage, including but not limited to, any loss of profit, which may arise directly or indirectly from the use of or reliance on such information.
Accuracy of Information: The content I provide is subject to change at any time without notice and is intended solely for educational and informational purposes. While I strive for accuracy, I do not guarantee the completeness or reliability of any information. I am not responsible for any losses incurred due to reliance on any information shared through my platforms.
Government-Required Risk Disclaimer and Disclosure Statement:
CFTC RULE 4.41 - HYPOTHETICAL OR SIMULATED PERFORMANCE RESULTS HAVE CERTAIN LIMITATIONS. UNLIKE AN ACTUAL PERFORMANCE RECORD, SIMULATED RESULTS DO NOT REPRESENT ACTUAL TRADING. ALSO, SINCE THE TRADES HAVE NOT BEEN EXECUTED, THE RESULTS MAY HAVE UNDER-OR-OVER COMPENSATED FOR THE IMPACT, IF ANY, OF CERTAIN MARKET FACTORS, SUCH AS LACK OF LIQUIDITY. SIMULATED TRADING PROGRAMS IN GENERAL ARE ALSO SUBJECT TO THE FACT THAT THEY ARE DESIGNED WITH THE BENEFIT OF HINDSIGHT. NO REPRESENTATION IS BEING MADE THAT ANY ACCOUNT WILL OR IS LIKELY TO ACHIEVE PROFIT OR LOSSES SIMILAR TO THOSE SHOWN.
Performance results discussed in my content are hypothetical and subject to limitations. There are frequently sharp differences between hypothetical performance results and the actual results subsequently achieved by any particular trading strategy. One of the limitations of hypothetical trading results is that they do not account for real-world financial risk.
Furthermore, past performance of any trading system or strategy does not guarantee future results.
General Trading Disclaimer:
Trading in futures, forex, and other leveraged products involves substantial risk and is not appropriate for all investors.
Do not trade with money you cannot afford to lose.
I do not provide buy/sell signals, financial advice, or investment recommendations.
Any decisions you make based on my content are solely your responsibility.
By engaging with my content, including live streams, videos, educational materials, and any communication through my platforms, you acknowledge and accept that all trading decisions you make are at your own risk. BDRipTrades, BDelCiel, and Aligned & Wealthy LLC cannot and will not be held responsible for any trading losses you may incur.

Missed trade opportunity on MNQ due to Tight SLOnce again, we shifted sl too soon and got stopped out of a good trade. It was nice to see the outcome, it ended up tapping inside of that Volume imbalance once again before falling over quickly for the remaining sellside liqudity.
If my SL was kept at the highs we would've captured the whole move. This week I have been feeling a little tired and my birthday is this thursday guys!! lol I would hate to have a bad trading week on my BDAY 😢. I don't know if that's why I am being so cautious, I wanna enjoy my week. haha
Anyways, I will post any new trades if I get into another one. But I might call it here depending on where price is at after I post this video.
If you guys enjoyed this give it a like and share with your friends(:
Forex, Crypto and Futures Trading Risk Disclosure:
The National Futures Association (NFA) and Commodity Futures Trading Commission (CFTC), the regulatory agencies for the forex and futures markets in the United States, require that customers be informed about potential risks in trading these markets. If you do not fully understand the risks, please seek advice from an independent financial advisor before engaging in trading.
Trading forex and futures on margin carries a high level of risk and may not be suitable for all investors. The high degree of leverage can work against you as well as for you. Before deciding to trade, you should carefully consider your investment objectives, level of experience, and risk appetite.
There is a possibility of losing some or all of your initial investment, and therefore, you should not invest money that you cannot afford to lose. Be aware of the risks associated with leveraged trading and seek professional advice if necessary.
BDRipTrades Market Opinions (also applies to BDelCiel and Aligned & Wealthy LLC):
Any opinions, news, research, analysis, prices, or other information contained in my content (including live streams, videos, and posts) are provided as general market commentary only and do not constitute investment advice. BDRipTrades, BDelCiel, and Aligned & Wealthy LLC will not accept liability for any loss or damage, including but not limited to, any loss of profit, which may arise directly or indirectly from the use of or reliance on such information.
Accuracy of Information: The content I provide is subject to change at any time without notice and is intended solely for educational and informational purposes. While I strive for accuracy, I do not guarantee the completeness or reliability of any information. I am not responsible for any losses incurred due to reliance on any information shared through my platforms.
Government-Required Risk Disclaimer and Disclosure Statement:
CFTC RULE 4.41 - HYPOTHETICAL OR SIMULATED PERFORMANCE RESULTS HAVE CERTAIN LIMITATIONS. UNLIKE AN ACTUAL PERFORMANCE RECORD, SIMULATED RESULTS DO NOT REPRESENT ACTUAL TRADING. ALSO, SINCE THE TRADES HAVE NOT BEEN EXECUTED, THE RESULTS MAY HAVE UNDER-OR-OVER COMPENSATED FOR THE IMPACT, IF ANY, OF CERTAIN MARKET FACTORS, SUCH AS LACK OF LIQUIDITY. SIMULATED TRADING PROGRAMS IN GENERAL ARE ALSO SUBJECT TO THE FACT THAT THEY ARE DESIGNED WITH THE BENEFIT OF HINDSIGHT. NO REPRESENTATION IS BEING MADE THAT ANY ACCOUNT WILL OR IS LIKELY TO ACHIEVE PROFIT OR LOSSES SIMILAR TO THOSE SHOWN.
Performance results discussed in my content are hypothetical and subject to limitations. There are frequently sharp differences between hypothetical performance results and the actual results subsequently achieved by any particular trading strategy. One of the limitations of hypothetical trading results is that they do not account for real-world financial risk.
Furthermore, past performance of any trading system or strategy does not guarantee future results.
General Trading Disclaimer:
Trading in futures, forex, and other leveraged products involves substantial risk and is not appropriate for all investors.
Do not trade with money you cannot afford to lose.
I do not provide buy/sell signals, financial advice, or investment recommendations.
Any decisions you make based on my content are solely your responsibility.
By engaging with my content, including live streams, videos, educational materials, and any communication through my platforms, you acknowledge and accept that all trading decisions you make are at your own risk. BDRipTrades, BDelCiel, and Aligned & Wealthy LLC cannot and will not be held responsible for any trading losses you may incur.

Nasdaq Intraday TradeWith the overnight GAP, price jumped above the white Centerline, just to come back in the Asia session.
We see that price broke the white CL and halted afterwards. Do yo see where it halted? Yes, at the Centerline of the yellow Momentum Fork!
And currently it's pushing up through the white CL again...hmmm...
So, we have momentum, clear support at the yellow CL, a potential new push through the white CL and a loooooot of Air...and stop/losses above to be sucked in §8-)
I'm long with a stop below the yellow CL low, and with multiple targets to the upside.
Let's have fun!

ICTideal analysis for the day. as on 18 March 3rd where the Asia and London session made the SMT it is likely to hi the gap before providing the upside momentum.

NQ Power Range Report with FIB Ext - 3/18/2025 SessionCME_MINI:NQM2025
- PR High: 20066.50
- PR Low: 20033.25
- NZ Spread: 74.25
No key scheduled economic events
Rolled over to contract month M with near volume match with H
- Slight rotation above previous week high
- Fading inside previous session range, below the close
Session Open Stats (As of 12:55 AM 3/18)
- Session Open ATR: 476.01
- Volume: 26K
- Open Int: 144K
- Trend Grade: Neutral
- From BA ATH: -11.1% (Rounded)
Key Levels (Rounded - Think of these as ranges)
- Long: 22667
- Mid: 21525
- Short: 19814
Keep in mind this is not speculation or a prediction. Only a report of the Power Range with Fib extensions for target hunting. Do your DD! You determine your risk tolerance. You are fully capable of making your own decisions.
BA: Back Adjusted
BuZ/BeZ: Bull Zone / Bear Zone
NZ: Neutral Zone

My Trading mistakes 3.17.25This video was a prime example of good trades taken just poor management.
As you guys can tell from my dialog, I was clearly not level headed when it came to my decision making today. I was trying to follow ICT's commentary but I was getting confused as I was also trying to interpret it with my own understanding of the current levels on my charts.
As I stated in previous videos, I was feeling lots of anxiety and emotions today because I tend to go through that after a very good trading week. I feel like it's personal confidence after a good trading week gets affected due to me striving for perfection.
We see several mistakes in this trade, I was buying at premium levels, 19,750 - 19,798.50. Till ICT commented that he would not be long here (Thanks ICT, idk what i was thinking 😂 )
I then revised my idea and saw we had traded under the Bullish fvg from 9:51am, once price trades through it that is usually one of my favorite trades to take because price tends to react very quickly to those areas.
If you're right or wrong, you will find out quickly usually.
Once price reversed, I caught a beautiful trade of over 300 points, but because it was MNQ and I had already taken several losses from forcing my trades, I needed many more points to make back the money I had lost to prior trades.
This leads to a flawed thinking of mine, I tend to target trades over 300 - 600 points..
And the problem is that often times I will be right and catch those trades, but its unrealistic of me to always expect myself to catch these trades as not every trading day will present me those price moves.
So some things I have learned today through my trading mistakes and losses:
1. Place SL above the highs when I enter a trade (the volume imbalance tapping me out made me want to cry 😢 lol) sl was hit at 10:25am.
Plan of action, be more patient with my trades and if I enter a trade, trust it fully, calculate my risk and accept the trade for what it is.
2. We failed to take profit at the 9:30am lows. It was a clean profit, inside of the 1st presented FVG. I most definitely should have taken profits there, despite my trade entry being above where price traded to and continuing lower. I most likely would've not wanted to hold through the trade or might have trailed my sl past BE causing me to get stopped out with minimal profits.
Below is the trade where we can see we could've simply risked 40 points to mave over 300.
Its better to just take the profit at the liquidity area (the lows) and then watch to see if price will continue lower or reverse for learning purposes.
There is no need to always catch 300+ moves BRUNA. Come on. Lets keep it simple.
Anyways guys, this is my attempt of analyzing my mistakes today. I am wholeheartedly in this trading journey and I wanna share all the mistakes and losses and problems with you guys in hopes that if someone is also struggling with these issues, that you might learn from my mistakes and maybe learn something from my mark ups.
If you guys enjoy this type of content I would appreciate you guys giving it a like, share with your friends. There is more to come (:
Forex, Crypto and Futures Trading Risk Disclosure:
The National Futures Association (NFA) and Commodity Futures Trading Commission (CFTC), the regulatory agencies for the forex and futures markets in the United States, require that customers be informed about potential risks in trading these markets. If you do not fully understand the risks, please seek advice from an independent financial advisor before engaging in trading.
Trading forex and futures on margin carries a high level of risk and may not be suitable for all investors. The high degree of leverage can work against you as well as for you. Before deciding to trade, you should carefully consider your investment objectives, level of experience, and risk appetite.
There is a possibility of losing some or all of your initial investment, and therefore, you should not invest money that you cannot afford to lose. Be aware of the risks associated with leveraged trading and seek professional advice if necessary.
BDRipTrades Market Opinions (also applies to BDelCiel and Aligned & Wealthy LLC):
Any opinions, news, research, analysis, prices, or other information contained in my content (including live streams, videos, and posts) are provided as general market commentary only and do not constitute investment advice. BDRipTrades, BDelCiel, and Aligned & Wealthy LLC will not accept liability for any loss or damage, including but not limited to, any loss of profit, which may arise directly or indirectly from the use of or reliance on such information.
Accuracy of Information: The content I provide is subject to change at any time without notice and is intended solely for educational and informational purposes. While I strive for accuracy, I do not guarantee the completeness or reliability of any information. I am not responsible for any losses incurred due to reliance on any information shared through my platforms.
Government-Required Risk Disclaimer and Disclosure Statement:
CFTC RULE 4.41 - HYPOTHETICAL OR SIMULATED PERFORMANCE RESULTS HAVE CERTAIN LIMITATIONS. UNLIKE AN ACTUAL PERFORMANCE RECORD, SIMULATED RESULTS DO NOT REPRESENT ACTUAL TRADING. ALSO, SINCE THE TRADES HAVE NOT BEEN EXECUTED, THE RESULTS MAY HAVE UNDER-OR-OVER COMPENSATED FOR THE IMPACT, IF ANY, OF CERTAIN MARKET FACTORS, SUCH AS LACK OF LIQUIDITY. SIMULATED TRADING PROGRAMS IN GENERAL ARE ALSO SUBJECT TO THE FACT THAT THEY ARE DESIGNED WITH THE BENEFIT OF HINDSIGHT. NO REPRESENTATION IS BEING MADE THAT ANY ACCOUNT WILL OR IS LIKELY TO ACHIEVE PROFIT OR LOSSES SIMILAR TO THOSE SHOWN.
Performance results discussed in my content are hypothetical and subject to limitations. There are frequently sharp differences between hypothetical performance results and the actual results subsequently achieved by any particular trading strategy. One of the limitations of hypothetical trading results is that they do not account for real-world financial risk.
Furthermore, past performance of any trading system or strategy does not guarantee future results.
General Trading Disclaimer:
Trading in futures, forex, and other leveraged products involves substantial risk and is not appropriate for all investors.
Do not trade with money you cannot afford to lose.
I do not provide buy/sell signals, financial advice, or investment recommendations.
Any decisions you make based on my content are solely your responsibility.
By engaging with my content, including live streams, videos, educational materials, and any communication through my platforms, you acknowledge and accept that all trading decisions you make are at your own risk. BDRipTrades, BDelCiel, and Aligned & Wealthy LLC cannot and will not be held responsible for any trading losses you may incur.

MNQ!/NQ1! Day Trade Plan for 03/17/2025MNQ!/NQ1! Day Trade Plan for 03/17/2025
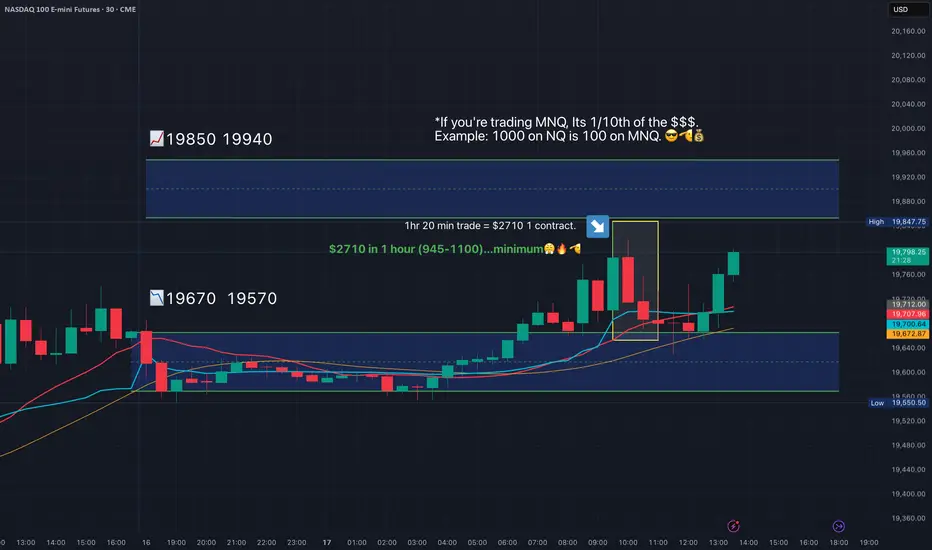
📈19850 19940
📉19670 19570
Like and share for more daily NQ levels 🤓📈📉🎯💰
*These levels are derived from comprehensive backtesting and research and a quantitative system demonstrating high accuracy. This statistical foundation suggests that price movements are likely to exceed initial estimates.*

MNQ 12:00PM Trade EntryThis is one of the trades we took today which was very good trade, however due to me targetting the buyside liquidity all the way at 19,788.75 caused me to not realize my profits at the 16:00 mark. I was full of emotions today and I believe its just old patterns that I am working on breaking.
We had a great trading week last week, so we must remain level headed and focused. I can see here that my problem today was just not taking profits due to wanting to hold for bigger trades.
This is something we must break from and fix in our trading. When I am more focused on quick trades targeting near term liquidity pools it is when I am most confident. But I realize as I start getting better trades I tend to try to hold on to them more, specially after last week where we caught over 800+ points.
We were able to catch over 1,000+ points today, the sad part is... I was at work and did not enter on my funded challenge, I entered it on paper demo just to see the results of the trade and let me tell you, it broke my heart to not have entered because it FLEW to my TP.
This is part of the journey though, and I realize I must get a hold of these emotions and anxiety to get into trades and make money.
3/17/2025 - 12:01pm -12:14pm (13 minute trade)
3:00 was our entry
16:00 Should have been our TP.
(We should've realized that the next 1h candle that opened at 1pm would have a manipulation lower)
We could've utilized the IFVG once again at 12:46pm for the entry for the perfect trade idea. This was around the area where I entered on my DEMO.
- We used the 1H FVG which was used as support near its 50%
- Volume Imbalance from 11:33am -11:34am candles. It was used as support
- We also respected the Bearish FVG (turned IFVG) from the 11:33am candle.
We can also see that we create a inverse head and shoulders pattern 2 times near this area.
The first one we caught the trade, just failed to take TP at 16:00 mark at the 19,741.50 high.
The second Inverse head and shoulders pattern occurred 1:03-1:05pm. This was also a slight tap above the 1h bullish fvg which was the final piece needed to take price higher to fill in the 4h SIBI from the March 10, 2025 6:00am candle.
We ended up taking a total loss of $214 on our Top step account today after all trades.
Forex, Crypto and Futures Trading Risk Disclosure:
The National Futures Association (NFA) and Commodity Futures Trading Commission (CFTC), the regulatory agencies for the forex and futures markets in the United States, require that customers be informed about potential risks in trading these markets. If you do not fully understand the risks, please seek advice from an independent financial advisor before engaging in trading.
Trading forex and futures on margin carries a high level of risk and may not be suitable for all investors. The high degree of leverage can work against you as well as for you. Before deciding to trade, you should carefully consider your investment objectives, level of experience, and risk appetite.
There is a possibility of losing some or all of your initial investment, and therefore, you should not invest money that you cannot afford to lose. Be aware of the risks associated with leveraged trading and seek professional advice if necessary.
BDRipTrades Market Opinions (also applies to BDelCiel and Aligned & Wealthy LLC):
Any opinions, news, research, analysis, prices, or other information contained in my content (including live streams, videos, and posts) are provided as general market commentary only and do not constitute investment advice. BDRipTrades, BDelCiel, and Aligned & Wealthy LLC will not accept liability for any loss or damage, including but not limited to, any loss of profit, which may arise directly or indirectly from the use of or reliance on such information.
Accuracy of Information: The content I provide is subject to change at any time without notice and is intended solely for educational and informational purposes. While I strive for accuracy, I do not guarantee the completeness or reliability of any information. I am not responsible for any losses incurred due to reliance on any information shared through my platforms.
Government-Required Risk Disclaimer and Disclosure Statement:
CFTC RULE 4.41 - HYPOTHETICAL OR SIMULATED PERFORMANCE RESULTS HAVE CERTAIN LIMITATIONS. UNLIKE AN ACTUAL PERFORMANCE RECORD, SIMULATED RESULTS DO NOT REPRESENT ACTUAL TRADING. ALSO, SINCE THE TRADES HAVE NOT BEEN EXECUTED, THE RESULTS MAY HAVE UNDER-OR-OVER COMPENSATED FOR THE IMPACT, IF ANY, OF CERTAIN MARKET FACTORS, SUCH AS LACK OF LIQUIDITY. SIMULATED TRADING PROGRAMS IN GENERAL ARE ALSO SUBJECT TO THE FACT THAT THEY ARE DESIGNED WITH THE BENEFIT OF HINDSIGHT. NO REPRESENTATION IS BEING MADE THAT ANY ACCOUNT WILL OR IS LIKELY TO ACHIEVE PROFIT OR LOSSES SIMILAR TO THOSE SHOWN.
Performance results discussed in my content are hypothetical and subject to limitations. There are frequently sharp differences between hypothetical performance results and the actual results subsequently achieved by any particular trading strategy. One of the limitations of hypothetical trading results is that they do not account for real-world financial risk.
Furthermore, past performance of any trading system or strategy does not guarantee future results.
General Trading Disclaimer:
Trading in futures, forex, and other leveraged products involves substantial risk and is not appropriate for all investors.
Do not trade with money you cannot afford to lose.
I do not provide buy/sell signals, financial advice, or investment recommendations.
Any decisions you make based on my content are solely your responsibility.
By engaging with my content, including live streams, videos, educational materials, and any communication through my platforms, you acknowledge and accept that all trading decisions you make are at your own risk. BDRipTrades, BDelCiel, and Aligned & Wealthy LLC cannot and will not be held responsible for any trading losses you may incur.


NQ Range (03-17-25)Monday and 2nd half of Long Play from Friday. Arrow is range and not expecting much. Sideways to snail move higher or Monday pop stall out and drop to lower yellow arrow or below. FYI, the weaker and slower the NAZ moves the higher is can just snail/inchworm higher into the next O/N safe zone. Careful Shorting 1st, wait for the fake/dirty move higher to fizzle out.

Nasdaq 100 (NQ1!) - Key Levels and Market Outlook 📌 Market Structure
🔹 Key Support Zone (~19,170 USD)
The price recently bounced off this level, which has acted as a significant support area.
The highlighted gray-blue zone represents a demand area where buyers stepped in.
🔹 Intermediate Resistance (~19,800 - 20,200 USD)
The price is currently testing this zone, which was previously a key breakdown area.
A strong rejection here could push the index back towards the 19,170 USD support.
🔹 Major Supply Zone (~21,500 - 22,400 USD)
The previous peak around 22,400 USD saw strong selling pressure, leading to a sharp drop.
The red-shaded area represents a heavy supply zone where sellers were dominant.
📉 Bearish Scenario
A rejection at 19,800 - 20,200 USD could lead to another retest of 19,170 USD.
A break below 19,170 USD would expose the index to further downside, possibly towards 18,500 - 18,200 USD.
📈 Bullish Scenario
A break and close above 19,800 - 20,200 USD could trigger a move towards 21,000 - 21,500 USD.
A sustained breakout above 22,400 USD would invalidate the bearish structure and signal a continuation of the uptrend.
🔎 Conclusion:
The Nasdaq is at a pivotal moment, hovering around key resistance at 19,800 - 20,200 USD.
A breakout or rejection from this zone will determine the short-term direction.
Key factors to watch include economic data, Fed policy, and overall market sentiment.

IDEA: Buy NASDAQBuying NASDAQ.
I'm buying on the CME_MINI:NQ1! , taking into account:
The RSI (Relative Strength Index) is in oversold territory.
The Fear/Greed Index is showing panic.
The VIX (Volatility Index) is at a high level.
I'm simply looking to make a buying trade and sell on a bounce, as the trend could still be bearish.

NQ/MNQ Prediction 3/17/25 = +$2710 1 ContractIf you're trading MNQ, Its 1/10th of the $$$.
Example: 1000 on NQ is 100 on MNQ. 😎🫡💰
$2710 in 1 hour…minimum😤🔥🫡
Levels are provided DAILY prior to market open. Like and follow for more insight 🫡💰🔥

the buy zone activated on nasafter dropping 350 pips.. nas reversed and got into our buy zone.. ending the sell trade. a nice bat pattern has formed offering a nice retracement trade to fill gaps and possibly correct.

ICT Challenge get 60 handles...... while he can't lol. The indicator did it again, theGhost beating theGhost in the Machine (ICT) at his own turf.
As i post this, he is still looking for an entry for his own challenge, while i was done at 10:03
lol that's 24 minutes ago

Missed Trade Idea on NQMissed this trade Idea, was afraid to enter feeling lots of emotions. Beginning of the week so we are working on being patient and making the right calls.

Bull Flag brokenWe have a great set up where a bull flag is broken.he gauges were set to open mixed after a sell-off that saw the S&P 500 (^GSPC) enter correction territory and the Dow book its worst weekly performance since March 2023. Markets have been buffeted by economic slowdown fears and uncertainty over Trump's unpredictable tariff policy.


NQ Power Range Report with FIB Ext - 3/17/2025 SessionCME_MINI:NQH2025
- PR High: 19686.25
- PR Low: 19559.50
- NZ Spread: 283.5
Key scheduled economic events:
08:30 | Retail Sales (Core|MoM)
Index futures contract rollover week begins
- Next contract month June (M) already over 60% of current month
- Advertising rotation above previous week high
- Retracing ~25% of Friday's range
Session Open Stats (As of 1:15 AM 3/17)
- Session Open ATR: 475.10
- Volume: 36K
- Open Int: 243K
- Trend Grade: Neutral
- From BA ATH: -12.6% (Rounded)
Key Levels (Rounded - Think of these as ranges)
- Long: 22667
- Mid: 21525
- Short: 19814
Keep in mind this is not speculation or a prediction. Only a report of the Power Range with Fib extensions for target hunting. Do your DD! You determine your risk tolerance. You are fully capable of making your own decisions.
BA: Back Adjusted
BuZ/BeZ: Bull Zone / Bear Zone
NZ: Neutral Zone

Sells on MNQWith the new administration in the office I still have NQ bearish. We are at a key level that has been tested multiple times. I believe there is still selling pressure. Price is still under the 50EMA, bearish engulf and key level, and 4h also in a downtrend.

