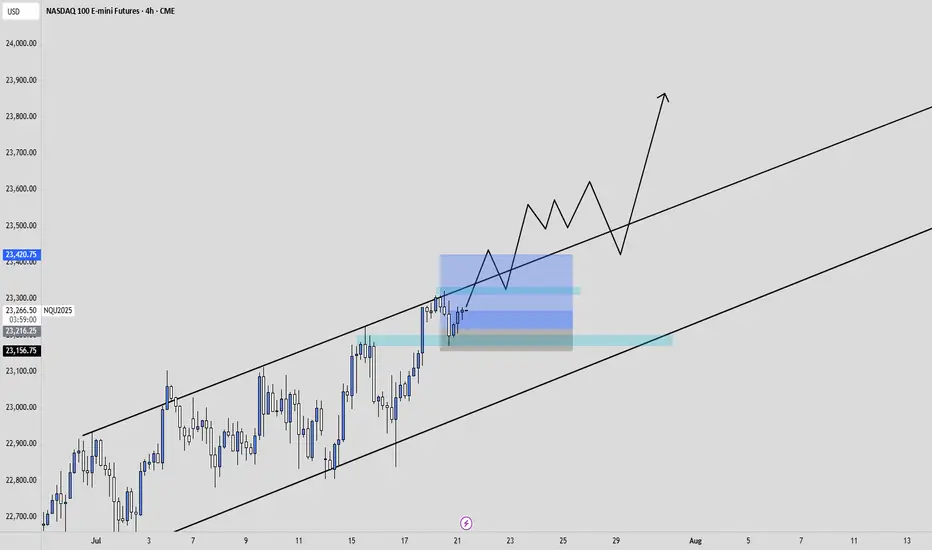
long NQOk, So i think NQ is poised for a massive move up north, i just hope for now that we get an entry.
What i think will happen is that the price will revisit 23116, and then hit higher.
Lets see how this will play out.
NQ1! trade ideas
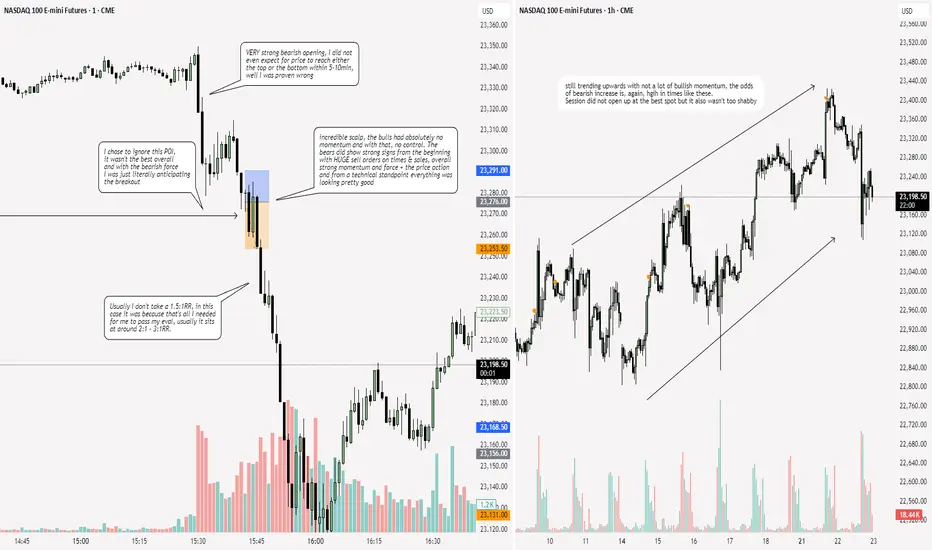
NQ: 222nd trading session - recapVery good session + very good scalp today. Can't really say much anymore since everythings already on the chart.
I passed one evaluation and I am close to passing another due to this incredible trade.
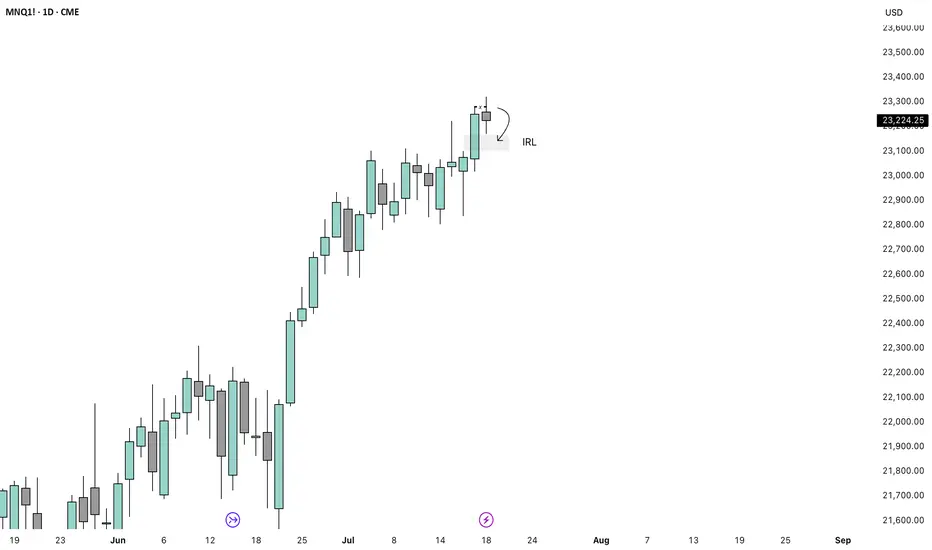
NQ Targets (07-18-25)I have not posted a Target call in awhile, this one is Long to upper TZ (23,486) and Short to YTD Open level. Prior use of Diablo's to Target drop was prior to NAZ 25% drop (11/24 Post's).
We are due for some drop retesting as we watch typical Long Side Tweets, Tricks and Games start to fizzle some. Today into Monday will be a key signal.
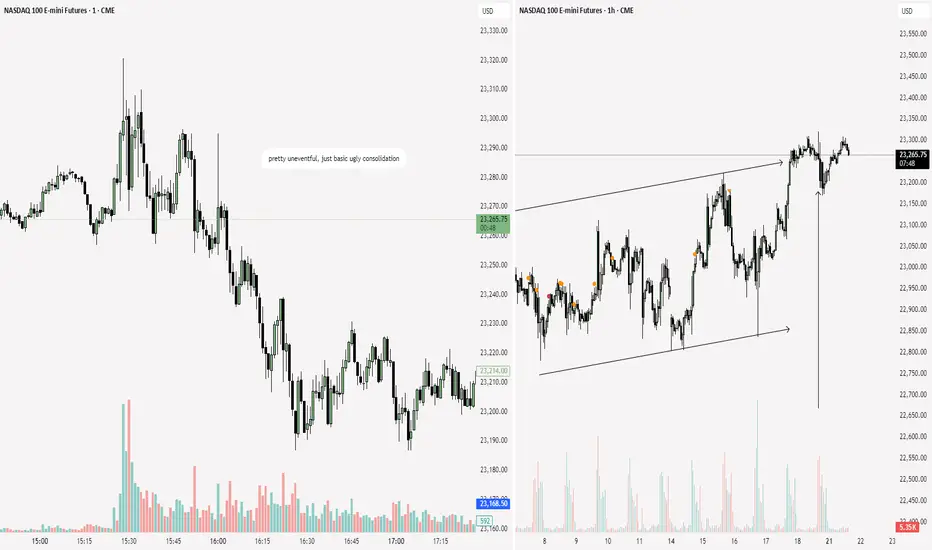
Emini Nasdaq 100. Daily Orderflow. 22.07.2025, TuesdayDaily orderflow and the thought process behind execution on Nasdaq

AM session NQ bullishI think we are having a Judas Swing down to take out this low and then during the news we get a 10 AM reversal.
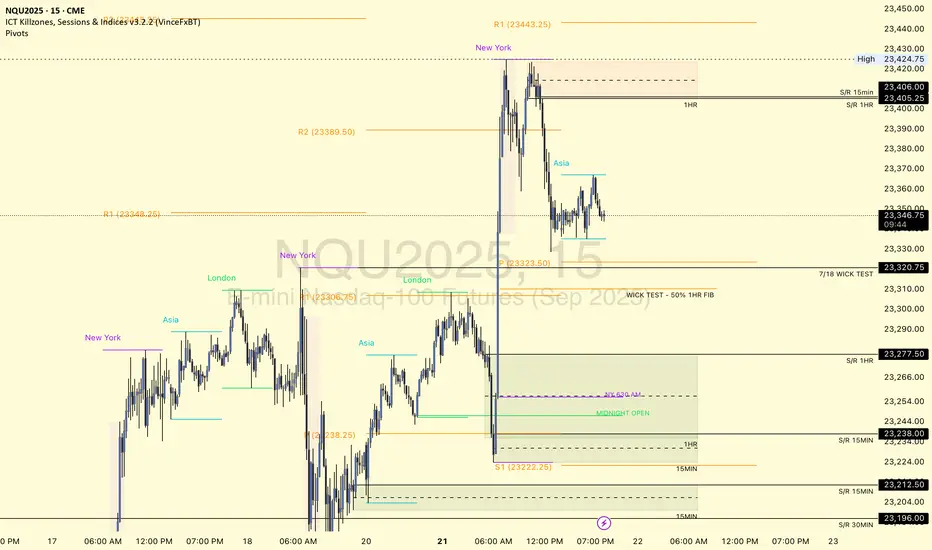
NQ Power Range Report with FIB Ext - 7/22/2025 SessionCME_MINI:NQU2025
- PR High: 23353.00
- PR Low: 23336.00
- NZ Spread: 38.0
Key scheduled economic events:
08:30 | Fed Chair Powell Speaks
Session Open Stats (As of 1:45 AM 7/22)
- Session Open ATR: 260.85
- Volume: 19K
- Open Int: 277K
- Trend Grade: Neutral
- From BA ATH: -0.1% (Rounded)
Key Levels (Rounded - Think of these as ranges)
- Long: 23811
- Mid: 22096
- Short: 20383
Keep in mind this is not speculation or a prediction. Only a report of the Power Range with Fib extensions for target hunting. Do your DD! You determine your risk tolerance. You are fully capable of making your own decisions.
BA: Back Adjusted
BuZ/BeZ: Bull Zone / Bear Zone
NZ: Neutral Zone
$NQ Supply and Demand Zones 7/21/25 This chart is for SEED_ALEXDRAYM_SHORTINTEREST2:NQ posting for the YT community.
www.tradingview.com
We are building more levels although we have approached and created a new ATH.
Would love to see a retest of the levels below, especially with the momentum of leaving some levels untested and untouched. We have the 50% mark at 23310 that has been left and is also an untested wick level.
We have news from Wed and on!
Looking for Entry on NASDAQ - LONG The most traded price on /NQ Futures continuous contract in June was about 22000. With this ramp today and using Fibonacci from the April low - the .786 retracement puts at exactly 22000. That is confluence - as well this volume shelf should hold price. The Dow Futures /YM have been down over the last couple of weeks, the /ES only slightly up its all divergent which means nothing except fuel for longs taking shorts out looking at technical charts.
Trade wars? Tesla or Apple earnings - both have tariff risks. When and if we get there I will be looking to get long at 22000.
There is one more thing - there remains at a virgin point of control at 22050 as well - this adds to the confluence.
Its early on this this trade idea, I've revising the fib levels daily - however today it did give me this confluence - so I'm sharing it. Its possible we go to 25000 first- but unlikely.

NQ: 221st trading session - recapBetter session today, I was pretty focused and I scalped longer than usual. Good way to start the week I'm guessing

2025-07-21 - priceactiontds - daily update - nasdaqGood Evening and I hope you are well.
comment: Melt-up and bears failed to close below last weeks high, which means we are still max bullish. Until bears print below 23200, longs just make more sense than trying to look for shorts.
current market cycle: bull trend
key levels: 23000 - 23500
bull case: Bulls remain in full control until we get a daily close below 22700. First target for the bears is a lower low, which means getting below today’s spike 23225. That would be a start but likely means sideways rather than more selling. If we stay above 23200, we can continue to print many more new highs.
Invalidation is below 22700.
bear case: Bears obviously are not doing enough. They need to print 23200 and that would only be the first small start. It would open the possibility for a test of 23000 but since we are barely printing any red bars and have not broken any bull trend line so far, it’s stupid to look for shorts. Wait for much bigger selling pressure.
Invalidation is above 23500.
short term: Neutral but if anything I am looking for long scalps against support like the 1h 20ema.
medium-long term - Update from 2024-06-29: No change in plans. I expect 20000 to get hit over the next 3 months and maybe 19000 again.
trade of the day: Long US open. Just a quick melt-up but I missed it.
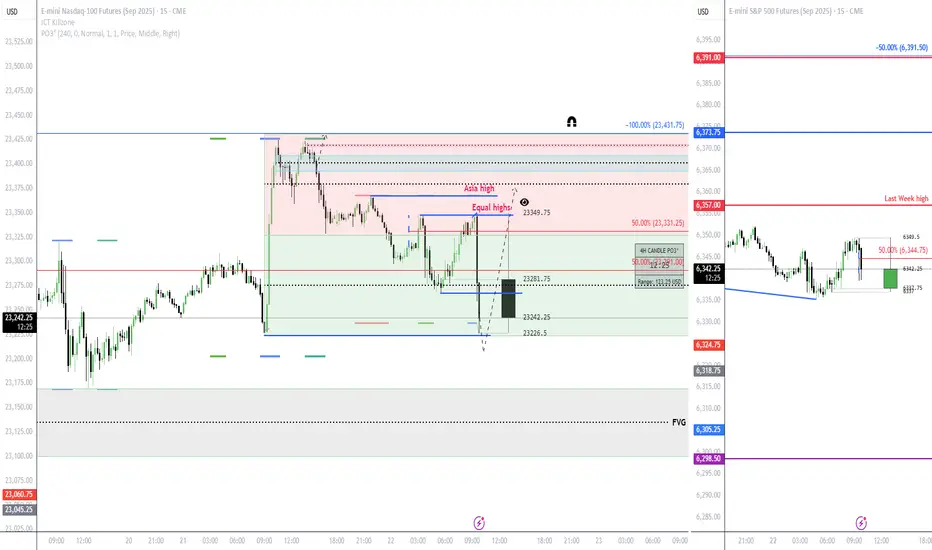
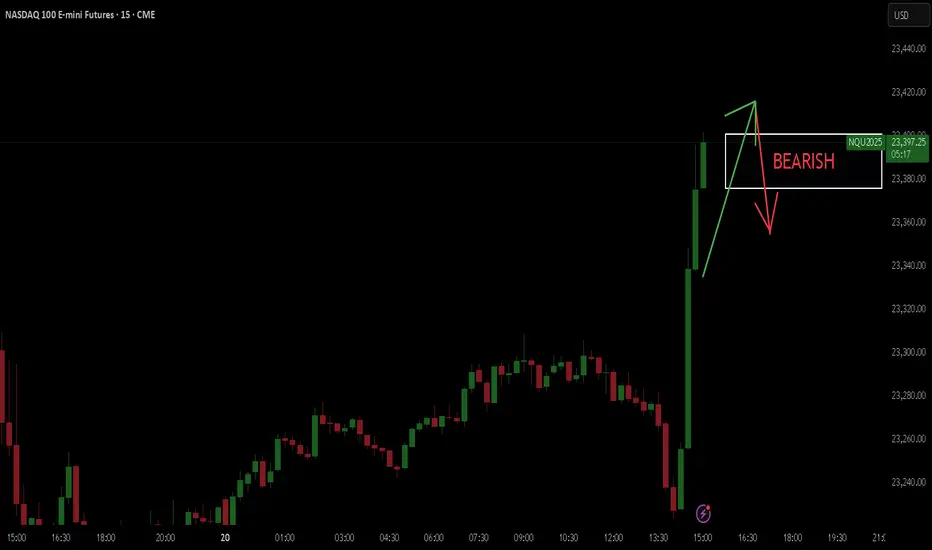
NQ Short Setup: Contrarian Trade into Supply ZoneDouble top forming near 23,424.75 with supply overhead at H4 S2 Pivot – 23,439.25.
🎯 Entry: 23,432.00 (mid-range)
📘 TP: 23,393.00
🔴 SL: 23,439.25
⚠️ Risky fade play against bullish earnings momentum and looming trade deal deadline.
— Tactical short. High risk, high tension. Stay sharp.

NQ: 220th trading session - recapForgot to post it - nothing happened so it's not that deep but I cannot keep forgetting man
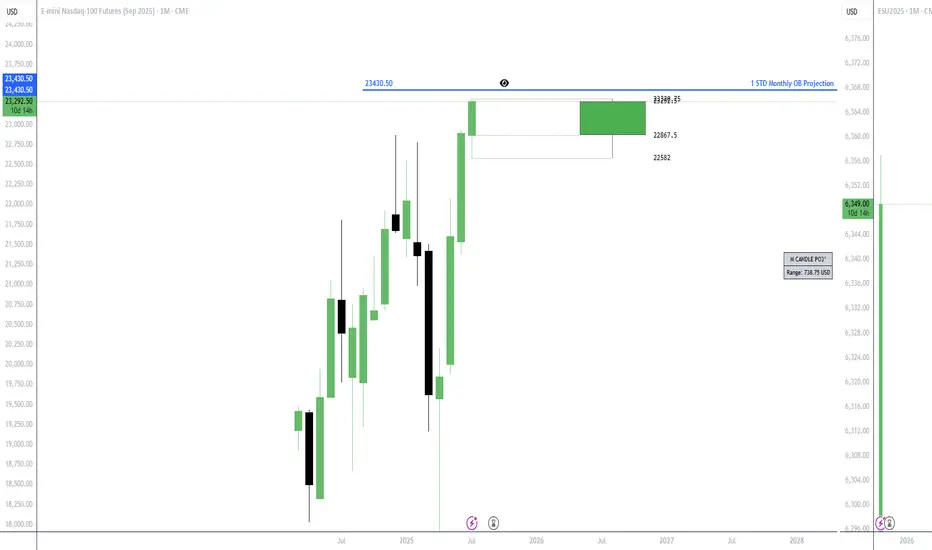
NQ projection!I´m Bullish on the monthly chart on NQ. My projected target for upside is the one you see in the chart. It´s projected from the Monthly bullish orderblock, 1 standard diviation!
NQ Power Range Report with FIB Ext - 7/21/2025 SessionCME_MINI:NQU2025
- PR High: 23203.75
- PR Low: 23245.50
- NZ Spread: 93.25
No key scheduled economic events
In range to continue pushing ATH
Session Open Stats (As of 1:45 AM 7/21)
- Session Open ATR: 266.36
- Volume: 21K
- Open Int: 274K
- Trend Grade: Neutral
- From BA ATH: -0.1% (Rounded)
Key Levels (Rounded - Think of these as ranges)
- Long: 23811
- Mid: 22096
- Short: 20383
Keep in mind this is not speculation or a prediction. Only a report of the Power Range with Fib extensions for target hunting. Do your DD! You determine your risk tolerance. You are fully capable of making your own decisions.
BA: Back Adjusted
BuZ/BeZ: Bull Zone / Bear Zone
NZ: Neutral Zone
NQ long TLM conceptKey takeaway : CME_MINI:NQ1!
NQ has broken structure and is retesting a previous area of resistance
Strong demand
channel indicating strong bullish presence overall.
I expect continuation to the upside during coming days.
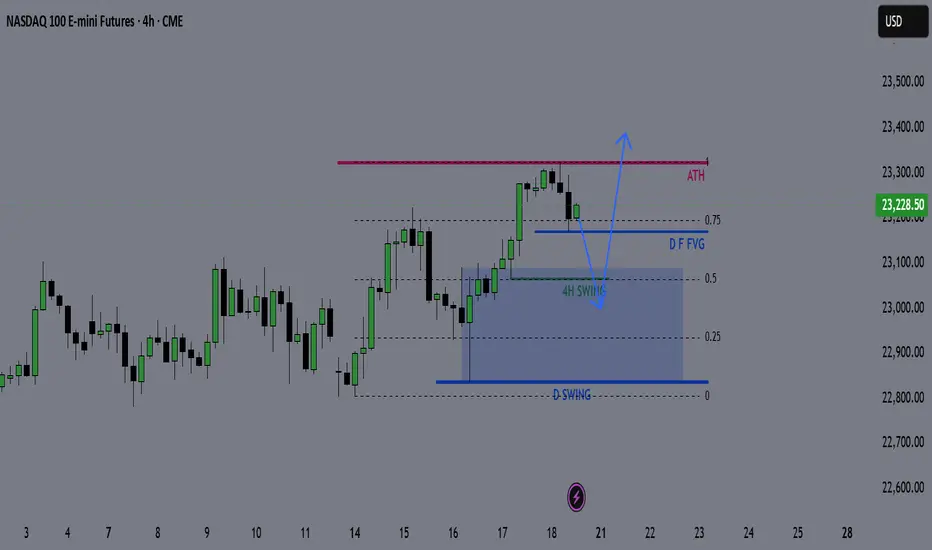
NQ Weekly Outlook & Game Plan 20/07/2025NQ Weekly Outlook & Game Plan
🧠 Fundamentals & Sentiment
Market Context:
NQ continues its bullish momentum, driven by institutional demand and a supportive U.S. policy environment.
📊 Technical Analysis:
Price is currently in price discovery, and the weekly structure remains strongly bullish — so I prefer to follow the strength.
We might see a minor retracement before pushing further above the all-time high (ATH).
🎯 Game Plan:
I'm expecting a potential retracement to the 0.5 Fibonacci level, which is the discount zone in a bullish environment.
Interestingly, the 4H liquidity zone aligns perfectly with the 0.5 Fib level — this confluence suggests price may gather enough energy from there to make new highs.
✅ Follow for weekly recaps & actionable game plans.
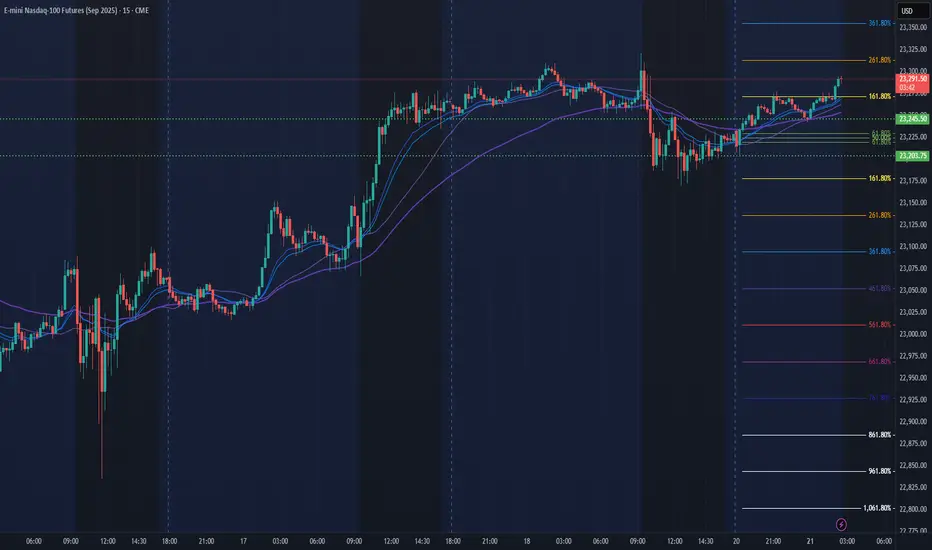
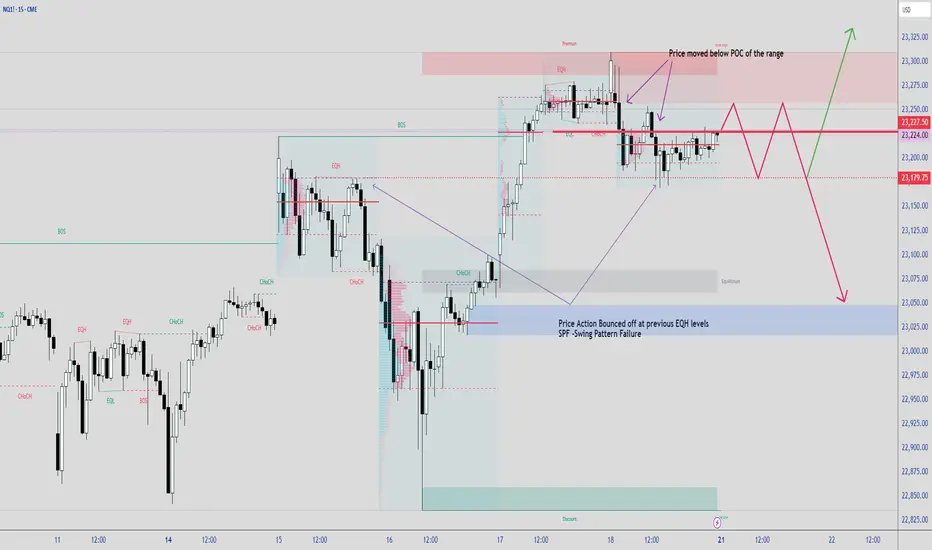
Using LuxAlgo SMC Free indicatorSometimes Indicators helps calculates the swing points without any effort especially during live trading.
POC is part of a tool called Volume Profile. In this case, Im using select Fixed Range VP to identify short term POC to see where PA can bounced from.
When markets moving sideways or in a Trading Range, PA tends to be choppy.
Nobody knows about the future, if they claimed to know, just run away. Here are some probabilities how PA would do next.
ERL TO IRLOn Monday, expecting a move to internal range liquidity (the imbalance resting below). Looking for shorts at 8:30 or 9:30 open; only after trading into a 4/1 hour time frame fair value gap or sweeping a high.
Bearish or bullish? Analysis:
Daily outlook:
- if market moves to to the daily key level, and make a short term bounce or sweep
will take longs setups
- if market moves sharply through the Daily key level, will look for short setups

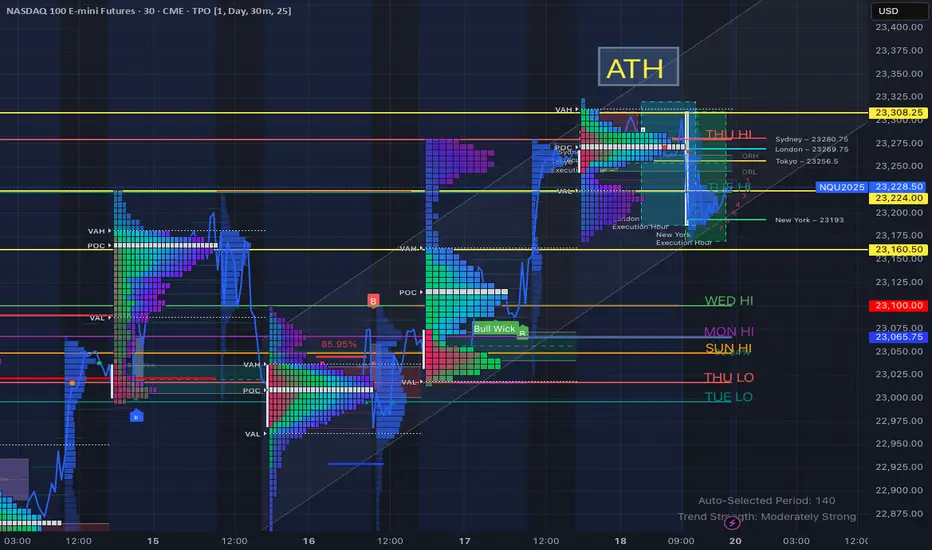
NQ2025 – Range Reclaim and ATH Test in Focus | TPO AnalysisDescription:
The Nasdaq-100 (NQ2025) is showing signs of strength after reclaiming a key value area around 23,224, with price now consolidating above the New York execution low (23,193) and the weekly value area low. Volume structure and price action suggest potential continuation toward the all-time high.
Key Technical Notes:
Range Reclaim: Price reclaimed a composite range zone (23,193–23,224), showing acceptance and strength during NY session.
All-Time High (ATH): 23,308.25 remains the upside magnet.
Initial Balance and ORL: Serving as confluence for bullish structure if retested.
TPO Structure: Value is shifting higher with poor high left above current range, increasing likelihood of continuation.
Primary Scenarios:
Bullish Continuation: Hold above 23,224–23,193 and rotate toward ATH.
Pullback Opportunity: Reclaim of NY low or session VWAP after sweep could offer long re-entry.
Rejection Scenario: Break back below 23,193 may shift control to sellers, targeting 23,160 and 23,065 support.
Support/Resistance Zones:
Resistance: 23,275 → 23,308.25 (ATH)
Support: 23,224 → 23,193 → 23,160
Lower Shelf Support: 23,100 → 23,065.75
This chart utilizes a blend of TPO analysis, intraday session levels, and volume-based structure to align setups with high-probability continuation or reversal zones.
📍#NQ #FuturesTrading #VolumeProfile #TPOAnalysis #DayTrading #TechnicalAnalysis #TradingStrategy
NASDAQ: Still Bullish! Look For Valid Buys!Welcome back to the Weekly Forex Forecast for the week of July 21-25th.
In this video, we will analyze the following FX market:
NASDAQ (NQ1!) NAS100
The Stock Indices are strong, and showing no signs of selling off. Buy it until there is a bearish BOS.
Enjoy!
May profits be upon you.
Leave any questions or comments in the comment section.
I appreciate any feedback from my viewers!
Like and/or subscribe if you want more accurate analysis.
Thank you so much!
Disclaimer:
I do not provide personal investment advice and I am not a qualified licensed investment advisor.
All information found here, including any ideas, opinions, views, predictions, forecasts, commentaries, suggestions, expressed or implied herein, are for informational, entertainment or educational purposes only and should not be construed as personal investment advice. While the information provided is believed to be accurate, it may include errors or inaccuracies.
I will not and cannot be held liable for any actions you take as a result of anything you read here.
Conduct your own due diligence, or consult a licensed financial advisor or broker before making any and all investment decisions. Any investments, trades, speculations, or decisions made on the basis of any information found on this channel, expressed or implied herein, are committed at your own risk, financial or otherwise.

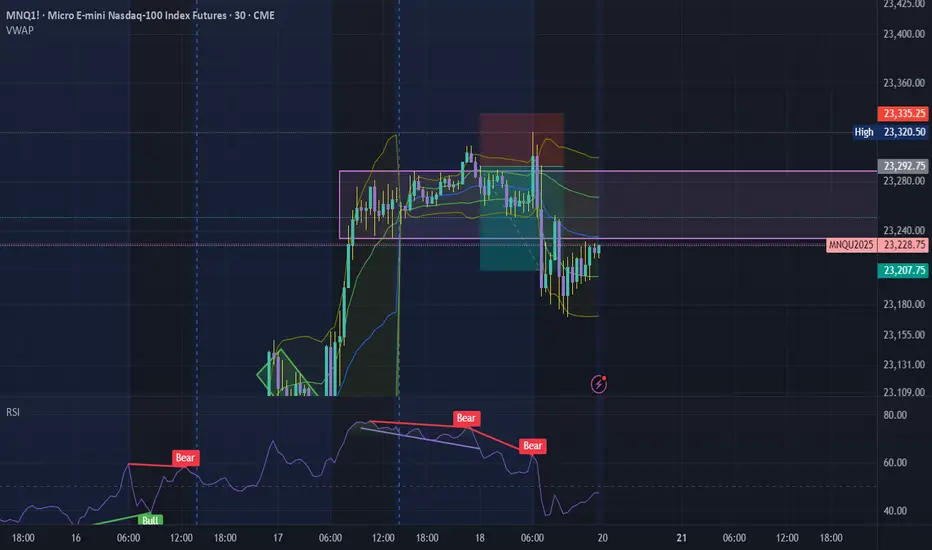
Bearish Divergence using RSIStarting to utilize RSI in confluence with market structure and FVG to create an entry and exit model. Higher highs of price action paired with lower highs of RSI values. Exit towards filling at least 50% of FVG. Don't be greedy, as price can use FVG as support/resistance.