What a nice couple of days across the indices ES,NQ,YM,RTY Cant get much cleaner than that. Almost picture perfect. Im not even surprised anymore.... its almost a given everday... If ya want access to the tools let me know.
RTY1! trade ideas

the last stop hunt?Well "they" have been messing with the price for a number of days now. They have ended a number of sessions on a bullish move only to sell all day. If we pump overnight and tomorrow I think we can reasonably assume that Thursday was a stop hunt before the move up. This is looking increasing more likely overnight. Don't feel like you missed the bottom, just get in while you can. I expect a break from the new normal of massive selling all morning. Michigan consumer sentiment @ 9, don't get stopped out on that one as they will definitely spike it down to stop people out before they run the price up, if they actually do run the price.

Bottom on the Russell: Rotational Rally FollowsRussell is at the bottom following the tariff news—expect a rotational rally to follow. This will likely fuel the crypto markets.

Consumer Sentiment & Stocks MarketsStock Markets Track Consumer Sentiment Closely
The relationship between consumer sentiment and the stock market is evident in this observation. Historically, consumer sentiment tends to lead stock market movements, providing valuable insights into potential trends.
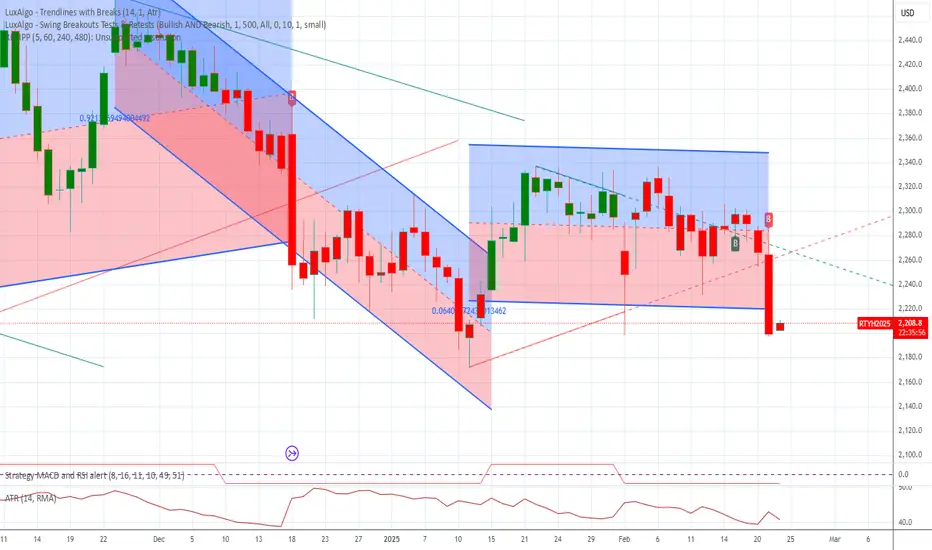
Personally, I consider the Russell 2000 Index as a reflection of mass consumer sentiment, given that it tracks the 2,000 smallest publicly traded companies in the U.S. market. Looking at the E-Mini Russell futures, consumer sentiment peaked in December 2024, and since then, I have been monitoring the Russell and other indices along their well-supported trendlines. When the Russell started testing its trendline in January, I became cautious about its uptrend.
The clean break on February 21 signaled a shift: Russell transitioned from an uptrend to a downtrend on the daily chart. Consequently, my trading strategy has shifted from buying on dips to selling on strength whenever opportunities arise.
Russell is Leading Dow Jones, Nasdaq and S&P???
Indices tend to influence each other, and leadership often rotates. While the Nasdaq has previously led market moves, this case study suggests Russell is currently taking the lead.
Technically, the overall U.S. market remains bullish as long as it holds above the primary uptrend line. A bear market is typically confirmed when the market drops 30%, and by then, it should break below all primary uptrend lines. However, waiting for that confirmation is too late—by then, the damage will be significant.
The key observation is that Russell has already broken its secondary uptrend line. Will the Dow Jones, S&P 500, and Nasdaq follow? If so, we need to make fundamental projections. Factors like escalating tariff conflicts could worsen inflation, directly impacting the broader stock market and indices.
Consumer Sentiment Still Below 80 Despite Pandemic Being Long Over
Given the current macro environment, consumer sentiment is likely to remain below 80 for an extended period. Additionally, there is a downside risk if geopolitical tensions escalate.
From past case studies, a consumer sentiment reading below 80 has often preceded a stock market decline. This historical pattern raises concerns about future market stability.
My Trading Strategy: Cautiously Bullish
• Technical Perspective: Apart from Russell, I remain bullish on other indices.
• Fundamental Perspective: Market sentiment leans toward pessimism.
• Conclusion: This dual outlook leads me to a cautiously bullish stance.
For Russell 2000, my preferred strategy is to sell into strength, guided by a downtrend channel. Another alternative is trading Micro E-Mini Russell futures (M2K) for precision and risk management.
📈 Happy trading!
Please see the following disclaimer and additional information that may be useful.
E-mini Russell Futures
Ticker: RTY
Minimum fluctuation:
0.10 index points = $5.00
Micro E-mini Russell Futures
Ticker: M2K
Minimum fluctuation:
0.10 index points = $0.50
Disclaimer:
• What presented here is not a recommendation, please consult your licensed broker.
• My mission is to create lateral thinking skills for every investor and trader, knowing when to take a calculated risk with market uncertainty and a bolder risk when opportunity arises.
Trading the Micro: www.cmegroup.com
CME Real-time Market Data help identify trading set-ups in real-time and express my market views. If you have futures in your trading portfolio, you can check out on CME Group data plans available that suit your trading needs www.tradingview.com

RUSSELL2000 is Net-ShortRTY! has broker the consolidation and is now net-short on the regression break.
I am considering this trade and the EA to use.
RTY_60 Minute_Bullish_+340 TicksThe RTY one hour time frame is in an up trend. The
market is making higher highs and higher lows. The
market has an up Fibonacci with an extension price
point 2336.0. It will be a good idea to look for long
ideas towards the one hour up Fibonacci.
Entry: Counter trend line break bullish in the buy zone.
STOP: 2256.2
LIMIT: 2333.2
Another entry idea: As long as the one hour time frame
stays in the buy zone. It will be a good idea to turn to
the five minute time frame and to look for long ideas
towards the one hour limit price.

RTY IdeaHere’s an idea of how the Russell could play out during the first half of 2025, with continued profit-taking from large caps into small caps.

U.S. Stock Indices In Recovery ModeU.S. stock indices have seen a lot of volatility with significant chop back and forth starting off 2025. With the new year comes a new administration, changing foreign policy, changing of the Fed interest rate environment, and a different earnings outlook for stocks. Looking at the small caps with the Russell 2000, the market has been in a range between the 50-day moving average and the 200-day moving average since the breakdown on December 18th, and has not been able to break on either side of these levels.
After a broad selloff starting off the week for the indices, the Russell has been climbing back higher after re-testing the 200-day moving average. The market has been trading above this 200-day moving average since December of 2023 and will need some type of catalyst to break out of the current range. The Russell, or small cap stocks in general, typically are the most sensitive to interest rate changes, and with the changing tone from the Fed and the probability of rate cuts coming this year, traders will be watching the Russell 2000.
Finally, we'd like to let all our readers know that CME Group has partnered with TradingView to host The Futures Leap, a 1-month trading challenge through which participants can learn to master futures markets, trade big events and compete for a share of a 25K prize purse. Click here to register for this event.
If you have futures in your trading portfolio, you can check out on CME Group data plans available that suit your trading needs tradingview.com/cme/
*CME Group futures are not suitable for all investors and involve the risk of loss. Copyright © 2023 CME Group Inc.
**All examples in this report are hypothetical interpretations of situations and are used for explanation purposes only. The views in this report reflect solely those of the author and not necessarily those of CME Group or its affiliated institutions. This report and the information herein should not be considered investment advice or the results of actual market experience.

Bearish Bat is being formedThe price climbed up above support.
Assuming it will stay up, it could lead to a rally that will form a double top and a bearish Bat.
If the price will close below the support zone, I'd disregard the pattern.

Small CAP might have a massive Squeeze in 2025.large cap, and crypto might be topping but small caps seem ready to play catch up. They have underperformed for nearly 8 years and most stocks have been heavily shorted. Maybe 3K on RTY incoming?
This support is critical. not financial advice.

Russell 2000 Faces Pressure Amid Tariff Uncertainty-As of February 4, 2025, the Russell 2000 Index, which represents small-cap stocks, has experienced notable market movements influenced by recent geopolitical events.
Recent Performance:
February 3, 2025: The Russell 2000 declined by 1.3%, reacting to newly announced tariffs by President Donald Trump on imports from Canada, Mexico, and China. These tariffs have introduced uncertainties, particularly affecting smaller companies with significant domestic exposure.
APNEWS.COM
Year-to-Date Overview:
Despite the recent downturn, the Russell 2000 has achieved a year-to-date gain of 1.3%, indicating resilience amid market volatility.
APNEWS.COM
Analyst Insights:
Analysts suggest that small-cap stocks, as represented by the Russell 2000, could face challenges due to sustained high interest rates and potential economic policies. However, the index is currently trading at relatively attractive valuations, signaling potential buying opportunities for investors.
BARRONS.COM
Market Sentiment:
The recent imposition of tariffs has heightened market uncertainties, particularly for small-cap companies with significant domestic operations. Investors are advised to monitor these developments closely, as they may influence the Russell 2000's performance in the near term.
Please note that market conditions are subject to rapid change. It's essential to stay updated with the latest financial news and consult with financial advisors when making investment decisions.

Russell 2000 Setup The continued profit-taking from big tech & large caps is rotating, with anticipated capital continuing to rotate into small caps. This will create a more risk-on market, which will be bullish for crypto.

Russell 2000 and 50DMA: The Mix for Explosive MovesWith fresh data on US GDP and inflation arriving over the next two days, Russell 2000 futures look interesting as they close in on the key 50DMA.
The index is testing minor resistance at 2312.8 in thin Asian trade, with the 50DMA not far above at 2323.5. The focus on the latter comes from its tendency to spark explosive moves once the price either breaks or bounces from it.
Over this week and last, bulls have repeatedly probed the level only to be thwarted by bears, painting a picture of a stalemate that may be eventually be resolved in a similar manner. The string of doji candles since only reinforces this view.
If we see a sustained break above the 50DMA, longs could be established above it with a stop either below it or at 2312.8 for protection. 2386.6—which has acted as both support and resistance previously—is one potential target. A break above that would put a retest of record highs on the table.
Alternatively, another rejection at the 50DMA would be a strong signal that a bearish bias may be warranted.
Mixed signals are emerging from momentum indicators, with MACD pushing higher while RSI (14) sits in a minor downtrend, though it’s threatening to shift higher.
Upcoming economic data screens as important for small-cap US stocks given their cyclical characteristics and reliance on capital markets for funding.
Good luck
DS

RUSSELL2000 Long on Regression BreakRUSSELL 2000 has broken the downtrend and the bias for RTY1! futures is now net long

RTYRTY is at yearly pivot and 200 day MA. Volume now needs to increase as shown on OBV. Seasonally the market should still rally.

RTY Daily_BULLISH_+2,175 TicksThe RTY daily time frame is in an up channel. The
market is near the bottom of the channel. If support
holds, it is expected the market to push bullish towards
the top of the channel price point 2483.8 about +2,175
ticks above. As long as the market stays above the bottom
of the channel. It will be a good idea to turn to the one
hour time frame and to look for long ideas in the buy zone.

M2K1! is out of value! (Upside!)We are currently consolidating as support on the range's resistance. Simple setup
Invalidation at return to range.
Nice setup 19.2 win to loss ratio.
Let the market close the trade

Russel 2000What I am looking at for Russel 2000 is that the overall trend is a sell. With the news coming out this week, let's look for a price to do two things: follow this bear trend or break this trend line for the Bulls to take over.

Russel 2000 1WCorrection and short consolidation until mid of January 2025
Shouldn't fall below 2230

RTY levels for tomorrow . New levels for tomorrow. blue boxes are retracements/pivots and grey boxes are targets for the day.

Russell 2000 - break up started. Following the previous post, the break up has started.
Long target - at least to the 3000 mark

Rut forming cup and handle?So, Rut closed a nice cup, and might enter a consolidation period to form the handle.
anyhow, with the handle or not, its approaching strong resistance around 2450.
a break will be a nice move up with a possible target of around 3200 (which is 30% up).
Has anyone said Donald like the smbs? (:

M2K Long 11/21/2024M2K is in an uptrend in 4hr and daily chart. It is the strongest equity. It broke out of high volume SZ and multiple swing highs. Placed a long position at DZ that coincides with the 4hr 21 EMA. The imbalance or rally is twice of the zone. Risk= $210. Target= 1:1 and 3:1.
