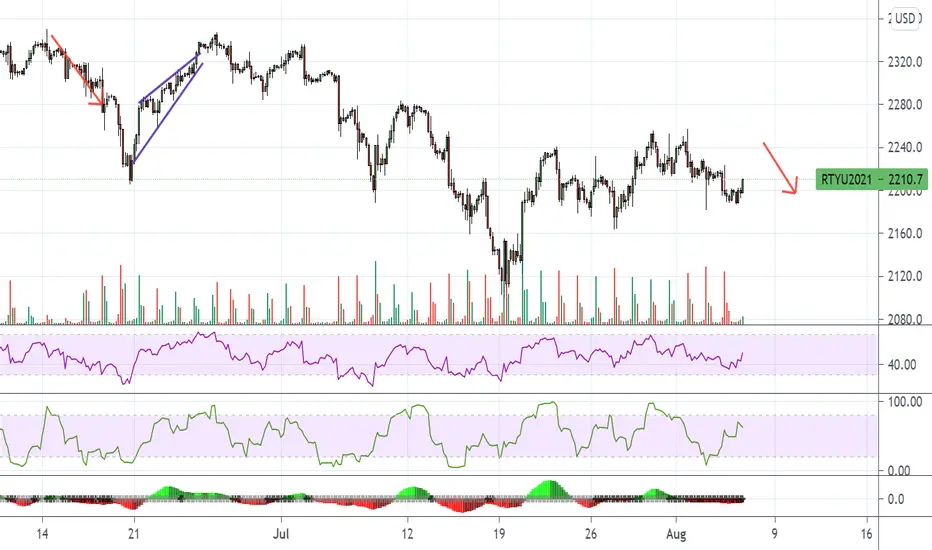
RTY UpdateMFI heading towards overbought quickly, if there's one index I'm bearish on it's small caps.
I think there's a possibility of another leg down next week.
RTY1! trade ideas

RTY1!8.19.21 Russel Mini: Long trade. Three things that added miserly to my trading: when I had 8 monitors; having great patterns. but not using the alert tool to "watch" the market for me; drawing too much ( I was working hard but I was distracted away from the great entries on another market).

Futures | Why I Got Long All The Stock Indices on an UGLY CloseThe stock indices all broke below the prior sessions lows to make new lows for the week. But I noticed a few signs that made me pick up some micros long (MES, MNQ, KYM, M2K) right before the 5pm EST close.
Long MES 4385
Long M2K 2152
Long MYM 34822
Long MNQ 14827
$150 risk per position


rty. reversal formation. now showing flag.its a little early for "i told you so" traders who only wait until something happened before they tell you about it, but this downtrend has to break at some point in time.
I will now show you the same formation on the 240 charts.

RTY OversoldRTY is oversold but it's also the one index that seems to linger there for a while. See highlighted example.
We'll see if it bounces or not....

+600 Tick Idea on RTY One HourRTY one hour time frame is in an up channel. The market is at the bottom of the channel. If the market can give a counter trend line break bullish while staying above the bottom of the channel. The research shows there is a strong history the market could increase +600 ticks towards the top of the channel.

RTY UpdateIndicators in the middle, no idea which way this goes
Something to keep in mind.... last August, every index rallied except small caps. It just went sideways, same can happen here.

RTY - Testing Channel BoundaryRotation on watch as the CPI will set direction for the remainder of this week's trading.

RTY MFI hit oversoldIt's looking like a meltup on all indices again.
NQ climbing up.... rates stabilized

rty idea. not a trade I'm placing. just idea.Here is an example of a trade I find appealing to take because price has shown me several times that it is going to stop at the area below. It might not do it again now that it highly evident, but I like this type of thing a lot better than trying to predict the support areas. Price has clearly shown in the past that it will receive some buyer support at the 2226 mark. Why not play nice?

RTY UpdateLooks like RSI needs to go oversold before a bounce.
Inidcators all neutral for all indices, NQ looks bullish, everything else looks bearish.
Possible gap up then drop tomorrow because FDAX looks like it wants to retest the top.

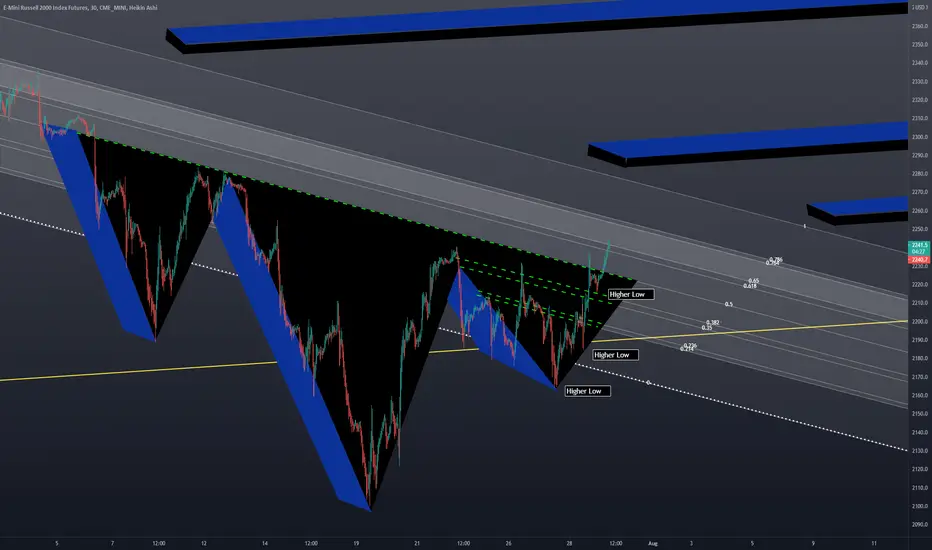
rty looking for spots to get long.russel looks like it wants to run higher. use your best risk management strategy.

Russel Future (RTY). Freefall?I everybody. It been a while since I posted and 2 reasons for this. First, my new position has me running around like sheep, and 2 I haven't trade to much lately. But Boy oh Boy when I have taken trade they have worked out big for me. You see my last oil trade and how much I made on selling it. Well after I exit I rode it hard on the way back up and exit at 73.50. I took two contracts on this one.
Now I am in RTY trade and I rode it hard from 2160 to near top. I then enter again where you see on this chart near the top and hoping for drop down to grey rectangle. I will exit there. if price fall through grey rectangle then I will take sell and watchout here because RTY could fall freefall down into nothing.
not much of analysis right now, more description of what I have been up to and so you guys don't forget about me.
Happy trading!
Ms Bunny
Always like it when you like me and support me. More posts to come.

RTY Trend Change + Backtest: Bullish AugustRTY has successfully executed a linear regression crossover on the daily period (where the 14 period linear regression line crosses the 30 and confirms by also crossing the center ribbon 0.2, 14 STDV BB).
RTY has also backtested the crossover without breaking through it (yet). We have an excellent entry here as well as a clear place to exit the trade if the bullish structure breaks down.
Targets are the upper band at 2357 and above.

RTY - Early Morning Moves into Mid Morning FadesThis Pattern has been the name of the game for the last week as the inverse H&S pattern did not break with the volume needed for a sustained move. The juxtaposition between NAS and RTY looks to continue. Jobs numbers on Friday should give direction.

RTY - Russell 2000This is fast becoming the Gift that keeps on Giving.
We closed out Buy To Open Positions an are now employing an
Inverse SELL to Open Ladder from 2273 to 2335.
We are using M2K as a Hedge IF need be - low probability imho.
Our target for the RTY remains Sub 2K, there has been aggressive
Support Mechanism for the RUT, we see it as an enormous Gift :)

E-Mini Russell 2000: What can happen now?In the previous idea below the price ended the correction as ABC model as expected. The price is now above the bullish flag and is testing a broken resistance are now turned in support. The probability is very high that we can see the price move higher up to 2280.
Thank you and Good Luck!
Previous idea:

RTY - .786 RESnew line in the sand. The market is digesting the GDP miss and the post tech earnings hang-over with AMZN being a bit light. A back test and hold of the inverse neckline will be on watch for rotation. OR will a correction in price ensue opening up some ranges?

RTY - Inverse ConfirmedJobs numbers at 8:30 AM will set the tone for the rest of the week. RTY has shown strength at the bell followed by a dip that coincides with NAS mid-morning recoveries. The 10 Year Note gained to 1.259%, but seems to be reluctant to make a run to the upside. With tech earnings winding down will this RTY pattern be the rotation vehicle for a bit more mega-cap profit taking?

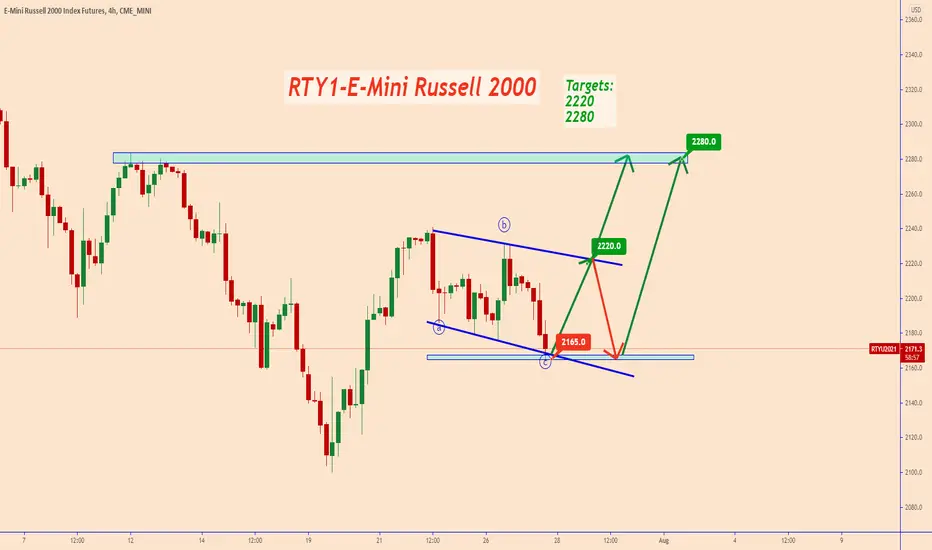
E-Mini Russell 2000: Will this correction end up as ABC?RTY1 - has tested for 3 times 2165-2170 price area during the last three hours. This is showing that the support zone is holding very well as long as the price is creating long shadows above it.
From the other side, I am watching a possibility that the price completed an ABC correction move, and now it may move higher. If that happens the first resistance zone will be near 2220. That zone may push the price lower again for a bigger corrective pattern. If the price will manage to break above 2220 it will open the door for more upside up to 2280.
Thank you and Good Luck!