RTY1! trade ideas

RTY UpdateES and RT MFI are overbought. NQ dropped below the line.
I dunno, seems like the algos aren't in control, people just buying stupid shit like Bitcoin and gold is breaking out as well. Should've stuck with the AAPL/NVDA rotation trade, lol. That would have paid really well.
Decided to close out my EWJ puts, and take the next couple of days off. Not gonna chase anything at this point, long or short. Might throw a small bet on ECB meeting Thu remarket.
I'm not gonna bet against my indicators, they show at least a dip tomorrow, but there's so much dip buying I have no idea what to short. Maybe TSLA? Who knows.

Support M2kH24Support at 2082 & 2085 Down Bar at H4 finds support to these levels; expecting a rally


SOW & a,b,c ElliotI find a SOW (sign of weaness) which it is drawing an a,b,c correction in the short time although the general trend is upward. Short ´till 2066


Got it! Jumped SupportBroken side range, keep in mind the new up bar may be signal of a SOW (sign of weakness) and drawing a new side range (wyckoff)


Support in Dow Bar. M2KH24Down Bar Supporting seems to be ready for a rally.
On the other hand Volume Delta shows an up trend.

RTY UpdateWell I said they'd try to pump small caps, and they sorta did. MFI now overbought but RSI isn't.
Doesn't really matter much, I don't plan on going long until PCE numbers are released Thu morning. Pretty good chance I take Mon/Tues off.
Market Forecast: The Week Ahead in ES, NQ, RTY, and 10 YRIn this video, I provide an in-depth market forecast for the week ahead in the ES (S&P 500 E-mini), NQ (Nasdaq E-mini), RTY (Russell 2000 Index), and 10 YR (10-Year Treasury Note) markets. I am using a few key technical indicators and market trends to give you valuable insights into potential price movements and trading opportunities.
Indicators used in this video are Bollinger Bands (20,3), Beacon Indicator, Anchored VWAP's, and the 5 day Simple Moving Average.

RTY OverboughtRTY went overbought, decided to unload my long positions a bit early. I still think PPI numbers will be good tomorrow, but made some decent money on the CPI dump so calling it good.

Russell Part 22.15. 24 The term I like to use is Market dynamics. They changed yesterday with a very significant move lower but when it got to the bottom you should want to be a buyer as long as you can find a buying tail.... and the market was giving you evidence that you should have been a buyer at that level if you recognized the signal. A lot of times in profitable markets you can get a buy signal or a cell signal and one of them well clearly dominate the market.... and the other side of the market won't be so good. The Russell was a great market to trade as a buyer and a seller. This is common for expanding markets.

The Russell index futures The dxy Part 12.14. 24 I ran out of time so this will be part one. And it occurred to me these sessions are not 12 minutes they're 29 minutes....And I ran out of time. I'm interested in market dynamics... especially in markets that have a volatile trading day when both buyers and sellers can be profitable because of the range of price for that market on that day..... yesterday was a great example. I had to learn how to think like a buyer and a seller when I first started trading.... I did not do it well because I really wanted to hang on to the side of the trade I was taking... and my conscious or unconscious strategy was that the other side of the market was a problem. If I was long the sellers where my enemy. If I wanted to go long the sellers were my enemy and that made my decision more complicated. More on next video.

Small Cap DailyWell, bonds were down earlier today and actually went up with the auction. $25B worth of 30yr and they bought into it, wow. So that means yields go back down, bond traders are buying into the projected rate cuts. (Keep in mind it's 30 yr though)
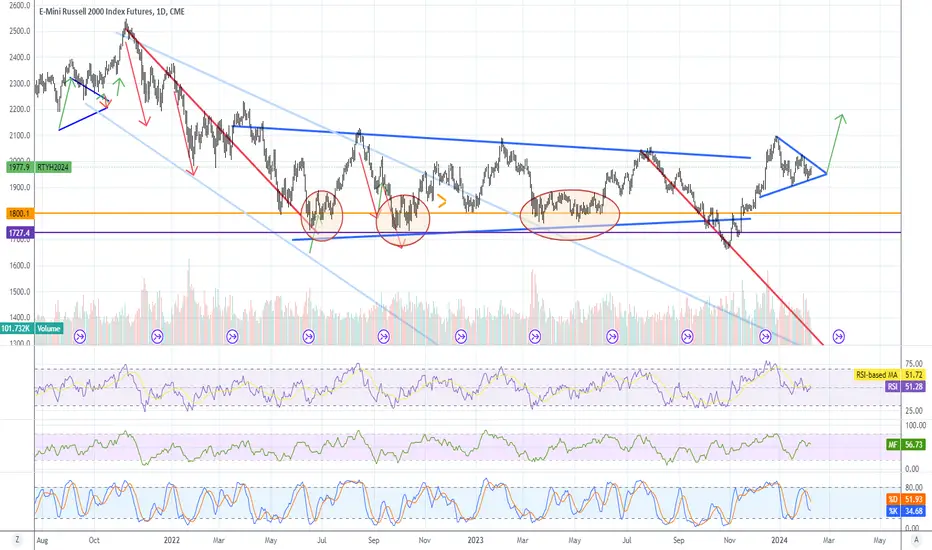
One of my followers mentioned small caps earlier this week, forming a pennant on the daily, and I think it breaks out if inflation numbers are good next week. Target in green. Buy garbage stocks, lol.
Remember, CPI on Tues and PPI on Fri. I don't think CPI will be that great, but PPI will be.
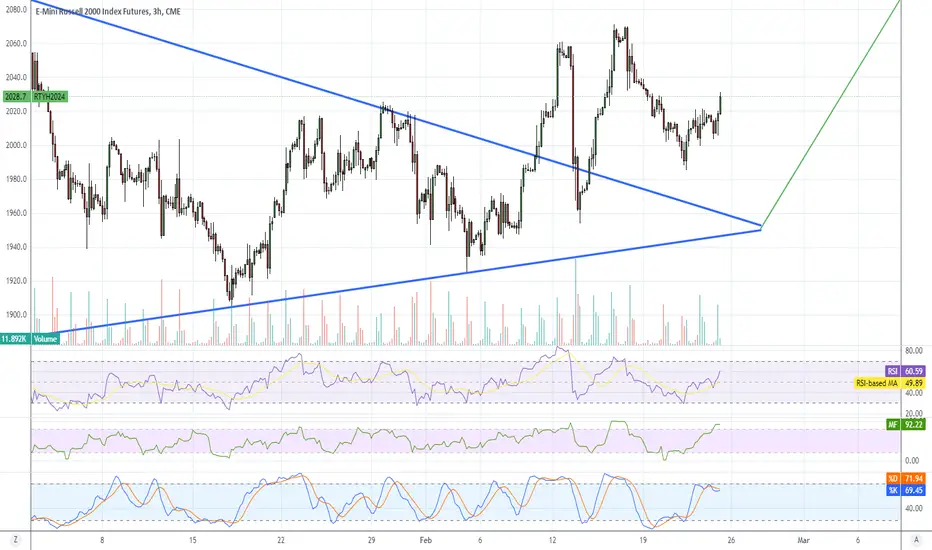
RTY UpdateChart pattern looks like a breakout but indicators went overbought on my 3 hr.
I closed out my small position in garbage stocks. (I was right when I posted that yeserday, lol) Return was good in terms of percentage, but I didn't have much. Who wants to risk a lot in garbage stocks?
Not really sure what happens next week, might just sit and watch until CPI numbers come out Tuesday
I did a quick look at about 10 markets looking for a reversals2.13.24 This video is about what it really is like making a trade decision when it's hard to make the decision. My point is that you have to practice deciding when to take a trade and when there's enough evidence to take the trade with a higher probability that the market will take you in the direction you are trading. You should train yourself to do this.... if you can't remember what you said previously... then take notes and go back to your notes a day later... and figure out why you were wrong.... when you were wrong. Keep a record of your trades... but more importantly you will learn that you will read some markets better than others and you want to learn what that is when you paper trade. You don't have to take the trades that have conflict that you will be able to recognize. Stay away from those trades...When you are sure that the situation is not clear. Impulse trading with unclear setups is a very expensive mistake. think of an unclear trade as an opportunity to relax and sit back and wait and that you're not in any jeopardy because you've decided to not trade where the market's unclear... think of it as a gift.

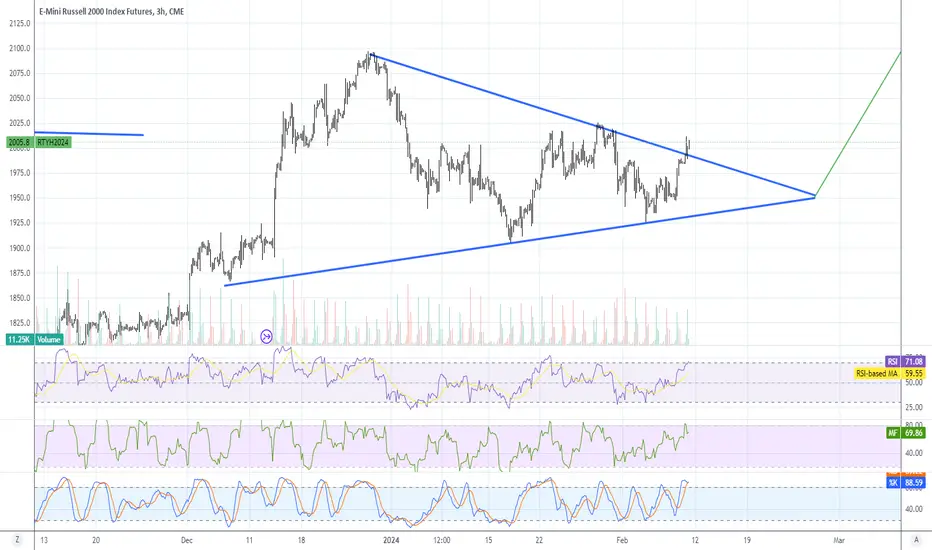
M2K Potential small cap rotationLike the way price retested the downward trendline. Move up into the red resistance box is likely on of break of 2025. If price breaks above the red box look small caps to play serious catch up.

Russel 2000 WeakLet's take a look at the Russel 2000. This index seems to be the only one between the Dow, Nasdaq, and S&P that is failing to break to new ATH while they are.
What we're seeing is a triple top/triple resistance in Aug 2022, than again February 2023, and again August 2023 which was confirmed with a break down to the lows of October 2023 before more manipulation came into play. Some will say inflation is declining and talks of rate cuts seems to be the reason markets rose, but from what we are hearing today from the Fed is that rate cuts aren't likely as they continue to backtrack and downplay rate cuts.
Perhaps, they know something before we do... perhaps double peak inflation like the 1970s? Just as everyone believes its declining, surprising new data comes out that proves otherwise? Let's see.
Once again we see the Russel 2K failed more recently to break and hold above 2020 with constant rejections. This would be the 4th rejection and we could be on the 5th rejection. And why not? Banks once again are starting to shake, with JPMorgan losing deposits, NY Community Bank failing, banks invested in CRE are tanking and this before the big ending to their Bank Term Funding Programme (BTFP) officially ending. Look at the chart for it, it spiked in March 2023 with the failure of SVB, and it is spiking once again Jan and Feb of 2024. Something coming down the pipelines?
I shudder when I see markets breaking ATH, because it has ALWAYS meant markets are more vulnerable to bad news (be it financial, economical, or geopolitical). What we're witnessing is a market that is getting fundamentally weaker and weaker. The economy does not support equities hitting ATH, as earnings are revised lower, personal debt is $17 TRILLION dollars (an ATH) and personal savings are at an all time low. This is not including the decaying jobs market, retail, national debt, manufacturing, consumer sentiment and so on. The floor is a 1 centimeter sheet of ice and it's warming up. This bubble is poised to pop any moment now.
My advice
Obviously, be vigilant. If you are holding positions from a lower price point and you are making profit, I say hold until whatever event happens and breaks the glass floor. If you are new money looking to invest, I can not suggest investing now at the top with such toxic economy and financials. Do your own research, look at the economic data and see if any of it or at least majority of it gives you peace about investing. People are broke, debt is exploding so retail will inevitably collapse and since we're a retail based economy, you can imagine what comes next.
Targets for Russel 2K - IWM
1) 1915, if we break that then
2) 1730, if we break that then
3) 1680, if we break that then
4) 1630, if we break that then run for the hills.

RTY 3hr Update RTY isn't overbought on 3 hr or daily so more room to pump garbage stocks, lol. Tomorrow is Ponzi Friday.

RTY weekly mega short ideaJust because i like to say it's going down
not because you should bet on it
