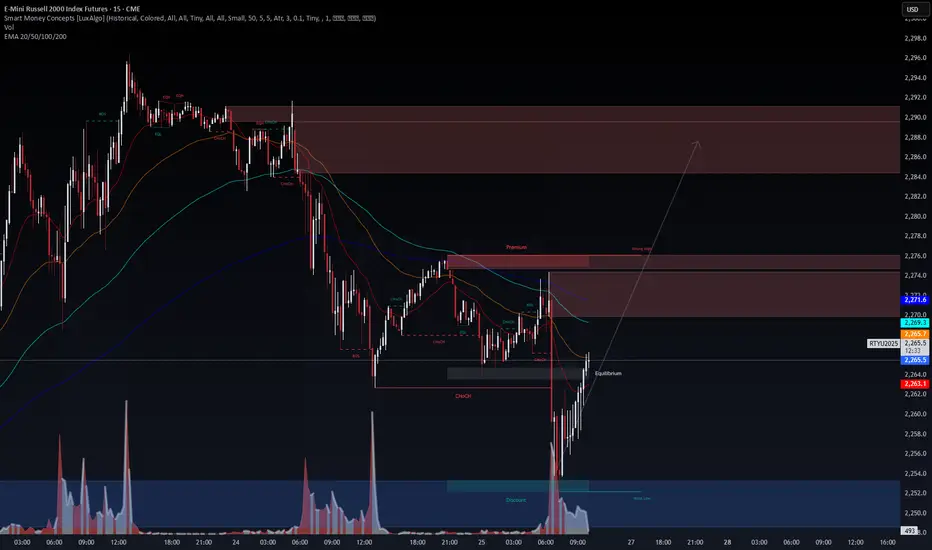
RUT vs IWM – VolanX Sees the Same PulseThe Russell 2000 (RUT) is echoing IWM’s footprint with precision. Both charts are cycling through a similar Smart Money Concepts (SMC) structure – BOS, CHoCH, and strong liquidity grabs.
VolanX reads this as accumulation in the discount zone, preparing for a premium drive toward 2,288+.
Equilibrium
Related futures
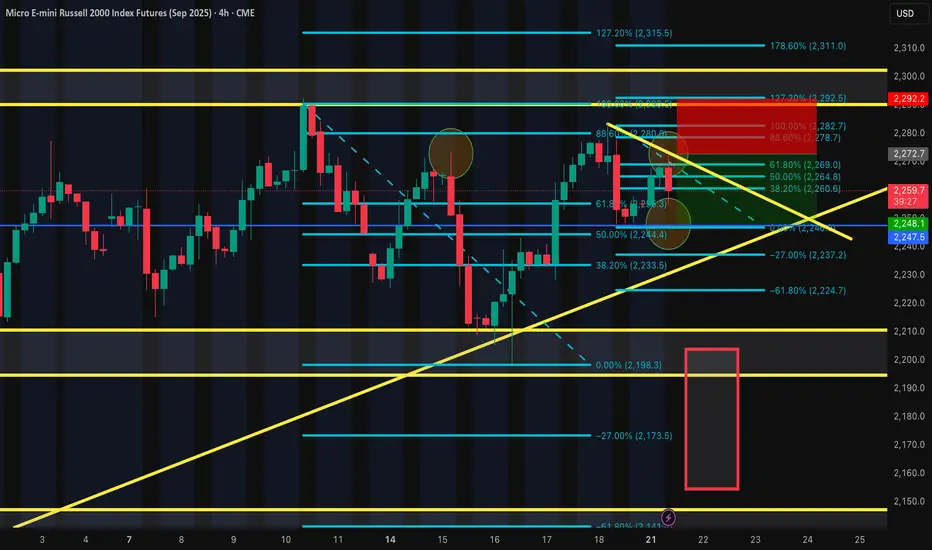
The Russell SELL Trade IdeaWe are currently SHORT on the Russell. I expect the price to hit the 2247 level within the next 24-48 hours. Let me know your thoughts.
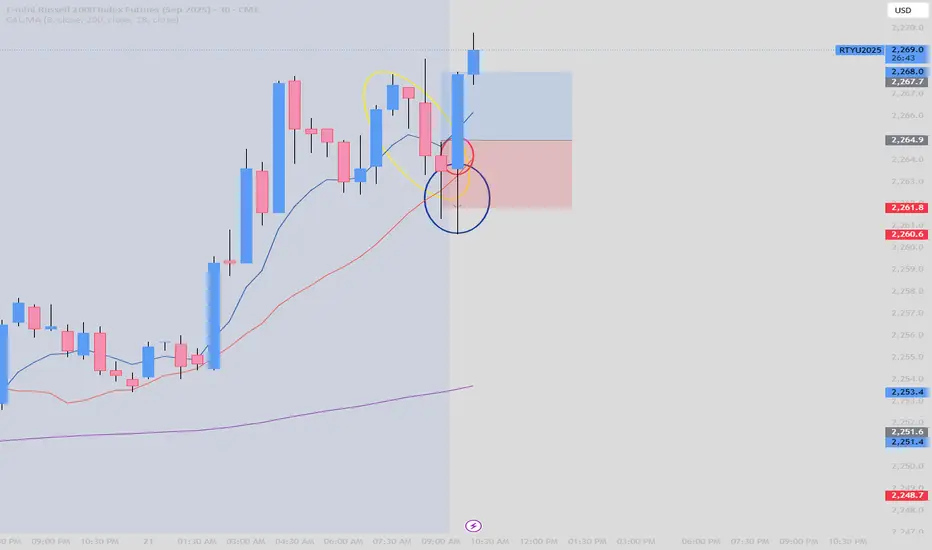
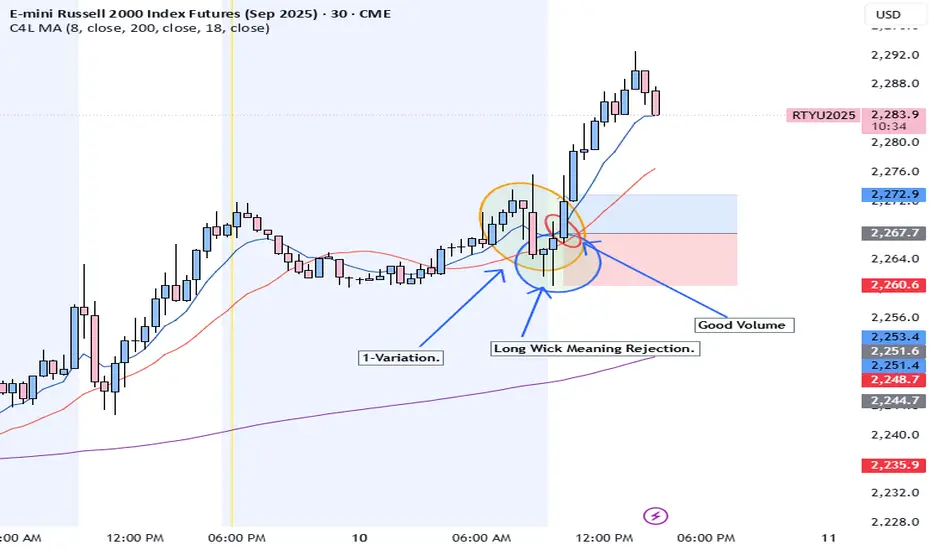
07/21 Trade for RussellPatience is key.
1. Variation (Yellow): Wait for the downside to end and the wick to confirm the rejection to the downside and buy when its on the way up.
2.Wick(Blue): I had to adjust the time frames for confirmation so I used 15min and 30min to adjust my entry.
3.Volume: I had the strengt
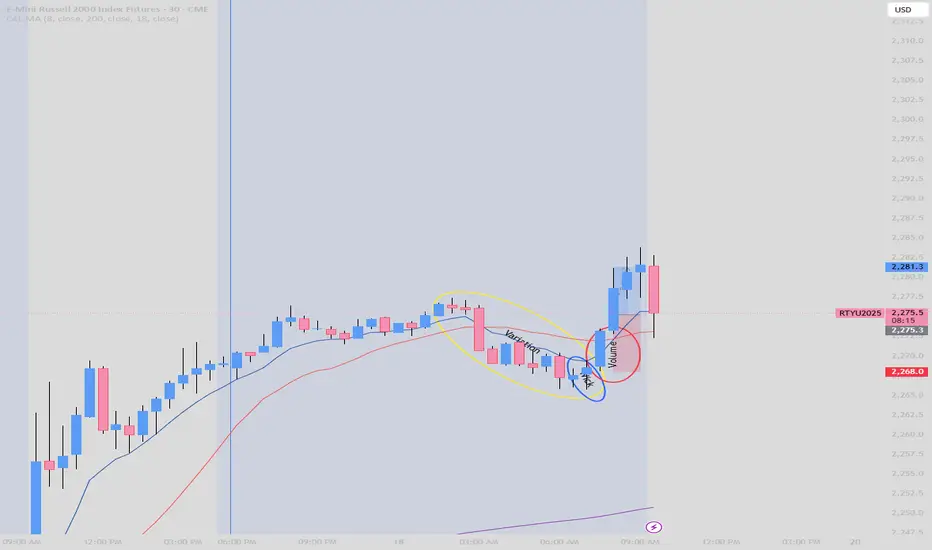
07/18 Trade Russel1. Variation: As we can see over and over again the bears(sellers) were losing momentum so I had to wait for their downfall.
Variation in this strategy in simple words is basically when you see a mix of bearish and bullish candles but on a downtrend. The whole point of the strategy is to buy when
07/10 Trade with RTYUThe strategy is simple.
1. Variation: We need to wait for variation to the down side (bearish trend losing strength). As soon as I saw that the momentum with the Bears ( selling action) was coming to an end I waited for the second step in the strategy which is.....
2. Rejection Wick We need to
RUSSELL 2000 STILL IN BUY ZONE!Hey Traders so here we can see that it's building support levels and holding. So imo this is a bullish sign if Nasdaq 100 continues to rise I think it should push Russell higher as Nasdaq normally leads the market.
So if you are bullish make sure you put your stop below a good support level.
If be

28% Profits Possible for Small CapsIt appears that small caps (and major large-cap stocks) are at a crucial point currently. The price breaking out of the bump-and-run pattern to the upside, combined with a neutral Fear and Greed Index, suggests a potential continuation of the bull run. The target is approximately $2,750, regardless

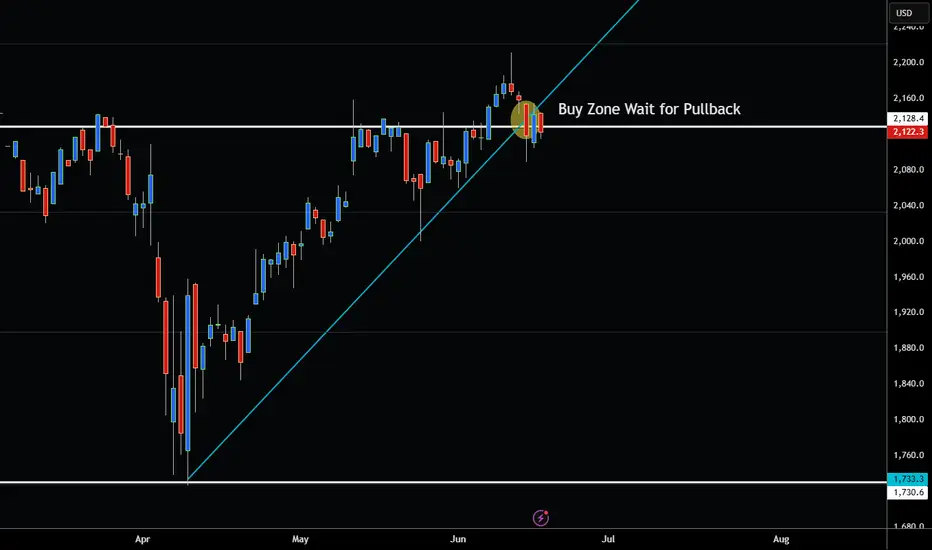
RUSSELL 2000 PULLS BACK TO TRENDLINE SUPPORT ZONE WATCHING! Hey Traders so today continuing previous chart on Russell 2000 so as you can see markets always do eventually pull back most of the time.
So what now?
Well support at 2127 seems to want to hold. FED meeting tommorow of course could change that.
Always expect the unxepected in trading!
I am bu
Russell 2000 Breaks Above 50% Fibonacci Retracement Level!Hey Traders today was checking out the Russell 2000 again and it's bullish momentum is increasing fast.
But it's looking a little overbought now and so are the other indexes it's been an nice leg up so far and Im not saying it can't continue but remember what goes up must come down eventually. In

Waiting to see how the market absorbs tariffsThe S&P 500 daily chart on Tuesday has positioned itself to evaluate how the market will absorb the 50% increase in tariffs on steel and aluminum which will begin Tuesday night.

See all ideas
Summarizing what the indicators are suggesting.
Neutral
SellBuy
Strong sellStrong buy
Strong sellSellNeutralBuyStrong buy
Neutral
SellBuy
Strong sellStrong buy
Strong sellSellNeutralBuyStrong buy
Neutral
SellBuy
Strong sellStrong buy
Strong sellSellNeutralBuyStrong buy
A representation of what an asset is worth today and what the market thinks it will be worth in the future.
Frequently Asked Questions
The current price of E-mini Russell 2000 Index Futures (Dec 2027) is 2,433.7 USD — it has risen 0.34% in the past 24 hours. Watch E-mini Russell 2000 Index Futures (Dec 2027) price in more detail on the chart.
Track more important stats on the E-mini Russell 2000 Index Futures (Dec 2027) chart.
The nearest expiration date for E-mini Russell 2000 Index Futures (Dec 2027) is Dec 17, 2027.
Traders prefer to sell futures contracts when they've already made money on the investment, but still have plenty of time left before the expiration date. Thus, many consider it a good option to sell E-mini Russell 2000 Index Futures (Dec 2027) before Dec 17, 2027.
Buying or selling futures contracts depends on many factors: season, underlying commodity, your own trading strategy. So mostly it's up to you, but if you look for some certain calculations to take into account, you can study technical analysis for E-mini Russell 2000 Index Futures (Dec 2027). Today its technical rating is buy, but remember that market conditions change all the time, so it's always crucial to do your own research. See more of E-mini Russell 2000 Index Futures (Dec 2027) technicals for a more comprehensive analysis.