Global Activities are looking to Push Gold bullishWaiting to see a full on break out before confirming its going to be bullish for the week but it sure does look like that's what its going to be for the next few days. Just be patient and wait for price to confirm.
GC1! trade ideas

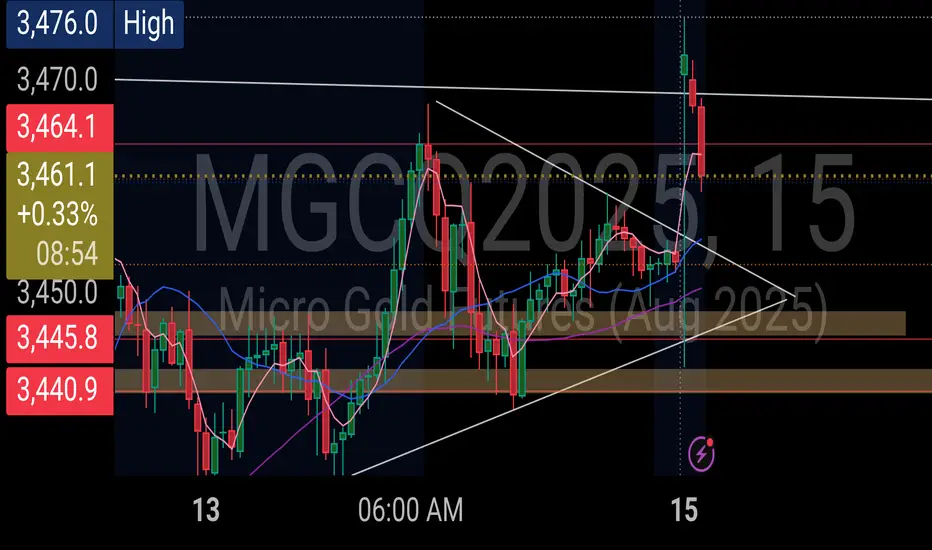
Opening gap manifests... Likely retrace too cover gap. I'd watch for 50% of gap before considering possible reentry below recent high. May retest. 👀

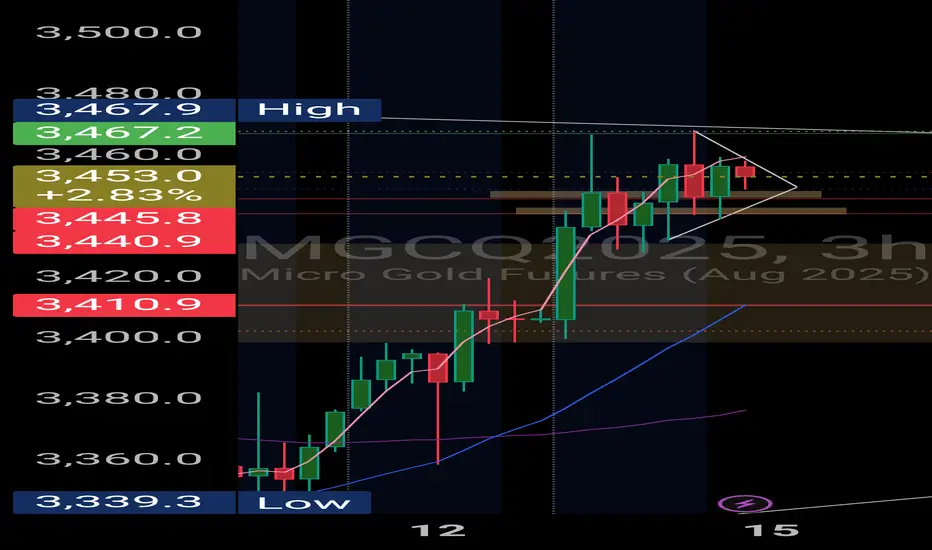
Seeking new ATHAlready broken through top off pennant after long consolidation so likelihood of big drops are slim... and based on events, likelihood of retesting ATH between now and end of the month...

Gold driven by war in middle east Thoughts on gold:
Slight possibility of reversal to 3410.9 (3h 20 EMA). More likely, given war in middle east, is gap open to the downside to cover price to 3446.0...

Supply and Demand Flips. No bias needed. Gold Covering the supply and demand flips on Gold. how to trade without a bias. If the sole goal is to make money then you can trade this. I will make another part 2.

GOLD ANALYSIS FOR THE WEEKI've been studying GOLD (GC) & others and want to share my analysis. Trading involves probabilities, so it's essential to be confident and prepared. Study the market thoroughly before trading with real money.
Let's test strategies this week. You may use a live account if you have capital, and manage your stop losses carefully. Next week, I'll provide more details on entry points and stop losses. Wait for trades at specified levels and avoid positions in the middle to minimize losses. Be patient and trade from one edge to the other.
Good luck and make money.
For one-on-one sessions: $20k per person. You'll learn weekly, monthly, and yearly calculations. Weekly subscriptions are also available for $500 per person. COMEX:GCD1!

$MGC1(Gold) Weekend Update - June 14Hello Fellow Gamblers,
I hope you're not sinking in your twin size bed thinking about your losses from this week.
I am bringing to you a weekend update on gold, so we can get ready for this week. This video is a little bit longer and my ability to speak becomes worse as time extends, so take your time and get your notes right to prepare for the week.
- 3416.2 needs to hold for more upside. A break below that level can take us towards 3358.8.
- A break below 3358.8 validates our bearish scenario.
- A break above 3504.1 validates our bullish scenario.
- Levels to watch: 3416.2, 3358.8, 3504.1

Beginner Friendly Price Action Analysis For GoldIn this video, I demonstrate the process of analyzing a chart from a top down perspective so that the beginner trader can understand the process.

GC1! BuyOverall Gold is Bullish so I wouldn't recommend risking playing the pull back to key level. Setting (1 contract) Buy Limit order for a tap of zone between 3425-3427 on the 5/15 min timeframes. Add to position after reversal confirmation

I'm Buying!Price will go above 3500 just don't know how much. I want to play safe, 1st target @3500. As our 2nd target accomplishes we'll take reverse position on the possible top.

Geopolitical Scenario. Market Outlook during London OpenCovering Gold Dax NQ and other assets with proper reasoning.

Gold Up?Gold might continue to go up even more, seems like a 4th wave in hourly
Price currently at a gap resistance, need to wait and watch what it does
4 Hourly Chart showed price taking a retest of trendline
Daily chart shows a clear ABC wave, possible all time high soon?

What is Gold Silver Spread?What is gold silver spread? How to understand them to determine the market direction.
Reuters mentioned that the gold-silver ratio dropped from 105 to 94. What does this mean? Does it indicate that silver is about to trend higher, or is it a sign that gold will continue its trend?
Micro Silver Futures
Ticker: SIL
Minimum fluctuation:
0.005 per troy ounce = $5.00
Disclaimer:
• What presented here is not a recommendation, please consult your licensed broker.
• Our mission is to create lateral thinking skills for every investor and trader, knowing when to take a calculated risk with market uncertainty and a bolder risk when opportunity arises.
CME Real-time Market Data help identify trading set-ups in real-time and express my market views. If you have futures in your trading portfolio, you can check out on CME Group data plans available that suit your trading needs www.tradingview.com
Trading the Micro: www.cmegroup.com
www.cmegroup.com

New Highs for Gold = New bull RunHere it is!! the breakout I been talking about in my other updates. doing it on a Friday cause Israel is starting ish! Sitting this out cause it can get volatile.

MGC Post Market Update - The Battle of the Two CountsHello Fellow Gamblers,
As you know we are tracking 2 EW counts at this time and they are both still in play.
W5's are tricky to deal with but with a little patience we should be able to make our portfolio grow.
- I am currently looking for bearish divergences to support our bearish Scenario but the current price move strength favors our bullish scenario.
- Be aware of a possible Cup and Handle formation
- Levels to watch: 3508.4, 3441.9, 3365.2, 3314.7.
See you next time!

Gold looks like it might be heading Higher6 12 25 this is a long video hopefully it does not fail to upload. I mentioned a number of markets in this includes some advice to one of my students ( there is only one student right now) and that's perfectly fine for me.... but I wanted her to see a couple of markets that she might not be looking at but her worth looking at if she wants to trade more markets. I did not include agricultural stuff which could be a good choice, but I just don't spend time with it.

$MGC(Gold) EW Recount. Two Possible scenarios!!! - June 11, 2025Hello fellow gamblers,
As you can see in the title, I had to do a recount of my EW analysis for gold since we did fail to break below support towards our Wave C target.
This video is a bit long because i bring 2 different scenarios that could be playing out at this time.
I hope you enjoy!
- Watching for price action behavior near the down trendline and watching for the FVG gap to hold support.
- Levels to watch: 3418.2, 3398, 3360.4, 3324

GC - Gold digging for a possible ShortAfter reaching WL2, we saw a sharp pullback followed by an immediate double top. Price failed to reach the centerline of the yellow fork, instead stalling at the 1/4 line.
Then came the break of the lower median line (L-MLH), a pullback to the white WL1—then the drop began.
If this market can’t push to new highs, we’ll likely fall back into the median line set. A pullback to the upper median line (U-MLH), as indicated by the red arrows, is a probable scenario.
Next stop: the white centerline.
I trade tiny. I trade with extremely high risk-reward setups. I’m fine getting stopped out all the time —because I’m hunting huge moves.
I don’t chase. No FOMO.
It’s how I sleep well, make money from trading and keep my stress level very low.

FUTURES GOLD i LIKE THIS POTENTIAL SETUP. WE are at an area of supply. Price is consolidating. I would like to see price break below that support giving us the notion that price will only correct and sell back to those previous areas of support and I have marked out the tp targets as those areas we might see some strong rejection as price is still very bullish

$MGC (Gold) Pos-Market Update - June 11, 2025Huge moves happening on gold, price is now in a level in which it could invalidate our ABC scenario. At this moment, I'm not changing my bias. I would like to see a break above that 3397.5 level before that happens.
- Key levels: 3397.5, 3387.6, 3372.8, 3366.7, 3339.7

Gold May Continue to Frustrate TradersGold prices have stalled once again and have struggled to make any significant advances since mid-April, remaining stuck in a range between $3,150 and $3,450. This trading range has resulted in sideways price action, with several false starts along the way. However, technical analysis suggests that this range is likely to remain in place.
After breaking above a downtrend in late May — a move that initially appeared convincing, with prices surging to $3,400 — gold has since declined, falling back to $3,300. As of 10 June, it is now retesting that trendline and bouncing at $3,300. This price also represents the 38.2% retracement of the rally from the 15 May intraday low of $3,120 to the 5 June intraday high of $3,400. The combination of the trendline and the Fibonacci retracement level is currently acting as support.
Additionally, the Relative Strength Index (RSI) has broken above a downtrend, indicating a potential shift in momentum. At the time, all of this suggested that gold was likely to retest its previous highs.
However, a new problem has emerged — one that is not particularly favourable for further gains in gold. As of 6 June, the price has fallen below a short-term uptrend and has also stalled at resistance around $3,320.
In addition, the Relative Strength Index has now broken below its own short-term uptrend and is nearing the 50 level — a potentially bearish signal. If these developments are signs that all is not well, then gold could be expected to revisit its early May lows, around $3,100.
As things stand, there are two viable paths for gold, and it is far from easy to determine which one is the correct one. Unfortunately, both scenarios suggest that gold is likely to remain range-bound for some time yet.
Written by Michael J. Kramer, founder of Mott Capital Management.
Disclaimer: CMC Markets is an execution-only service provider. The material (whether or not it states any opinions) is for general information purposes only and does not take into account your personal circumstances or objectives. Nothing in this material is (or should be considered to be) financial, investment or other advice on which reliance should be placed.
No opinion given in the material constitutes a recommendation by CMC Markets or the author that any particular investment, security, transaction, or investment strategy is suitable for any specific person. The material has not been prepared in accordance with legal requirements designed to promote the independence of investment research. Although we are not specifically prevented from dealing before providing this material, we do not seek to take advantage of the material prior to its dissemination.
