Gold LongsBullish weekly bias for Gold.
Classic Expansion Weekly profile in play. Price opened lower first, Im treating this as the possible manipulation for the week. Tuesday swept key ssl and closed back inside the range.
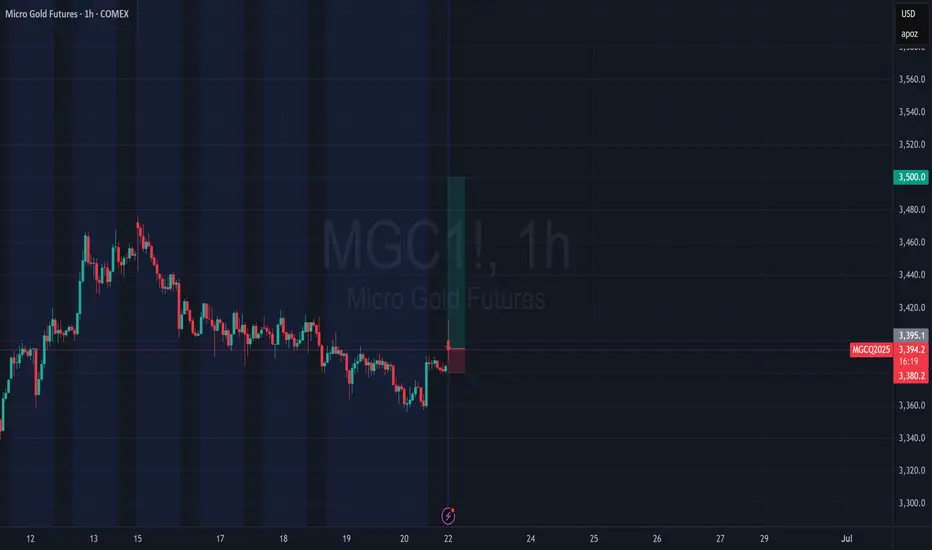
Drop to a 4h and OB is confirmed. 1h CISD aligned with 4h. Execution off 4h OB with stop at OB Low / Tuesday low. If BSL is the draw, I would like to see Tuesday low be protected.
LRLR is first low hanging fruit objective. 3420 roughly, with equal highs at 3476 being final target.
GC1! trade ideas

Gold Market Under Pressure - Key Support Levels📉 Update – Gold
Since Friday the 13th, buyers have been squeezed and sellers have taken control of the market.
The trend is currently bearish, and large buyers are not present. The price could drop toward the 3320 – 3298 zone.
If this zone is broken, we could see a further decline toward 3255 – 3175.
Today, while watching the New York session using order flow, we saw large buy orders hit the market.

Global Gold at the Crossroads of CrisisGold’s response to historic geopolitical crises demonstrates that while “big fear” is rapidly priced in, the durability of rallies—or the depth of corrections—depends on a confluence of monetary policy, dollar valuation, oil prices, and the genuine scale of the threat.
At present, the gold market sits squarely between global “fear of instability” and “hope for de-escalation.” Divergent signals from the Fed, global central banks, and oil markets only deepen volatility, making investor decisions more complex. As previous wars (Iran–Iraq, Ukraine) have shown, gold is prone to both scenarios, but its long-term direction will be shaped by a mix of economic, policy, and psychological factors.

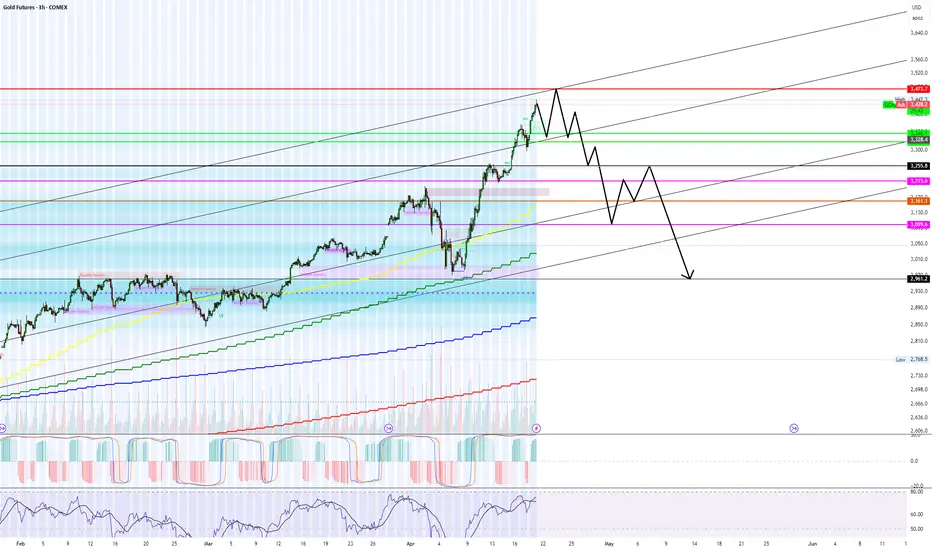
Agree to disagree... Gold is topping right now.My price path seen above is a complete guess but it stems from long term trend lines and more importantly order flow from last week.
On Thursday there was a #1 trade on AMEX:PHYS for $200+ Million at the green levels in my chart above (Equivalent levels). PRICE WILL 100% go to my green lines by end of this week 04/25.
We are over shooting the dark pool sale but a lot, however, this is always to trap retail and create fomo/peak fear.
In the correction/recession cycles, gold ALWAYS TOPS LAST before the crash...
Gold Builds Bullish Momentum After $3,294.0 ReboundGold bounced from $3,294.0, forming a double bottom pattern as XAU/USD consolidates near $3,330.0. Stochastic has exited oversold territory, signaling strengthening bullish momentum.
If $3,294.0 holds as support, the uptrend may continue toward the $3,393.0 target.
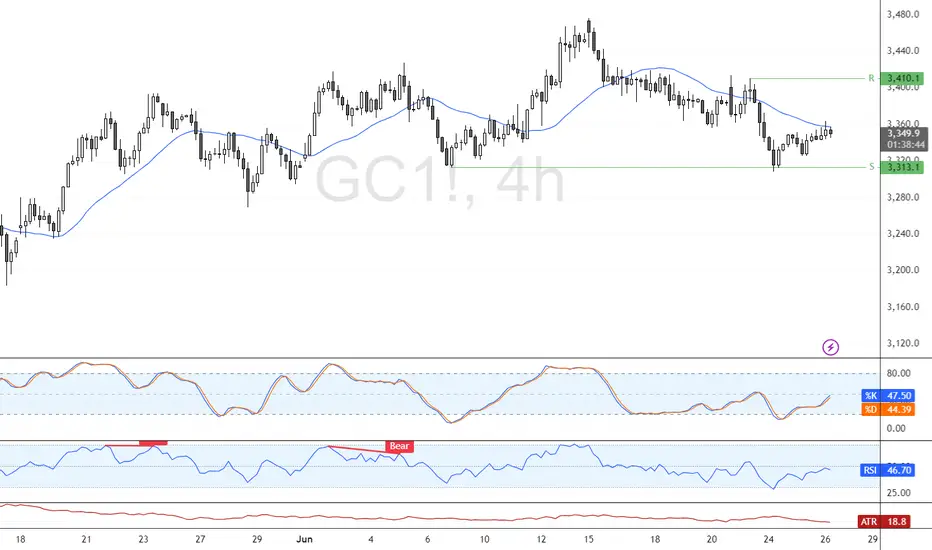
GOLD Can Turn Bearish Now, After Completing a 50% Retracement!GOLD futures analysis for Wed Jun 26th.
Price reached the -FVGand is reacting to it now.
This, after pulling back tothe 50% fib.
Should the FVG fail, Gold is bullish. This is not
supported by fundamentals, though.
As the market environment is more risk on than
off, I expect the -FVG to hold, and the retracement
of the last impulsive move down to end, and a new
bearish leg to begin.
Enjoy!
May profits be upon you.
Leave any questions or comments in the comment section.
I appreciate any feedback from my viewers!
Like and/or subscribe if you want more accurate analysis.
Thank you so much!
Disclaimer:
I do not provide personal investment advice and I am not a qualified licensed investment advisor.
All information found here, including any ideas, opinions, views, predictions, forecasts, commentaries, suggestions, expressed or implied herein, are for informational, entertainment or educational purposes only and should not be construed as personal investment advice. While the information provided is believed to be accurate, it may include errors or inaccuracies.
I will not and cannot be held liable for any actions you take as a result of anything you read here.
Conduct your own due diligence, or consult a licensed financial advisor or broker before making any and all investment decisions. Any investments, trades, speculations, or decisions made on the basis of any information found on this channel, expressed or implied herein, are committed at your own risk, financial or otherwise.

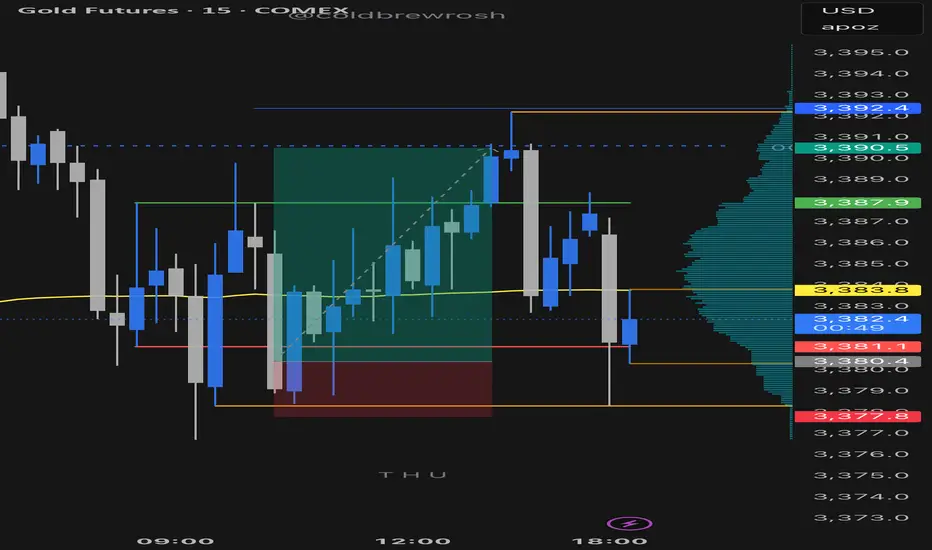
Gold now pushing bullish for new LevelsWaited for this Move all day yesterday and it didnt start till London session. Oh well happens some time! Looking for the Weekly Low level to be broken so we can continue the bullish activity.

Patience has to be the Major Play in waiting on these Set ups! Was waiting for the sweep on gold to happen and they didnt do it till the very end of the day yesterday. Looking for the bullish action to continue. If we can get a breakout tonight then i will look for possible levels of support.

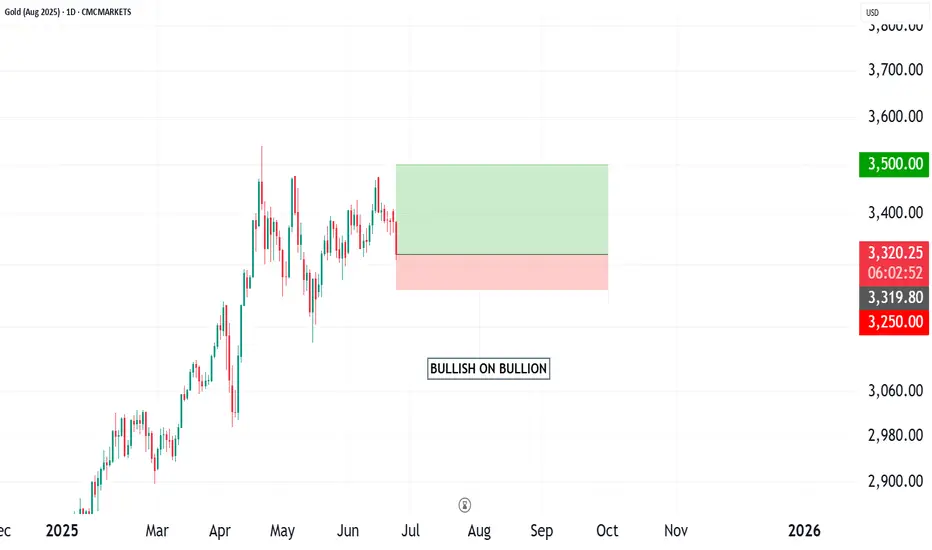
BULLISH ON BULLIONI believe the up trend shall resume now...
Global Equities inversion on lines of geo-political un-certainties can fuel this comeback
$MGC / $GC / Gold - Target acquired! Where are we going next.Hello fellow gamblers,
Price did not go all the way inside the target range, but it is close enough for me to be satisfied with the play and take profits. Now it is the time to be looking for where we are going next.
- I am already seeing some reversal signals in the 15min TF but no signals in the higher TFs.
- For now, we will continue going lower as long as the blue trendline is not broken, but it is possible for price to have a bounce before continuing lower. If price breaks above 3357, I am looking at that FVG gap as a possible target for the bounce.
- It is possible for price to touch that yellow trendline in the bounce, so I'll be paying attention to it.
- If we get a rejection of 3357, I can see price filling our W2 Target range and finding support at 3283. A break of that level could take us all the way down to 3222.8 - 3174.4 range shown in the chart.
- For bullish scenario, I'd want a break above 3418, but i do believe that it is still early to talk bullish scenarios, so I'll leave it for next time.
- Levels to watch: 3418 - 3357 - 3283 - 3207

GOLD FUTURES: LOADED COIL OR BREAKDOWN RISK
### 📉 **GOLD FUTURES: Loaded Coil or Breakdown Risk?**
**Symbol:** MGCQ25 / MGC1!
**Date:** June 24, 2025
**Session:** NY Open Pre-Market
---
### 🔍 **Top-Down Analysis (TE GRID Aligned)**
#### 🕵️♂️ 1D Macro Bias:
Gold’s daily candle is an aggressive rejection off the \$3,400s with a break of the prior demand zone. Heavy volume on the red day signals **institutional unwinding** 📉. Price cracked through the previous bullish imbalance zone and now floats just above key structural support at **\$3,295**.
* 🟣 **Bias:** **Bearish until proven otherwise**
* ⚠️ Watch: If today closes below \$3,295, opens door for \$3,170 sweep
---
#### 🧠 4H/1H HTF Structure:
* 4H shows textbook lower high + BOS formation — order blocks at **\$3,378–\$3,400** rejected price multiple times.
* 1H VWAP anchored from the last major high at \$3,400 is pressing down — no reclaim, no rally.
* Big liquidity cluster sits below at **\$3,170–\$3,130**, possibly magnetic.
🔵 **HTF TE GRID Check**:
* ✅ HTF Bias: Bearish
* ✅ No support reclaim
* ✅ Liquidity below
→ **Short bias confirmed**
---
#### 🧪 15m Intraday Liquidity Check:
* VWAP = resistance
* EQ (Equilibrium) from consolidation = broken
* Price action: forming lower highs beneath \$3,336–\$3,340
* Volume dropping on minor pullbacks = weak buyer response
🔴 **Intraday Bias:** Fade rallies into HTF resistance
---
### ⚔️ **TE GRID Trade Setup Ideas** (Execution-Ready)
#### 🎯 **Setup #1 – HTF Supply Rejection Short**
* 🔹 *Entry:* \$3,336–\$3,340 zone (intraday VWAP retest)
* 🔹 *Stop:* Above \$3,350 (invalidates idea)
* 🔹 *Target 1:* \$3,295 (gap fill)
* 🔹 *Target 2:* \$3,170 (macro sweep target)
* 🧠 *TE GRID Alignment:*
* HTF down ✅
* Liquidity above swept ✅
* Rejection from imbalance ✅
#### 🎯 **Setup #2 – Breakdown Momentum Play**
* 🔹 *Entry:* Break & retest of \$3,295
* 🔹 *Stop:* Above \$3,305
* 🔹 *Target:* \$3,170 → \$3,130
* 🧠 *TE GRID Alignment:*
* Structure BOS ✅
* Rejection of EQ ✅
* No buyer absorption ✅
---
---
🚨 **Gold Futures Breakdown In Progress — Powell Speech Could Seal the Deal** 🧠💣
Gold is under heavy pressure as the market rotates out of safe havens amid a cooling in geopolitical risk — but price action says this isn’t over yet 👀.
The **Israel–Iran ceasefire** may have stunned gold bulls, but the real signal is coming from **macro and technical structure**. Powell’s testimony today could either validate the Fed’s dovish lean — or crush the dollar further. Either way, volatility is loading. ⚡️
---
📉 **TE GRID Top-Down Breakdown**
1️⃣ **Daily:** Bearish rejection from prior demand
2️⃣ **4H/1H:** Rejected from VWAP and macro imbalance at \$3,378–\$3,400
3️⃣ **15m:** Weak bounce volume, liquidity gaps below = fade rallies
---
🎯 **Key Trade Levels:**
* **Short Zone:** \$3,336–\$3,340
* **Breakdown Trigger:** \$3,295
* **Targets:**
* \$3,170 = HTF liquidity draw 🧲
* \$3,130 = macro flush if Powell disappoints 🪓
---
⚖️ **Narrative:**
Gold is stuck between **a falling dollar** and a **waning fear premium**. Powell is the final wildcard — if he leans dovish, the dollar could slide further. But without structural reclaim, **gold remains a short-the-rip environment**. Stay tactical. Let price confirm before you commit. 🧠📉
---
🛑 *Disclaimer:* Not financial advice. This is professional-grade trade research. Execute with precision.

Gold GC1! heading to $3,476 next with a 4.15R long trade TVC:GOLD Gold/ COMEX:GC1! hit the 0.705 fib level right between the 0.618 and 0.786 what I like to call the sweet spot for fibonacci tools. If it misses the 0.618 then the 0.705 is just as good, signals are showing a bottom forming and slowly but sure the rsi is about to cross up over 50, it should pump hard this time
-4.15R trade
-1.5% capital risk
-as soon as gold starts to move, we'll drag our stop loss to or even past break even if it really pops up hard...

Move\Manipulate/Grab/Consolidate/PushFIrst ever idea on trading view.
Bias: Bullish
I have deveoped a stratagey that uses the Trend indicator (2.3) by dviz
Wont say everything but if you get a candle whos body is completly in the "cloud" of the trend indicator.. this is a signal
candle body
1 must be smaller than the wick
2 wick has to be wick outside the cloud
green candle for reversal
red hold
70 tick stop
+50 tick tp1
+70 tick tp2
+120 tick tp1
when trade hits tp1 = risk free trade

Have we made a Low for the Week yet on Gold???Im looking for price to sweep Monday's low before deciding what it wants to do. I want to see everything line up inside of the killzone to take advantage. Just have to be patient. We still have a lil time so sitting on my hands until it all looks clear to proceed with the move.

$GC/$MGC/Gold - Weekend UpdateHello Fellow Gamblers,
Gold is currently playing with our feelings. We've been trough these short up and downs this past week but I believe that we are now ready for a reversal. Price had a good bounce from the 3357 support, which broke the minor trendline and is now creating a flag pattern, hinting at a possible continuation.
- We need 3357 to hold and a break of 3418 and 3442 for a continuation up.
- A break below 3357 will bring us back to our bearish scenario.
- Levels to watch: 3283, 3357, 3418, 3504

Gold: Bullish Pitchfork Holds Despite TurbulenceRecent geopolitical activity has caused turbulence in Gold Markets. News agencies are reporting stabilisation and the Pitchfork remains bullish.

Gold Slides as Markets Downplay the Fallout of ME EscalationGold prices are trending lower today after a slight positive open, struggling to hold near $3,365 per ounce, hovering just above the lowest level in over ten days.
This weak performance comes as markets continue to downplay the consequences of the unprecedented U.S. strike on Iran’s nuclear facilities.
Previously, experts had viewed a strike on Iran’s nuclear sites as the line between a limited bilateral conflict with Israel and a full-blown regional war with global economic costs. Fears centered around a potential Iranian—or proxy—attack on the region’s vital oil and gas infrastructure, which supplies over a fifth of global energy needs.
However, those fears have yet to materialize, offering markets some reassurance that the escalation will not trigger a major shock that could reignite concerns over global economic stability. This narrative of containment has stripped gold of the geopolitical risk premium it previously enjoyed.
According to the New York Times , some experts believe Iran is unlikely to disrupt energy flows in the region as long as its own export facilities remain intact. In another word, any Iranian attempt to destabilize energy markets may invite retaliatory strikes on its own vital oil infrastructure—further damaging its already fragile economy. Axios quoted Brookings Institution foreign policy director Suzanne Maloney describing Iran’s parliamentary call to shut the Strait of Hormuz as symbolic, arguing that the Islamic Republic is unlikely to risk its economy or the rapprochements with Gulf neighbors.
That said, the Middle East’s unpredictable trajectory, with near-daily escalations, continues to unsettle markets and sustain elevated risk appetite, which could ultimately benefit gold.
In a New York Times opinion piece , Nicholas Kristof outlined three key risks that could stem from the U.S. strike on Iranian nuclear facilities: the nature of Iran’s response, whether the strike set back or accelerated Iran’s nuclear ambitions, and whether this is a step toward a broader war.
Iran’s response could range from symbolic gestures to reckless escalation, potentially dragging the U.S. deeper into direct involvement.
According to the Wall Street Journal , Tehran may choose to strike at evacuated U.S. bases in the region, as it did in response to the 2020 assassination of Qassem Soleimani, when Iran targeted the Ain al-Asad base in Iraq in what was described as a calculated, non-escalatory response. Alternatively, Iran could intensify missile strikes on Israel—viewed by some as Washington’s largest forward base—thus keeping the conflict somewhat localized for now.
Still, Iranian Supreme Leader Ayatollah Ali Khamenei may ultimately reject a ceasefire, unlike what his predecessor Ayatollah Ruhollah Khomeini did in the late 1980s to preserve the Islamic Republic. This keeps the door open to new and unpredictable rounds of conflict, according to The Times .
On the nuclear front, Washington Post columnist David Ignatius warned in an opinion piece that Iran could pursue a crude radioactive “dirty bomb” using highly enriched near weapons-grade enriched uranium. Such a scenario would also be dangerously uncertain. In my opinion, it is unlikely that the U.S. or Israel would simply stand down after such a development, possibly setting the stage for the most extreme and dangerous escalation yet.
This could align with the protracted duration of the war and reports that Israel’s defensive missile stockpiles are running low, which raising the stakes. Israel may feel compelled to force Iran into surrender, as the U.S. did with Japan, though unlike Japan, Iran could be a nuclear state. Given Prime Minister Netanyahu’s political stance, a settlement that leaves Iran’s nuclear or ballistic program intact is unlikely to be accepted. Iran, for its part, firmly rejects dismantling its programs, adding to the likelihood of prolonged conflict and worst-case scenario.
Despite the market’s muted reaction to the U.S. strike, the surrounding risks remain significant and unresolved. As long as their realization remains uncertain, volatility in gold and oil prices may persist until the conflict is either resolved or definitively contained.
Samer Hasn

New Week! New Opportunities on GOLD! With the recent activity in the middle east expecting prices to continue bullish. I was looking for this move last week but it seems the holiday delayed the process. If we can get a full breakout above the previous daily High level that will be confidence that we are moving bullish for the rest of the week.

Is Gold Bullish or Bearish? Coin Flip For Next WeekBullish Pennant or Bearish Weekly close for next week on Gold. Coinflip on the chart patterns. If Trump decides to bomb Iran definitely Gold Moon job. Trump said he will make that decision within 2 weeks.

YERPMGC1! Multi-Timeframe Technical Analysis – 8H & 2H by GOAT
This dual-chart setup provides an advanced Elliott Wave and pattern-based analysis on Micro Gold Futures (MGC1!), combining macro context from the 8-hour chart with precision from the 2-hour timeframe. The analysis incorporates trend channels, corrective structures, RSI divergences, and potential trade setups.
🟡 Left Panel – 8H Chart:
Trend Structure: Price is respecting a rising wedge pattern with multiple internal flags and channels, indicating a loss of bullish momentum at the top of the structure.
Resistance Zones: Key supply levels are marked between 3,429 – 3,537, with price recently rejecting from this upper zone.
Descending Channel: Current consolidation is forming a minor falling wedge, which could provide a temporary bounce before potential further downside.
Support Levels to Watch:
3,343: Minor structural support
3,312 – 3,268: Major demand area (also aligns with previous breakout retest zone)
RSI Context: Oscillator is hovering near the midpoint (~50), showing indecision. Previous bearish divergences from highs hint at weakening momentum.
🟡 Right Panel – 2H Chart:
Elliott Wave Structure: A completed 5-wave impulse has been marked, followed by a corrective ABC pattern potentially unfolding.
Scenario 1 (Bearish): Price rallies toward the yellow resistance trendline (Wave B) and rejects, completing Wave C toward 3,316 – 3,268.
Scenario 2 (Bullish): Price breaks out of the falling wedge early, retests, and continues toward 3,429 – 3,475.
Bollinger Bands: Price has re-entered mid-band territory, showing that volatility is compressing before a directional move.
RSI Analysis:
Multiple bearish divergences are visible, particularly between Waves 3 and 5.
RSI currently rising after a bounce from near 30, suggesting temporary strength, but still under 50.
🧠 Summary:
Gold is currently in a corrective phase following a 5-wave bullish impulse. While a temporary bounce is possible from the current wedge, the broader pattern points to a likely C-leg down unless key resistance (~3,394–3,429) is broken decisively. RSI divergence across both timeframes supports caution on long bias until trend confirmation returns.
⚙️ Chart prepared for educational and strategic planning. Not financial advice.

Holiday yesterday so no play! can we get it today?As we get ready to close out the week we are looking for the reversal to play out. We have been in a casual consolidation all week. Just looking for price to step outside of value one more time so that we can get a entry for it to continue pushing bullish.

AM gold futures trade. Change in rhe state of delivery with Footprint confirmation for the buy. 3 hours to finish due to market conditions but over 1k booked.