Close out the Week STRONGLooks like price has found its bottom and is ready to push from here. We are looking for a strong forceful break out from this zone so we can go for the higher levels. Everything looks right from here and value keeps shifting up. I know we should get a solid entry but waiting for it to line up with
Contract highlights
Related commodities

Gold explosion will be short livedThe price explosion in gold is solely due to the tariffs.
I don’t even want to go into detail about what impact this will have on the USA. I’ll just say this much: I feel sorry for the American people, and it’s not their fault.
And here, once again, we see the universal law of physics inherent in

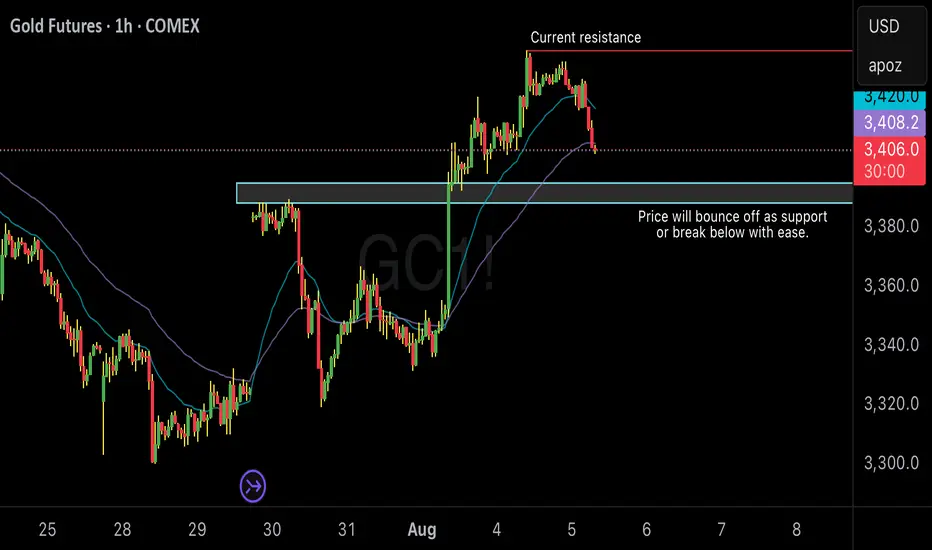
Gold is testing minor support and resistance I see gold trying to maintain above the $3400 level. I think today we will test $3390 - $3400 as a support level. If price breaks below $3388 I would entertain sells down to $3360 or $3350
If price bounces off the $3390 level, then I’m immediately looking for buys and looking to hold until $3480 or
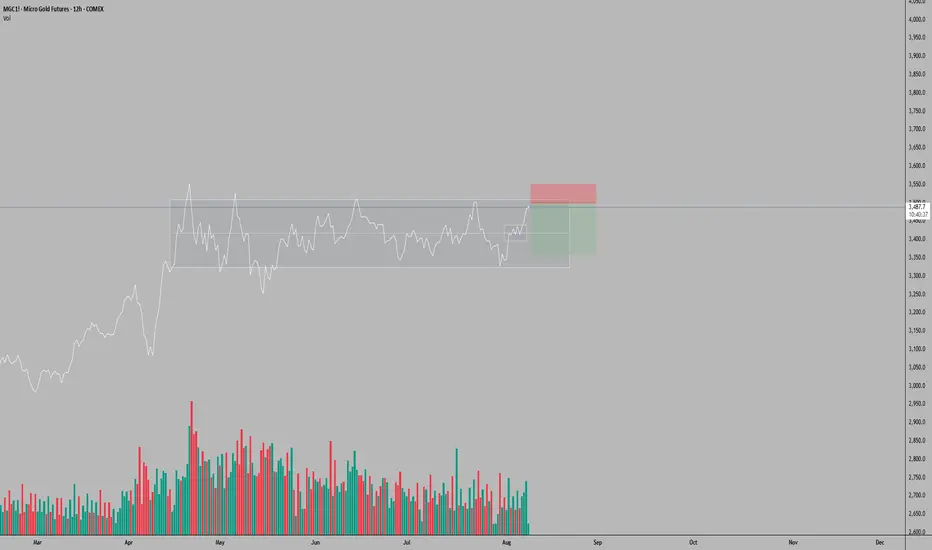
MGC (Micro Gold Futures) Trade Setup – 12H TimeframeOn the 12-hour timeframe, MGC has returned to the upper boundary of the horizontal range established since April 14, 2025. A surge in positive volume on August 7 was preceded by a sharp uptick beginning August 6, followed today by noticeably shallower volume—suggesting volume exhaustion and a potent
Gold: $3,348.0 Resistance in Focus for BullsFenzoFx—Gold's decline reached the ascending trendline near $3,314.0. The bullish trend remains intact while price holds above the trendline.
Immediate resistance is $3,348.0, and a close above this level could lift the market toward $3,389.0 and potentially $3,451.0, aligning with recent higher-l

Gold Daily Bias – Bulls Have the Ball, But Watch the TrapGold Daily Chart – August Outlook
Bias is still bullish for August.
Price is holding well above the big 3M FVG ($2,900–$3,100).
Strong bounce from Weekly Low ($3,331) heading toward Weekly High ($3,416).
Above $3,416 we’ve got $3,451 (M-H) and ATH ($3,508) as liquidity targets .
Seasonal tai

Gold’s on a Roller Coaster — and We’re Riding It Down🎢 Gold’s on a Roller Coaster — and We’re Riding It Down 🎢
Gold just snapped up like it saw Trump tweet “TARIFFS ARE BACK” — but the move smells like a knee-jerk algo pump, not real conviction. We just rejected right into a thin-volume imbalance zone and tagged the underside of a long-standing trend
Gold Update 06AUG2025: Price Tests ResistanceThe Triangle pattern in gold futures remains highly reliable.
Wave E held above the low of Wave C, maintaining the structure.
Price is now testing the Triangle’s upper resistance.
A breakout above this level would confirm the bullish setup.
The target zone remains unchanged: $3,900–$4,300.

Gold – Eyeing the H4 FVG Before the Next Bull RunPrice has been consolidating within the current Asian range after running last week’s high and today’s daily high. The move into D-H lacked strong momentum, and with a large unfilled H4 Fair Value Gap (3,350–3,372) below, I’m anticipating a retracement to rebalance liquidity before resuming the bull

Gold Fails to Break Tuesday’s High – H4 FVG Still in SightGold continues to coil beneath Tuesday’s high, showing signs of failed bullish follow-through. Price attempted to press higher but couldn’t break out — a sign that sellers may still be in control. We’re still under key resistance at the Daily High, and that unfilled H4 Fair Value Gap below remains a

See all ideas
Summarizing what the indicators are suggesting.
Neutral
SellBuy
Strong sellStrong buy
Strong sellSellNeutralBuyStrong buy
Neutral
SellBuy
Strong sellStrong buy
Strong sellSellNeutralBuyStrong buy
Neutral
SellBuy
Strong sellStrong buy
Strong sellSellNeutralBuyStrong buy
A representation of what an asset is worth today and what the market thinks it will be worth in the future.
Frequently Asked Questions
The current price of Gold Futures (Jan 2027) is 3,598.3 USD / APZ — it has risen 0.41% in the past 24 hours. Watch Gold Futures (Jan 2027) price in more detail on the chart.
Track more important stats on the Gold Futures (Jan 2027) chart.
The nearest expiration date for Gold Futures (Jan 2027) is Jan 27, 2027.
Traders prefer to sell futures contracts when they've already made money on the investment, but still have plenty of time left before the expiration date. Thus, many consider it a good option to sell Gold Futures (Jan 2027) before Jan 27, 2027.
Open interest is the number of contracts held by traders in active positions — they're not closed or expired. For Gold Futures (Jan 2027) this number is 0.00. You can use it to track a prevailing market trend and adjust your own strategy: declining open interest for Gold Futures (Jan 2027) shows that traders are closing their positions, which means a weakening trend.
Buying or selling futures contracts depends on many factors: season, underlying commodity, your own trading strategy. So mostly it's up to you, but if you look for some certain calculations to take into account, you can study technical analysis for Gold Futures (Jan 2027). Today its technical rating is strong buy, but remember that market conditions change all the time, so it's always crucial to do your own research. See more of Gold Futures (Jan 2027) technicals for a more comprehensive analysis.