Copper going for itLooks like it could make a run here above this level and a breakout from the ascending triangle.
HG1! trade ideas

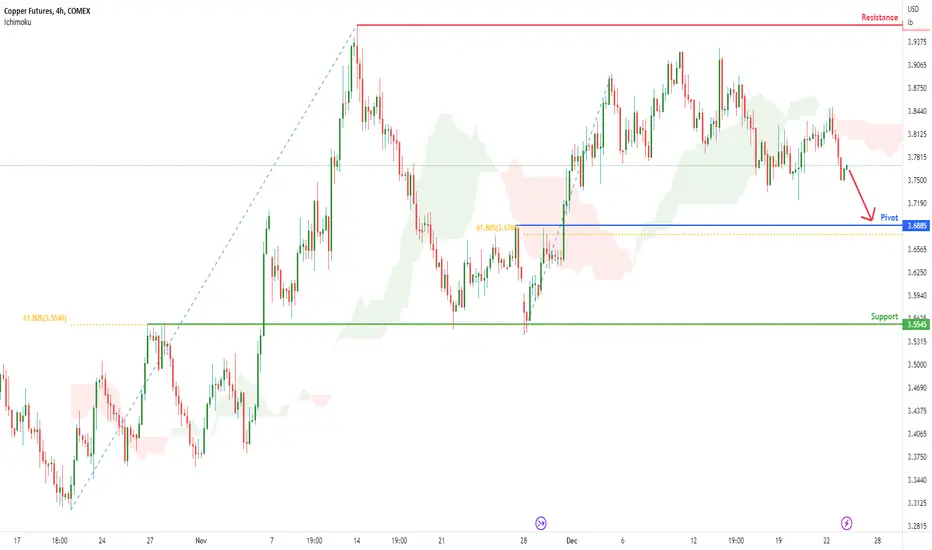
Copper Futures (HG1!), H4 Potential for Bearish DropTitle: Copper Futures (HG1!), H4 Potential for Bearish Drop
Type: Bearish Drop
Resistance: 3.9600
Pivot: 3.6885
Support: 3.5545
Preferred case: Looking at the H4 chart, my overall bias for HG1! is bearish due to the current price being below the Ichimoku cloud , indicating a bearish market. If this bearish momentum continues, expect price to head back down towards the pivot at 3.6885 where the 61.8% Fibonacci line is.
Alternative scenario: Price may possibly head towards the resistance at 3.9600, where the previous swing high is.
Fundamentals: There are no major news.

Update on my previous copper ideasDespite Copper falling 38% from its ATHs, we still haven't seen deflation, even though inflation seems to have peaked for now. The inflation story doesn't seem to be over; even inflation moderates and goes close to or below 2%. The big problem right now is that the Copper inventories are extremely low and that the demand for Copper seems to be increasing because of all the green technologies that are being developed. Therefore despite the high-interest rates and the drop in the money supply globally (reduction in overall liquidity, along with a strong dollar), it is possible to see Copper rally higher from here. With the recent drop in the dollar and the potential peak in the USD and short-term interest rates, the market may have bottomed.
Of course, this isn't the only reason the market has bottomed. Copper fell a lot, and it hit critical support. They seem to have bottomed at their previous significant highs along with Silver and reversed the upside. I don't think the final bottom is in, although it could be. In my opinion, the market is heading towards 4$ in the short term. Still, in a long time, it is directed towards 2.7$, and maybe even towards 1.6-1.9$ if we get the short-term deflationary collapse, I expect. After the failure, I think new ATHs will come, as Central Banks and Governments globally will print insane amounts of money to save their economies from collapsing.

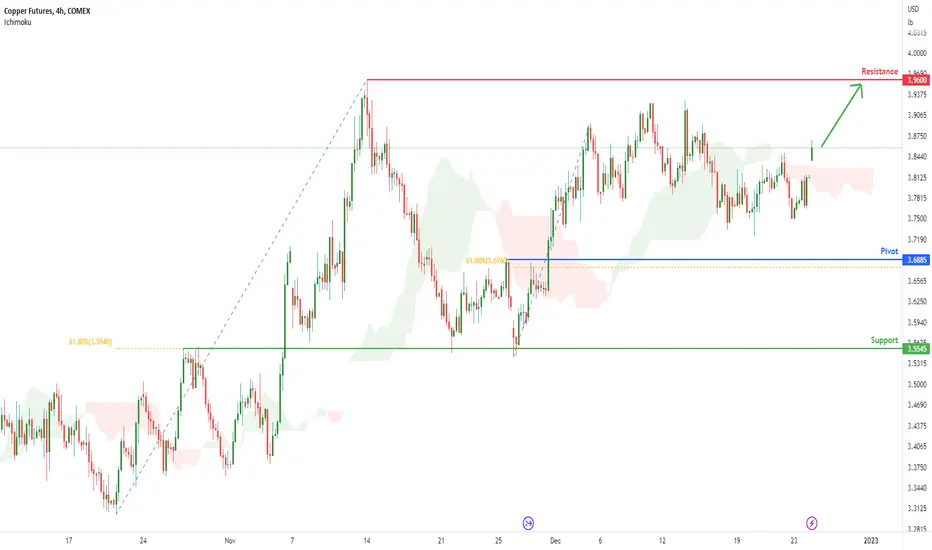
Copper Futures (HG1!), H4 Potential for Bullish RiseTitle: Copper Futures (HG1!), H4 Potential for Bullish Rise
Type: Bullish Rise
Resistance: 3.9600
Pivot: 3.6885
Support: 3.5545
Preferred case: Looking at the H4 chart, my overall bias for HG1! is bullish due to the current price being above the Ichimoku cloud , indicating a bullish market. If this bullish momentum continues, expect price to possibly head towards the resistance at 3.9600, where the previous swing high is.
Alternative scenario: Price may head back down towards the pivot at 3.6885 where the 61.8% Fibonacci line is.
Fundamentals: There are no major news.

Doctor Copper, another decision point at the daily SMA 200.The copper price is testing the underside of the daily SMA 200, which is trending down. It has been in a grinding rally since July, but this is the obstacle to potentially breaking the downtrend.

Copper Futures (HG1!), H4 Potential for Bullish RiseTitle: Copper Futures (HG1!), H4 Potential for Bullish Rise
Type: Bullish Rise
Resistance: 3.9600
Pivot: 3.6885
Support: 3.5545
Preferred case: Looking at the H4 chart, my overall bias for HG1! is bullish due to the current price being above the Ichimoku cloud, indicating a bullish market. If this bullish momentum continues, expect price to possibly head towards the resistance at 3.9600, where the previous swing high is.
Alternative scenario: Price may head back down towards the pivot at 3.6885 where the 61.8% Fibonacci line is.
Fundamentals: There are no major news.
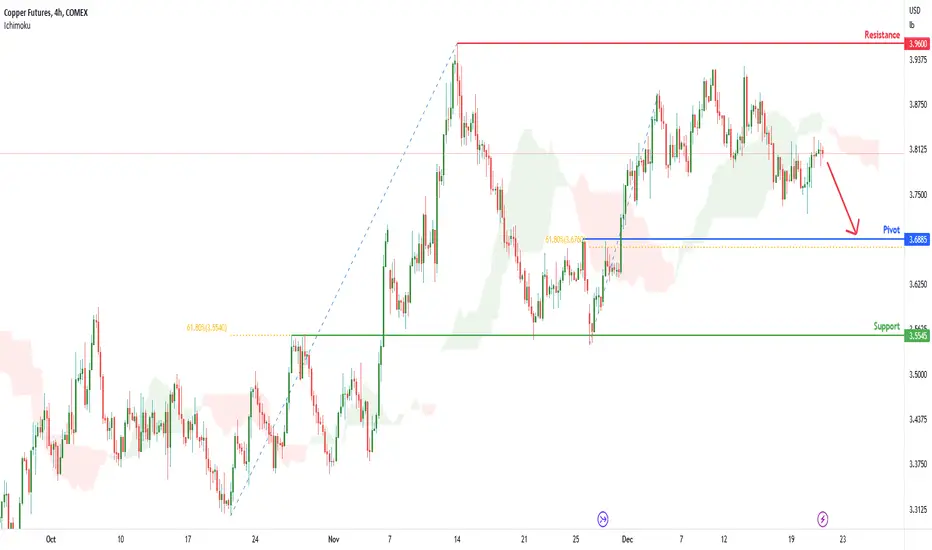
Copper Futures (HG1!), H4 Potential for Bearish DropTitle: Copper Futures (HG1!), H4 Potential for Bearish Drop
Type: Bearish Drop
Resistance: 3.9600
Pivot: 3.6885
Support: 3.5545
Preferred case: Looking at the H4 chart, my overall bias for HG1! is bearish due to the current price crossing above the Ichimoku cloud , indicating a bearish market. If this bearish momentum continues, expect price to possibly head back down towards the pivot at 3.6885 where the 61.8% Fibonacci line is.
Alternative scenario: Price may head towards the resistance at 3.9600, where the previous swing high is.
Fundamentals: There are no major news.
HG1! IDEA 4HOURS TIME FRAME Hello guys this is my trading idea about HG1! .
We have head and shoulder pattern + we get rejected from the resistance at this time we just looking for short trade
Thank you .
Likes and Follow for more ideas Thank you .

Short copper futures ( Mar 2023 )Short at price 3.8430; 3.8635 and 3.8890
Stoploss at 3.9410
Take profit at 3.6475

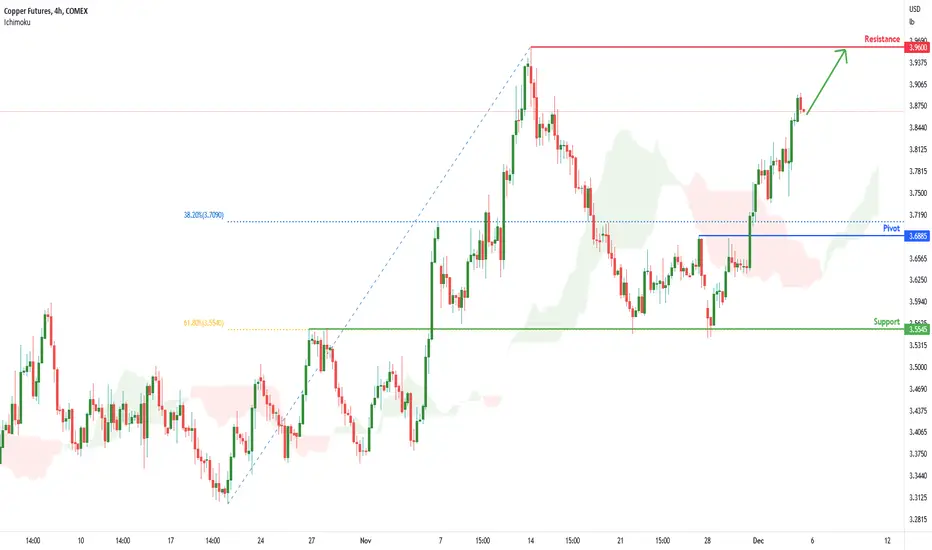
Copper Futures (HG1!), H4 Potential for Bullish ContinuationTitle: Copper Futures (HG1!), H4 Potential for Bullish Continuation
Type: Bullish Continuation
Resistance: 3.9600
Pivot: 3.6885
Support: 3.5545
Preferred case: Looking at the H4 chart, my overall bias for HG1! is bullish due to the current price being above the Ichimoku cloud , indicating a bullish market. If this bullish momentum continues, expect price to possibly continue heading towards the resistance at 3.9600, where the previous swing high is.
Alternative scenario: Price may head back down towards the pivot at 3.6885 where the 61.8% Fibonacci line is.
Fundamentals: There are no major news.

Copper Futures (HG1!), H4 Potential for Bullish ContinuationTitle: Copper Futures (HG1!), H4 Potential for Bullish Continuation
Type: Bullish Continuation
Resistance: 3.9600
Pivot: 3.6885
Support: 3.5545
Preferred case: Looking at the H4 chart, my overall bias for HG1! is bullish due to the current price being above the Ichimoku cloud , indicating a bullish market. If this bullish momentum continues, expect price to possibly continue heading towards the resistance at 3.9600, where the previous swing high is.
Alternative scenario: Price may head back down towards the pivot at 3.6885 where the 28.2% Fibonacci lien is.
Fundamentals: There are no major news.
HG1 Copper longLong term target here for copper. Spent a few hours running fibs across the chart to find confluence. Likely suspect here just above $6

Copper Futures (HG1!), H4 Potential for Bullish ContinuationTitle: Copper Futures (HG1!), H4 Potential for Bullish Continuation
Type: Bullish Continuation
Resistance: 3.9600
Pivot: 3.6885
Support: 3.5545
Preferred case: Looking at the H4 chart, my overall bias for HG1! is bullish due to the current price being above the Ichimoku cloud , indicating a bullish market. If this bullish momentum continues, expect price to possibly continue heading towards the resistance at 3.9600, where the previous swing high is.
Alternative scenario: Price may head back down towards the pivot at 3.6885 where the 28.2% Fibonacci lien is.
Fundamentals: There are no major news.

Copper Futures (HG1!), H4 Potential for Bullish ContinuationTitle: Copper Futures (HG1!), H4 Potential for Bullish Continuation
Type: Bullish Continuation
Resistance: 3.9600
Pivot: 3.6885
Support: 3.5545
Preferred case: Looking at the H4 chart, my overall bias for HG1! is bullish due to the current price being above the Ichimoku cloud, indicating a bullish market. If this bullish momentum continues, expect price to possibly continue heading towards the resistance at 3.9600, where the previous swing high is.
Alternative scenario: Price may head back down towards the pivot at 3.6885 where the 28.2% Fibonacci lien is.
Fundamentals: There are no major news.

Short CopperWe are short Copper. Take profit 3.40 and Stop Loss at 3.70 - a 1.9 Risk to reward ratio. There is a 50% profitability rate for this trade, however considering the prior signal for copper was profitable, the odds of 2 short signals producing a profit in a row is 25%. This trading signal also aligns with our seasonal sentiment of copper over the coming weeks.

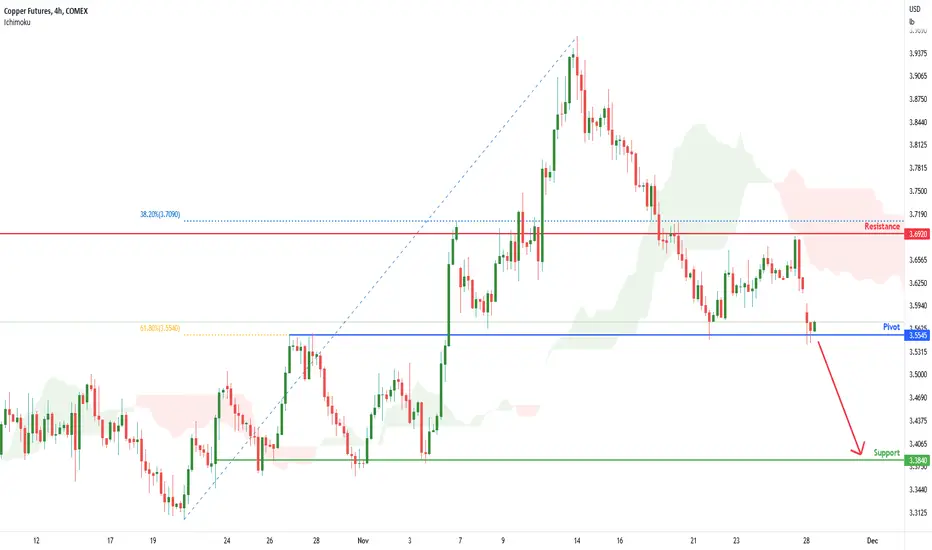
Copper Futures (HG1!), H4 Potential for Bearish DropTitle: Copper Futures (HG1!), H4 Potential for Bearish Drop
Type: Bearish Drop
Resistance: 3.6920
Pivot: 3.5545
Support: 3.3840
Preferred case: On the H4 chart, we have a bearish bias. To add confluence to this, price is under the Ichimoku cloud which indicates a bearish market. If this bearish momentum continues, expect price to possibly break the Pivot at 3.5545, where the 61.8% Fibonacci line is, before heading towards the support level at 3.3840, where the previous swing low is.
Alternative scenario: Price may go back up towards the resistance line at 3.6920, where the 38.2% Fibonacci line is.
Fundamentals: There are no major news.
HG1 Daily Gartley - Played outHG1 daily gartley played out perfectly,
Fibonacci cluster also triggered sells... so played out...
A lot of noise around copper supply constraints now, so possibly more basing may happen before trending much higher, but no clear signal to me yet
