Copper Commodity India Sun Storm Investment Trading Desk & NexGen Wealth Management Service Present's: SSITD & NexGen Portfolio of the Week Series
Focus: Worldwide
By Sun Storm Investment Research & NexGen Wealth Management Service
A Profit & Solutions Strategy & Research
Trading | Investment | Stocks | ETF | Mutual Funds | Crypto | Bonds | Options | Dividend | Futures |
USA | Canada | UK | Germany | France | Italy | Rest of Europe | Mexico | India
Disclaimer: Sun Storm Investment and NexGen are not registered financial advisors, so please do your own research before trading & investing anything. This is information is for only research purposes not for actual trading & investing decision.
#debadipb #profitsolutions
HGS1! trade ideas

Copper May Put in Fresh 2022 Lows if Key Moving Average Breaks Copper prices are probing its 200-day Simple Moving Average after a bout of weakness. A clean break lower would expose the 2022 low at 4.2820, with a deeper pullback potentially threatening the 4.0000 psychological level.

Copper - 26/04/2022the push higher than 5.04 will let us expect that wave 3 of (5) is in play, on the other side the move lower than 4.28 will let us expect that the larger flat correction in wave ((2)) started

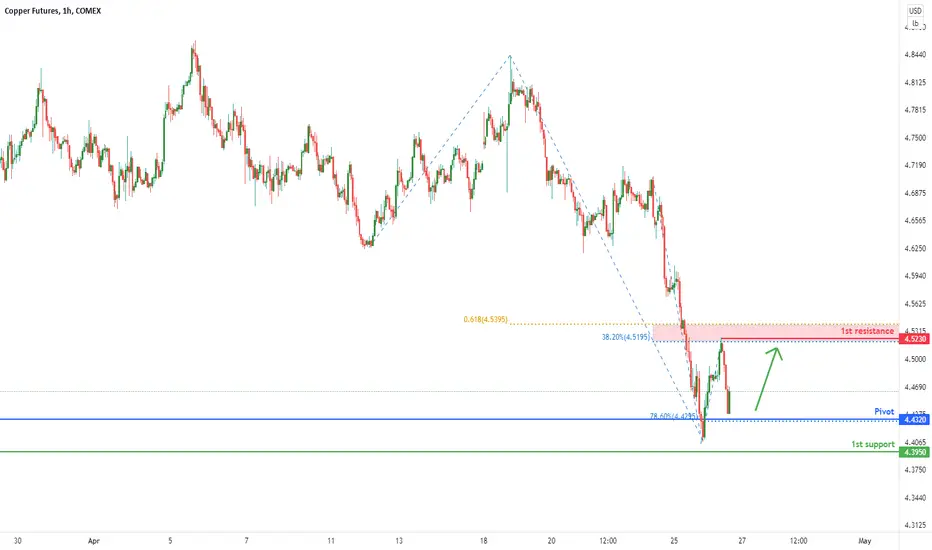
Copper Futures ( HG1!), H1 Potential for Bullish BounceType: Bullish Bounce
Resistance: 4.5230
Pivot: 4.4320
Support: 4.3950
Preferred case: Price is moving nearer to the key pivot level. We are expecting the price to potentially bounce off from our pivot level of 4.4320 in line with 78.6% Fibonacci retracement towards our 1st resistance level of 4.5230 which is in line with 38.2% Fibonacci retracement and 61.8% Fibonacci projection.
Alternative scenario: Otherwise, the price might break our pivot structure and trigger a dip to the 1st support level of 4.3950 in line with a previous horizontal swing low support.
Fundamentals: No major news.
COPPER-NEUTRAL to upsideWe have traded below the cloud like some other precious metals, and now it should relax a little.
Copper current $ 4.55 will consolidate and likely move back towards $ 4.75-4.80. For now if short, take back in profit, or ther wise wait for the up move and go short once again.

Copper: Classic Trend-Following Setup
Copper is trading in a strong bullish trend.
Since the middle of March, the market was consolidating within a horizontal trading range.
The market broke and closed above its upper boundary yesterday.
Now I expect a bullish continuation to 855
❤️Please, support this idea with like and comment!❤️

Copper Futures ( HG1!), H1 Potential for Bearish DipType : Bearish Dip
Resistance : 4.7890
Pivot: 4.7740
Support : 4.7375
Preferred case: We see the potential for a bearish dip from our pivot at 4.7740 in line with 138.2% Fibonacci extension towards our 1st support at 4.7375 in line with 38.2% Fibonacci retracement and 61.8% Fibonacci projection.
Alternative scenario: Alternatively, price may break our pivot structure and head for 1st resistance at 4.7890 in line with 161.8% Fibonacci extension.
Fundamentals: No major news.

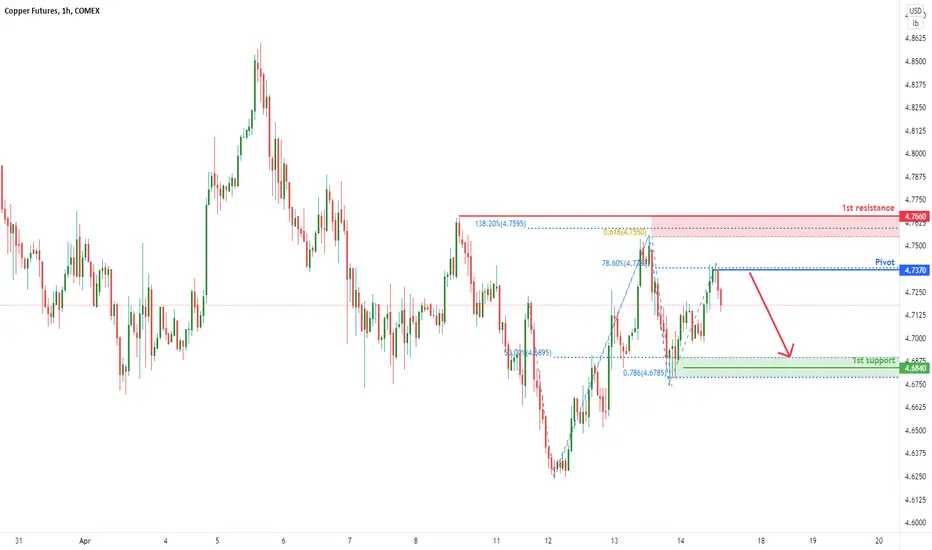
Copper Futures ( HG1!), H1 Potential for Bearish DipType : Bearish Dip
Resistance : 4.7660
Pivot: 4.7370
Support : 4.6840
Preferred case: We see the potential for a bearish continuation from our pivot at 4.7370 in line with 78.6% Fibonacci retracement our 1st support at 4.6840 in line with 50% Fibonacci retracement and 78.6% Fibonacci projection .
Alternative scenario: Alternatively, price may break our pivot structure and head for 1st resistance at 4.7660 in line with 61.8% Fibonacci projection and 138.2% Fibonacci extension .
Fundamentals: No major news.

Copper Futures ( HG1!), H1 Potential for Bearish DipType : Bearish Dip
Resistance : 4.7660
Pivot: 4.7370
Support : 4.6840
Preferred case: We see the potential for a bearish continuation from our pivot at 4.7370 in line with 78.6% Fibonacci retracement our 1st support at 4.6840 in line with 50% Fibonacci retracement and 78.6% Fibonacci projection.
Alternative scenario: Alternatively, price may break our pivot structure and head for 1st resistance at 4.7660 in line with 61.8% Fibonacci projection and 138.2% Fibonacci extension.
Fundamentals: No major news.
Long Copper Signal(HGK22)Long Signal
Entry LMT - 476.50
TP#1 - 486.95
SL - 464.40
**Trading commodity futures and options involves substantial risk of loss.
The recommendations contained in this letter is of opinion only and
does not guarantee any profits. These are risky markets and only
risk capital should be used. Past performance is not indicative of future results**

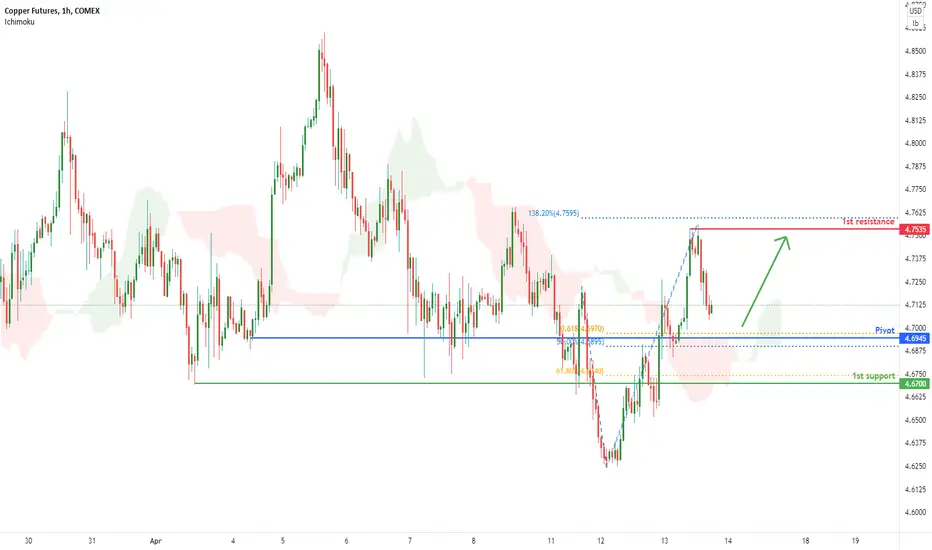
Copper Futures ( HG1!), H1 Potential for Bullish BounceType : Bearish Dip
Resistance :4.7220
Pivot: 4.6690
Support : 4.6145
Preferred case: We see the potential for a dip from our pivot at 4.6690 in line with 38.2% Fibonacci retracement and 78.6% Fibonacci projection towards our 1st support at 4.6145 in line with 78.6% Fibonacci projection and -27.2% Fibonacci expansion. Our bearish bias is supported by price trading below the Ichimoku cloud indicator.
Alternative scenario: Alternatively, price may break our pivot structure and head for 1st resistance at 4.7220 in line with 61.8% Fibonacci retracement and 100% Fibonacci projection.
Fundamentals: No major news.
Copper Futures ( HG1!), H1 Potential for Bearish DipType : Bearish Dip
Resistance :4.7220
Pivot: 4.6690
Support : 4.6145
Preferred case: We see the potential for a dip from our pivot at 4.6690 in line with 38.2% Fibonacci retracement and 78.6% Fibonacci projection towards our 1st support at 4.6145 in line with 78.6% Fibonacci projection and -27.2% Fibonacci expansion. Our bearish bias is supported by price trading below the Ichimoku cloud indicator.
Alternative scenario: Alternatively, price may break our pivot structure and head for 1st resistance at 4.7220 in line with 61.8% Fibonacci retracement and 100% Fibonacci projection.
Fundamentals: No major news.

Leading indicators are BearishVery quickly before the market opens...
The JNK ETF is heading further down for lower low -> Bearish for equities.
The IWM ETF is likely to follow down continuing the candle -> Bearish for equities
The DJT ETF broke support -> Bearish for equities
The VALUG failed the resistance, with a bearish candle for more downside -> Bearish for equities
The TIPS ETF gave up and gave way -> Bearish for equities
The TLT ETF is looking for a non-existent bottom -> no flight to safety. just gave way, period.
The VIX just broke out and checked in at the support... spiking up soon?
The HG1! copper futures stalled at resistance.
Overall, Bearish bias on equities

copper update - 03/04/2022looking higher in wave (3), critical support at 4.4685, key levels to note 4.82 - 5.03

COPPER may reach 5.70 2H2022See chart copper trying to breakout of this consolidation box.
Measured move is 5.70.
Copper is a good indicator of the economy/
Not trading advice

Copper Commodity USA Sun Storm Investment Trading Desk & NexGen Wealth Management Service Present's: SSITD & NexGen Portfolio of the Week Series
Focus: Worldwide
By Sun Storm Investment Research & NexGen Wealth Management Service
A Profit & Solutions Strategy & Research
Trading | Investment | Stocks | ETF | Mutual Funds | Crypto | Bonds | Options | Dividend | Futures |
USA | Canada | UK | Germany | France | Italy | Rest of Europe | Mexico | India
Disclaimer: Sun Storm Investment and NexGen are not registered financial advisors, so please do your own research before trading & investing anything. This is information is for only research purposes not for actual trading & investing decision.
#debadipb #profitsolutions

HGK2022 (Copper Futures) | H1 Bullish PressureType : Bullish Pressure
Resistance : 4.8270
Pivot: 4.7060
Support : 4.6830
Preferred Case: Price is near pivot level of 4.7060 in line with 61.8% Fibonacci retracement . Price can potentially rise up to the 1st resistance level at 4.8120, in line with 138.2% Fibonacci extension and 61.8% Fibonacci projection . Our bullish bias is further supported by the stochastic indicator where it is at support level .
Alternative scenario: Price might also dip towards the 1st support level of 4.6830 in line 78.6% Fibonacci retracement and 78.6% Fibonacci projection .

HGK2022 (Copper Futures) | H1 Bullish PressureType : Bullish Pressure
Resistance : 4.8270
Pivot: 4.7060
Support : 4.6830
Preferred Case: Price is near pivot level of 4.7060 in line with 61.8% Fibonacci retracement. Price can potentially rise up to the 1st resistance level at 4.8120, in line with 138.2% Fibonacci extension and 61.8% Fibonacci projection. Our bullish bias is further supported by the stochastic indicator where it is at support level.
Alternative scenario: Price might also dip towards the 1st support level of 4.6830 in line 78.6% Fibonacci retracement and 78.6% Fibonacci projection.

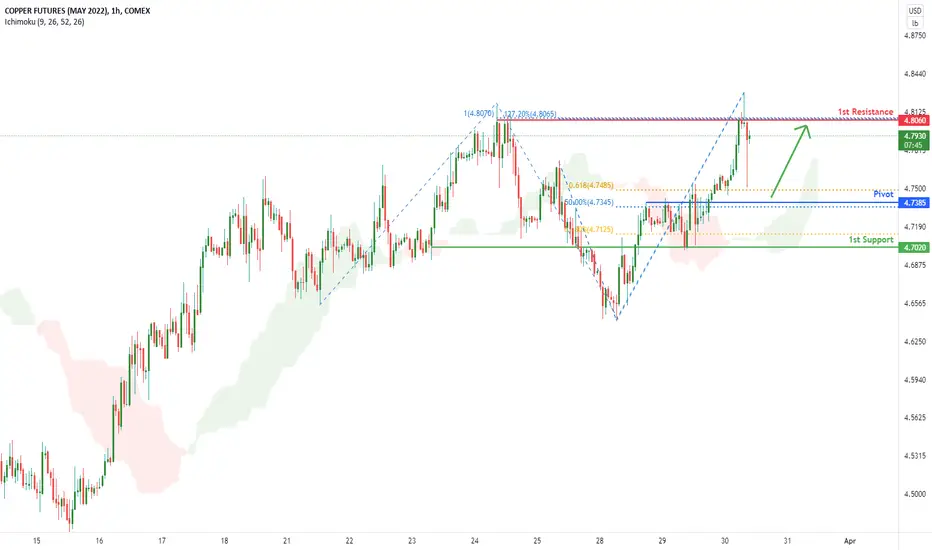
Copper Futures (HGK2022), H1 Bullish BounceType : Bullish Bounce
Resistance : 4.8060
Pivot: 4.7385
Support : 4.7020
Preferred Case: Price is near pivot level of 4.7385 in line with 50% Fibonacci retracement and 61.8% Fibonacci projection. Price can potentially bounce up to the 1st resistance level of 4.8060, in line with 100% Fibonacci projection and 127.2% Fibonacci extension, along with a graphical swing high resistance. Our bullish bias is further supported by price trading below the Ichimoku cloud indicator.
Alternative scenario: Price might continue to drop towards the 1st support level of 4.7020 in line with 61.8% Fibonacci projection.
Fundamentals: No Major News
HGK2022 (Copper Futures) | H1 Bullish PressureType : Bullish Pressure
Resistance : 4.7730
Pivot: 4.7000
Support : 4.6415
Preferred Case: Price is near pivot level of 4.7000 in line with 50% Fibonacci retracement . Price can potentially rise up to the 1st resistance level at 4.7730, in line with 78.6% Fibonacci retracement and 78.6% Fibonacci projection . Our bullish bias is further supported by the stochastic indicator where it is at resistance level .
Alternative scenario: Price might also dip towards the 1st support level of 4.6415 in line with a graphical swing low support.
Fundamentals: No Major News

HGK2022 (Copper Futures) | H1 Bullish PressureType : Bullish Pressure
Resistance : 4.7730
Pivot: 4.7000
Support : 4.6415
Preferred Case: Price is near pivot level of 4.7000 in line with 50% Fibonacci retracement. Price can potentially rise up to the 1st resistance level at 4.7730, in line with 78.6% Fibonacci retracement and 78.6% Fibonacci projection. Our bullish bias is further supported by the stochastic indicator where it is at resistance level.
Alternative scenario: Price might also dip towards the 1st support level of 4.6415 in line with a graphical swing low support.
Fundamentals: No Major News

COPPER, THE MATERIAL THE FUTURE IS MADE OF, MACRO TRADESee chart. COPPER on the verge of a multi DECADES break out. I cant see any better long term investment.
EVERYTHING ABOUT ENERGY IS MADE OF COPPER.
Every single TESLA will use lot of copper.
Every Internet of Things will be made of copper.
Semi-conductors.. shortage? it rhymes with copper shortage as well!
Hell even BITCOIN is basically copper made.
And guess what... copper is not that easy to dig as well.
Join the beautiful people club, trade commodities, trade COPPER!
Target= multi years returns, no target, just a long term holding.
PS: Dont expect it will double in one night, it wont! Follow the dollar to buy the dips.
