11/1/2024. GOLD key areaDaily and hourly chart (left). The daily push higher is in jeopardy, key areas on 1 hour chart failed. Hourly Buyside hold points: 2762, and 2765. Target of 2771 did hit this hour, but failed to hold both TGT and BKH points. Sell stops at 2760 and 2758. by dnelsonsp2
Gold Flashing Warning SignsGold Flashing Warning Signs: Why We’re Taking a Cautious Short Position Today, our Commitment of Traders (COT) strategy triggered a short trade on gold. Yes, we know—shorting gold at all-time highs feels like swimming upstream. But if you’ve been with us long enough, you know we don’t follow the crowd. We follow the data. And the signals? Well, let’s just say they’re getting hard to ignore. To clarify, this setup wasn’t made on a whim. We got the green light when key technical indicators—Momentum, the Detrended Price Oscillator (DPO), and the Commodity Channel Index (CCI)—all confirmed a bearish divergence on the Daily timeframe. Here’s a closer look at what’s guiding our trade: 1. Commercial Traders Are on High Alert Commercial players—those who deal with gold at its core—are positioned short like we haven’t seen in over three years. They’re the steady hands here, and their caution is hard to overlook. It suggests that even in a market frenzy, they’re seeing potential downsides others may not be watching. 2. Retail Speculators Are Leaning Long While not at full extremes, small speculators are heavily positioned on the long side, nearing a six-month high. This confidence could mean trouble—when retail traders load up, it can mark the late stages of a rally. We’re paying attention to this; it’s a classic contrarian indicator. 3. Open Interest Is Surging—But Why? Open interest in gold futures has been climbing steadily. That’s usually a good thing for bulls, but here’s the twist: large and small speculators have been driving this uptrend. If these buyers lose momentum, who’s left to push prices higher? 4. Sentiment Is Peaking—But Is It Too High? Market sentiment is at a bullish extreme, with advisors optimistic about gold’s rally. High sentiment can be a double-edged sword. It often means there are few people left to buy, and that’s when reversals happen. It’s a classic market psychology moment—and we’re taking note. 5. Gold Is Pricey Relative to Treasuries Using our WillVal indicator, we see that gold is hitting valuation peaks compared to treasuries. This isn’t an automatic sell, but it’s a signal that the precious metal might be pushing its limits. 6. ADX Shows Intense Momentum, But There’s Caution Our ADX indicator is above 40, confirming strong momentum. But we’re cautious here—when the market gets this heated, we often see shifts. Combined with those commercial short positions and high investor sentiment, this momentum could be due for a reality check. 7. Bearish Spread Divergence Is Emerging There’s divergence between the front-month and next-month gold contracts, a sign that underlying strength may be weakening. It’s a small detail, but one that hints the rally might be overextended. 8. Supplementary Indicators Aren't Looking Optimistic Rounding things out, our Insider Acc/Dis, %R, and Stochastic indicators are all showing bearish signals. We don’t rely on these alone, but together, they reinforce the caution signals we’re already seeing. The Bottom Line Shorting gold during a run like this isn’t a decision we take lightly. But the COT data, market positioning, and sentiment suggest a cooling-off period could be near, and the trade was triggered today via the divergence on the daily. Markets have a way of humbling even the most confident predictions, so we approach this trade with an open mind and a healthy dose of caution. If you’re interested in seeing how we analyze trades and approach market extremes, stay tuned.Shortby Tradius_Trades1
Initiated a short position in GOLD, successfully reached target Gold may show bullish momentum at today’s open due to several key factors: Safe-Haven Demand: Rising inflation or economic instability often drives investors toward gold, bolstering its appeal. Weaker Dollar: A softer dollar makes gold more attractive to international buyers, supporting price gains. Interest Rate Outlook: Speculation around potential rate cuts or pauses makes holding gold more favorable, reducing its opportunity cost. Geopolitical Uncertainty: Tensions or instability in global markets can increase demand for gold as a safe asset. Technical Factors: A recent break above resistance or strong support levels can trigger technical buying, reinforcing an uptrend. Longby OssianH2
Why To Buy Gold In 3 StepsLearning how to buy gold was a big challenge because i didn't know the right time to actually buy it It looks simple at first especially when you Listen to some financial market gurus that just say “Buy Gold, dont worry about the price, because its a huge against inflation.” But what if you want to make moeny from the price action? You may be thinking, “Its not possible to make money from the price action” But the truth is its very much possible to make a trae from the gold price action. Here is what i learned: 1. Gold is a protection against inflation 2. Gold performs better than the stock market 3. Gold keeps your buying power Now if you are just beginning at buying Gold then you may buy at the top, which is not a cool place to start from but if you want to learn how to buy Price the right way then keep reading to understand the strategy i use. • Gold Buying Strategy The strategy to buying gold is really not that hard. Because remember you want to buy it in order to proit from the price action right? So maybe you are thinking, “If only i could make so much money from the Gold price action and not worry about storage fees, and delivery fees from physical gold” Thats even the more reason why you have to learn how to buy the gold price action right now. Thats why i use the Rocket booster strategy The rocket booster strategy is a trend following indicator this strategy is very simple and yet very powerful at the same time. What you need to do is try to understand the moving averages of the last 50 days of the price of the asset you are looking at, Then you need to try to understand the moving price average of the last 200 days.Then after that you need to understand the gap up in the price action. • How The Gap Up In Price Action Happens The gap up in price action is a very important step to really think about especailly when you are looking at the gold price. You may be thinking “What if the 50 Moving Average crosses above the 200 Moving average? Isnt that part of the rocket booster strategy?” Listen this past week i saw a stock price that followed the rocket booster strategy and it was trending on social media heavy. When i checked on it today i realised that the price of this particular stock had crashed! “What the hell happend?” I thought to myself. This is not crowd pyschology. Just because a stock is trending on social media does not give you the green light to trade it. Also you have to enter the price action before the gap.Now if you want ro enter after the Gap then thats up to you,But if you want to follow the exact strategy its has to be before the gap. • Why Buying Before The Gap Up Or Rally Up Is Important Listen in trading they are a bunch of theories some say buy before the rally some say before during the price rally. While otehr will a fiancial expert to wait for a hot tip.Sadly even after that hot tip. You will need the confidence of a bull to Pull the trigger.Trading is a mental game. You re playing this game with a bunch people that sadly dont even make the market move at all Now are there some trading pocket opportunities that involve pumps and dumps..yes they are. But remember right now we are looking at the price of gold. You may be thinking, “Gold price action is very boring...why are we addressing this?” Because the market is very quiet right now but you ttrading journey never stops you have to learn more Rocket boost this content to learn more. Disclaimer: Trading is risky you will lose money wether you like it or not please risk managment and profit taking strategies. Longby lubosi2
Gold, before US markets Gold is anticipated to undergo consolidation down prior to the U.S. market open today. Initiating a short position with a target of approximately 2,785.Shortby OssianH2
XS.com: Gold hits more record highs amidst accelerating global Written by Samer Hasn, Senior Market Analyst at XS.com Gold hit more record highs today, barely touching $2,790 an ounce, while December COMEX futures broke above $2,800 for the first time today. Gold’s gains come as demand for gold accelerates amid political and economic uncertainty and still-high levels of geopolitical tension. Today, we saw the World Gold Council’s Q3 Gold Trends Report, which showed that global demand grown by more than 5% year-on-year to over 1,300 tons in Q3, with demand value exceeding $100 billion for the first time. This growth in demand for the second consecutive quarter was driven by increased investment demand, a recovery in jewelry consumption growth, and the return of physical gold ETFs to accumulate bullion for the first time after nine consecutive quarters of selling. As for the supply side, with the successive increase in prices, mine production recorded growth for the second consecutive quarter to reach 989 tons. While producers have almost completely stopped hedging against falling prices, which may reflect their optimism about the future of prices that may continue to gain, which may reduce their desire to hedge, which may be costly. The Wall Street Journal had also reported in March that the desire to hedge has declined in an effort by producers to fully benefit from the upward trend in gold, including the world's largest producer, Newmont, which told the newspaper that it its policy is to not hedge. There are many positive factors supporting the increase in demand for gold, while there does not appear to be a chance towards weakening these factors on the near horizon. In the Middle East, with the approach of the presidential elections in the US, we are witnessing increasing momentum around ceasefire talks, whether in Lebanon or Gaza. This is not the first time, as it was preceded by many previous attempts regarding Gaza, which the US administration said at the time that an agreement was close to being reached, but those negotiations followed only escalated the conflict to become a regional war. Regarding Gaza, which any agreement to stop the war there is expected to push for a calm in the entire region, negotiations are still ongoing this week with the participation of the US. However, it is unlikely that Hamas and Israel will reach an agreement on the terms at least before the end of the elections in the US, according to what The New York Times quoted from officials earlier this week. A Hamas official said yesterday that they will not agree to any agreement that does not include a complete cessation of the war and Israel’s withdrawal from the Strip, which the latter rejects. The Times also quoted officials as saying that the Israeli Prime Minister will wait to know the identity of who will head the White House before entering a diplomatic path – in reference to the bet on Donald Trump’s victory to give Israel a free hand in the region. Therefore, optimism about the calm will not be justified unless an agreement is actually signed, regardless of what the US administration may say later. In Lebanon, the picture may seem more mixed. reported, citing officials, that US President Joe Biden will arrive in Israel on Thursday to try to reach an agreement to end the war in Lebanon. This agreement may take a few weeks according to Axios – beyond the election. It is also worth noting that Israel has abandoned a previous high-ceilinged demand to allow for “active enforcement” in Lebanon against Hezbollah even after the war has stopped, which would have been met with a Lebanese rejection. But there is no indication that the far-right coalition in Israel is lenient in pushing for an agreement and accepting an end to the war, as they call for continued military action and reject any agreement for a permanent calm. After the election, we will be waiting for the next round of attacks and counterattacks between Iran and Israel. The recent Israeli attack on air defense systems surrounding oil infrastructures may suggest its intention to target those facilities in the next round, which may prompt Iran to escalate its counterattack much more than before and to activate the role of its allies in the region more and obstruct the flow of supplies from the Strait of Hormuz, according to what Iranian officials told The Times last week. This will have an impact on the global economy as a whole through higher oil prices and fueling inflation again. That said, I do not think that the region is heading in any direction towards calming down at least in the near future, which may maintain the geopolitical risk premium for gold and push it to continue its historical gains. As for the economic front, the series of labor market numbers in the United States began with a negative surprise in the job openings in the JOLTS report, which was 7.44 million in September, which represents the lowest level in more than three years. This was in contrast to a greater than expected increase in Consumer Confidence Index. While these figures did not change the assumption that the Fed will inevitably cut interest rates at the November and December meetings, they have strengthened it for next January, with a probability of more than 50% that we will see a quarter point cut, according to the CME FedWatch Tool. This contributed to reversing the upward trend in the 10-year Treasury bond yields, which continue to decline today after reaching their highest level in three months, which pave the way for gold to complete its gains. Today and for the rest of this week, we look forward to the continued flow of labor market, GDP and core PCE numbers. While the emergence of more negative surprises could reinforce the negative picture for the US economy and push gold towards further gains by benefiting from the economic uncertainty. Finally, gold is benefiting from the political uncertainty resulting from the approaching US elections, where neither candidate is significantly ahead in the polls. Kamala Harris is still leading by a small margin of 1.4 percentage points in the average polls, according to FiveThirtyEight. In addition, we see repeated talk about concerns about the worsening deficit and government debt, whether Trump or Harris wins, which could weaken the appeal of the dollar and be a positive factor for gold. by SamerHa6
Understanding Gold Panic Selling Reactions BetterThis video is designed to help you better understand how Gold works as a hedge instrument and how to attempt to measure Panic Selling phases in Precious Metals. Metals offer an incredible opportunity when Panic Selling hits. But it can also present some very real risks because of price volatility. Panic selling in the markets is usually an event-driven sell-off in almost all markets (including metals). This type of selling is usually related to traders pulling assets (CASH) away from all market sectors because of some crisis or geopolitical event. It is a way for traders to react to the fear of the event while sometimes ignoring how metals will react to the future revaluation event. Yet, who wants to hold Gold when it may fall 8.5% to 15% throughout this panic selling process? If you learn how to spot the base/bottom efficiently (using my Excess Phase Peak patterns), you'll be able to pinpoint some incredible opportunities in metals. I hope this video helps you to understand exactly how these Panic Selling events unfold - and lear to spot/trade them more efficiently. The reality of the current market environment is that the Trump win is the event (call it a crisis or not - I don't care). This event is causing markets to revalue current asset classes (notice the strength of the US Dollar since Election Day). I believe this revaluation event is nearly over and prices will begin to adjust into what I'm calling my "Anomaly Event" - where price levels settle back into a reversion (normal) type of contraction event before moving into a late-stage Santa Rally. If I'm right, we'll see a base/bottom in metals happen after November 15-19, 2024. Get some. #trading #research #investing #tradingalgos #tradingsignals #cycles #fibonacci #elliotwave #modelingsystems #stocks #bitcoin #btcusd #cryptos #spy #es #nq #gold Long27:42by BradMatheny0
Gold Views as of nowI feel lile buying gold as of nowm consiering price action. Zones as mensioned in the chart drawing.by AMGO_Markets0
11/12/2024 GOLD daily and hourly. Watch 2626 price reaction.Oct 31 hourly sell signal hit, daily chart has just targeted at 2800. continued push down has not put price below Daily sell line. 2624. I will be playing continued downside moves, while also watching for a CHOC. However--->>A hourly buy point 2656 and daily buy point of 2652 is extremely likely to hit, since lots of orders will be sitting there. Hourly charts needs to hold above 2626 first. Watch 2626 price reaction.... will buyers take over and hold, or will sellers hold and push to new lows. by dnelsonsp0
#202445 - priceactiontds - weekly update - gold futuresGood Evening and I hope you are well. tl;dr gold futures: Neutral. Market only went lower through spikes, which were followed by a pullback. This is not as strong as it looks and I do think it’s likely that bears get disappointed next week. 2600 is possible but that is the lowest I can see this going for now. Any long closer to 2626 is an amazing trade. I have an open bull gap there and I highly doubt bears will be able to close it. For now bears have turned the daily 20ema into resistance and if you want higher probability on your longs, wait for a breakout above 2725. Quote from last week: comment: Decent pullback now on the daily chart but still far above the daily 20ema. Friday’s rejection at 2772 was good enough to expect this to break below 2740 for the second leg down. Problem for the bears is, that even if they break below 2720, the downside is probably limited to the bull trend line from August. So clearly a tough spot to trade. Any long closer to 2700 is better than closer to 2750. Same logic for shorts, I think 2800 continues to be a good level to sell and market moves more sideways instead of another break above that price. comment : Bear surprise because they just melted through 2700 and the bull trend line on Wednesday. Bulls retested the bull trend line and got rejected. Bears were also strong enough to keep the market below the daily 20ema and as long as that is the case, bears are in control for now. 2600 is my lower target for the bears and sideways 2600-2720 is the most likely path forward imo. current market cycle: Best guess right now is a bigger trading range 2600-2800. key levels: 2600 - 2800 bull case: Bulls failed at 2700 and if they don’t close a daily bar above 2720 soon, we could test down to 2600, which is where I expect many more buyers to enter the market again. We have an open bull gap, the October low and the weekly 20 ema in the price area. I do think the closer you can long to 2600, the better the trade. Invalidation is below 2600. bear case: Bears had 2 spikes down now and they could get a third before I see this going higher again. Bears know that each sell spike was followed by a bull bar, so the trend down is weak and will likely find it’s bottom soon. Bears will likely wait for another pullback higher to daily 20ema and/or bear trend line around 2710, before trying for a third leg down. Invalidation is above 2730. outlook last week: short term: Slightly bearish for a test down to 2700-2710. → Last Sunday we traded 2749 and now we are at 2694. Good outlook, market got even 50 points lower than my target. Hope you made some. short term: Neutral around 2700. If we stay below 2720, I can see a third leg down to retest 2650 or even go down to 2600/2620. Above 2730 I favor the bulls to go higher again. medium-long term - Update from 2024-11-03: For now I can’t see this breaking above 2800, since the rally was climactic. Until 2600 is broken, I expect sideways movement inside this range. Market should test down to the weekly 20ema over the next weeks/months but bears have absolutely nothing to show for since June and that’s why we can’t expect bigger selling until they clearly do more. Update: Changed 2700 to 2600, since market broke strongly below 2700 already. Trading range is still my preferred path forward, just the lower end went down 100 points. current swing trade: None chart update: Added bear trend lineby priceactiontds0
MGC Short 11/7/2024MGC is in a downtrend in 4hr chart. Placed a short position in confluence HV SZ. Risk= $200. Target= 1:1 and close to daily DZ.Shortby SethuratnaAnbuvinothUpdated 0
BigAskMagnet Institute: The Case for Going Long on Gold FuturesAt BigAskMagnet Institute, we strongly advocate for a long-only approach to gold futures in the current market. Here's why: 1. Fundamental Drivers: Inflation and Currency Risks: Persistently high inflation and weakening currencies are solidifying gold’s position as a hedge. Geopolitical Uncertainty: Ongoing global tensions are fueling demand for safe-haven assets, with gold leading the charge. 2. Technical Strength: Recent price action confirms a strong bullish trend, breaking through critical resistance levels at . BigAskMagnet Institute anticipates further upside potential, with targets at . 3. Long-Only Strategy Benefits: Gold’s long-term value proposition makes short positions riskier in this environment. BigAskMagnet Institute recommends focusing solely on long entries, using pullbacks as buying opportunities. Risk Management Tip: Place stop-losses strategically below key support levels to safeguard your position while allowing for market fluctuations. Gold remains a strong performer in turbulent times, and a long-only strategy ensures traders stay aligned with the dominant trend.Longby BidAskMagnet1
Time to Buy More Gold Futures ContractsAt BigAskMagnet Institute, we believe the time is ripe to increase exposure to gold futures. The precious metal has been demonstrating strong bullish potential, driven by key macroeconomic factors such as rising geopolitical tensions, inflationary pressures, and dovish central bank policies. Key Points: Fundamental Factors: Gold is regaining its status as a safe-haven asset amid global uncertainty. Technical Analysis: Recent price action shows a breakout above , with the next target at . Volume confirms the bullish trend. Risk Management: Suggested stop-loss at to mitigate potential downside risks. Gold futures offer a strategic opportunity to capitalize on the current market environment. BigAskMagnet Institute is here to guide you in navigating these golden opportunities.Longby BidAskMagnet0
Adaptive Volume Flow Indicator (AVFI)The Adaptive Volume Flow Indicator (AVFI) is an advanced version of the traditional Volume Flow Indicator (VFI) that adapts to market conditions by using dynamic volatility and volume thresholds. It improves volume analysis by reducing false signals in low-volatility environments and adjusting sensitivity during high-volatility periods. Key features include: Dynamic volatility cutoff using ATR to adjust sensitivity based on market conditions. Adaptive volume cap that adjusts to the asset’s average volume, avoiding skewed signals. Customizable smoothing methods with options for EMA or SMA. Improved noise filtering, making it more reliable in sideways or low-volume markets. The AVFI helps identify trend strength, volume-driven price movements, and potential reversals, offering a more accurate and adaptable tool for traders.by TradeTrendsPro0
MGC Long 11/6/2024MGC is in a downtrend. Price is testing daily DZ (blue box). Placed a long position in HV DZ. Taking half risk because it is a countertrend trade. Risk= $125. Target= 1:1 and HV SZ.Longby SethuratnaAnbuvinothUpdated 0
GoldAs of November 7, 2024, gold prices have experienced significant volatility, influenced by various global economic and geopolitical factors. Current Price Levels: Gold is trading around $2,734.79 per ounce, slightly below its recent peak of $2,790.15 reached on October 31, 2024. (Reuters) Technical Analysis: • Support Levels: Immediate support is observed at $2,608.30, with stronger support around $2,468.20. (MarketScreener) • Resistance Levels: Key resistance is near the recent high of $2,790.15. (Reuters) • Moving Averages: Gold is trading above its 13, 48, and 200-day EMAs, indicating a sustained bullish trend. (Economies) • Relative Strength Index (RSI): The RSI is around 58.93, suggesting mild bullish momentum without being overbought. (Moneycontrol) Fundamental Factors: • Geopolitical Tensions: Ongoing conflicts in Ukraine and the Middle East have increased gold’s appeal as a safe-haven asset. (Reuters) • U.S. Federal Reserve Policy: Anticipated interest rate cuts by the Federal Reserve are expected to support higher gold prices. (Reuters) • Central Bank Demand: Robust purchases by central banks have bolstered gold demand. (JPMorgan) Outlook: Analysts predict that gold prices could rise to $2,600 or $2,700 by the end of the year, driven by geopolitical uncertainties and expected U.S. Federal Reserve rate cuts. (Reuters) Conclusion: Gold’s technical indicators and fundamental factors suggest a continued bullish trend. Investors should monitor geopolitical developments and central bank policies, as these will significantly influence gold’s trajectory in the coming months. Disclaimer: This analysis is for educational purposes only and should not be construed as financial advice. Always conduct your own research or consult with a financial advisor before making any trading or investment decisions. Longby tintinhawk1
MGC Short 11/3/2024MGC is in a downtrend in 4hr chart with a cross below, retest and follow through (FT). Placed a short position in 1hr HV confluence SZ. Taking half risk because daily and 4hr trends don't match. Also, price is rallying from daily DZ (Blue box). Risk= $125. Target= 1:1 and 3:1.Shortby SethuratnaAnbuvinothUpdated 0
MGC Long 10/29/2024MGC is in an strong uptrend. Made ATH. Placing a long position in 1hr HV DZ far away from MA. Hence, taking half risk. Risk= $124. Target= 1:1 and 3:1.Longby SethuratnaAnbuvinothUpdated 0
Scenario GOLD levels update This view of gold actually somehow confirms that I should be on the good side of the market, outside of the original analysis, we could see a false breakout from which the price consolidated around the zone marked by me, which may show us a head-and-shoulders formation, which may be followed by a correction against this formationLongby Sony970
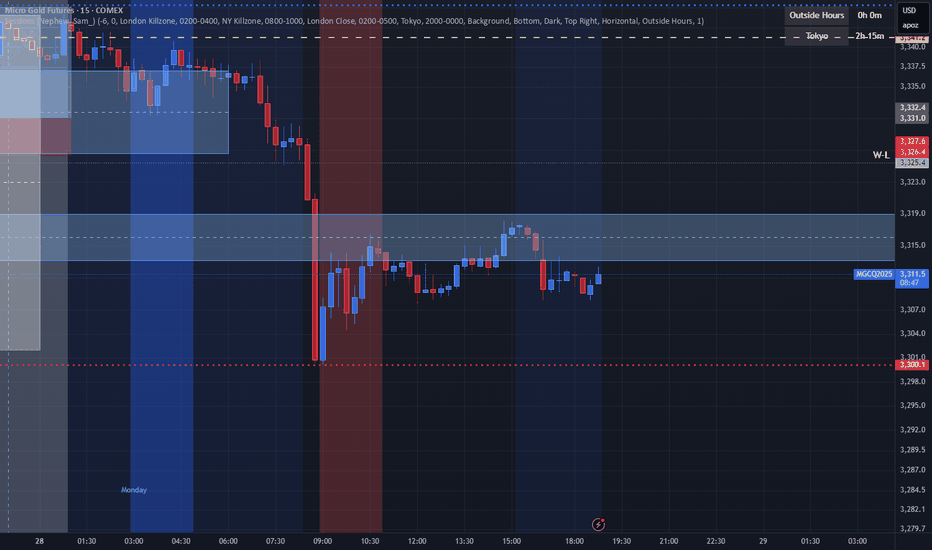
Quick Short Scalp TradeI'm targeting a more risky liquidity however I moved TP a bit lower. If trendline hits and keeps falling great if not and it hits that SSL "red line" then reacts to shoot up i will close trade in some profit. Lets see. I have already entered before posting this. Also this was done on 1 min TF but have to post this as 15min lolShortby FTTGODUpdated 0
Gold Shines Amid Political and Geopolitical UncertaintiesGold trades in positive territory on Monday, supported by risks surrounding the upcoming U.S. presidential election and ongoing geopolitical tensions in the Middle East. These uncertainties enhance gold's appeal as a traditional safe-haven asset, attracting investors looking to shield their portfolios. In the short term, these factors are likely to keep gold’s price elevated. However, the upside for gold is capped by renewed demand for the U.S. dollar and rising U.S. Treasury yields, which make non-yielding assets like gold less attractive. Higher yields increase the opportunity cost of holding gold, thereby limiting its potential for significant gains. Investors are closely monitoring the presidential election on Tuesday, as well as the Federal Reserve’s upcoming rate decision on Thursday. Market expectations lean toward a moderate 25-basis-point rate cut from the Fed, reflecting caution amid electoral uncertainties. This approach could further temper gold’s gains if the dollar remains strong. In summary, while political and geopolitical risks lend support to gold, its upside is constrained by a strong dollar and rising yields, making investors cautious about heavy positioning ahead of key events this week.Longby KingHamma1
gold erl to irl+gold could consolidate a bit then run for late shorts and might stay bullish +took sell side liquidity +disrespected hourly fvg -mss bearish by HumbletradesFX1
First trade toodayFed meeting: If the Fed signals a pause in rate hikes, it could weaken the dollar, which supports gold. Geopolitical uncertainty: Rising global tensions often push investors toward gold as a safe haven. Technical level: prices break and hold above the $2,800 level, it would signal a major bullish moveLongby OssianH0