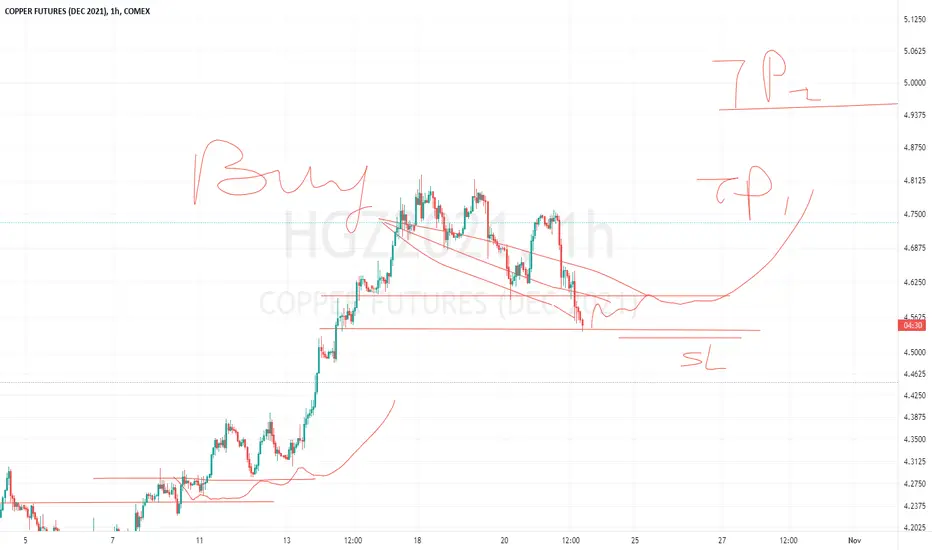
New trading Strategy upgrade - CopperHi traders, this is my personal trading idea only. Please give an AGREE/ LIKE, my trading strategy is Price Auction - using Chart only, your comments are highly welcome. My chaos drawing is not to predict and guess the further, it is my plan where we are on the chart and how we shall trade on what we see. Trade well & Good luck guys.
MHG1! trade ideas
requestedchart has all descriptions
..................................................................................................................................

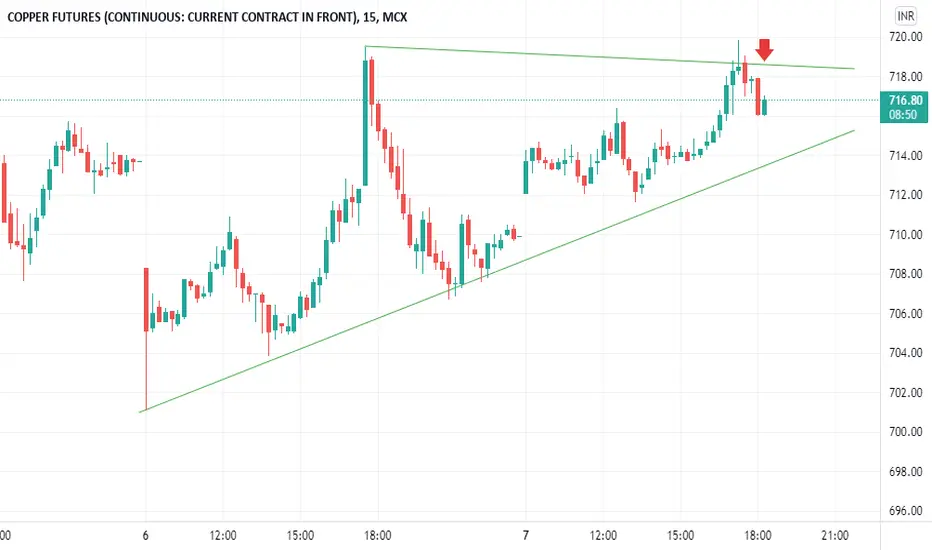
Copper (MCX) Short Term ReversalThe commodity has reached upper trendline and may undergo a correction within range. Trade is supported by resistance Nearby.
Risk Reward Ratio - 2:1
SL is placed above resistance zone & the upper trendline. The target is placed near swing low.

HG1! 1M Comes Copper Futures test
What is HG copper?
Our Copper Futures contract (HG) offers the ability to deliver or take delivery of Grade 1 electrolytic copper cathode in a timely, transparent and efficient fashion at CME Group approved and regulated facilities located throughout the United States.
Short CopperThe Global Economy is slowing down.
China is slowing, DXY is spiking, and the case for base metals is starting to wane.
Looking at things like NG1! and Copper, things are starting to look like blow off tops.
I am slowly building a large longer term Copper short position that I can scale into - TP will me the weekly 50 SMA.
I have found the most rewarding types of trades are the one where things are way off side confirmed by Linear Regression, SMAs, and Bollinger Bands. When you have math giving you a statistical edge, that is something that you can lean into IMO.

Copper - Just the BeginningCopper futures broke out of their wedge this week, with per tonne prices breaking the $10,000 milestone. Names such as Freeport-McMoran (FCX) are benefitting from this, while TRQ is on discount due to. setback in their mining process. Despite Fed tapering, copper is strong, surprisingly. I believe that now is the time to get in "The New Oil", as stated by Goldman Sachs, who gives the commodity a 50% upside before 2025. If copper moving 10% has resulted in Freeport going from $30 to $39, think of what will happen if Goldman and the rest of the Street is right...
Thesis:
Goldman Sachs recently published a note declaring copper "the new oil," and forecasting it could reach $15,000 (50% inc.) by 2025 as the world transitions to clean energy.
As the movement to sustainability/clean energy progresses, the exponential increase in demand for copper will outrun supply due to slow mine creation, centralized property rights.
Although it may take a few years and experience some drawdown, depleted inventories and a demand spike will likely cause the price to rise significantly over the next decade, with Bank of America suggesting a possible 100% increase to $20,000 per metric ton by 2025.
Overall sentiment on the Street is extremely bullish in the mid-to-long-term.

$COPPER see how the lines tell the story? Beautiful!$COPPER heading to BO of its big bullflag with an embedded IH&S
Off to the moon... but may be a smidge of turbulence as she gets north.

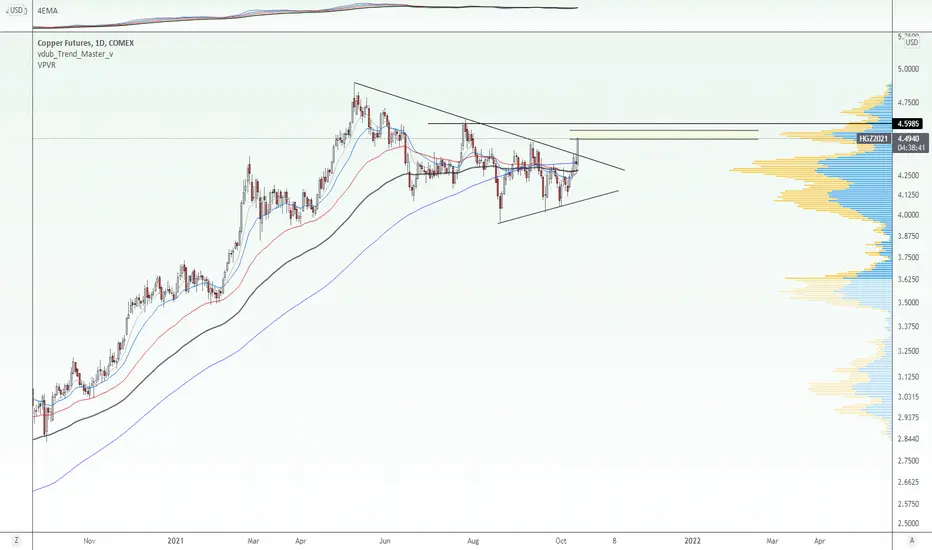
Copper Prices Take Aim for May 2021 High Post Triangle BreakoutCopper futures are aiming for the May high at 812.60 after prices confirmed a breakout above a Descending Triangle chart formation.
The 200-day Simple Moving Average helped maintain the dominant uptrend as the red metal continues to consolidate since earlier this year.
A drop back under the July high at 768.50 could undermine upside progress, reorienting copper back towards the SMA.
Clearing the May high exposes the 78.6% Fibonacci extension at 851.8636 towards the 100% level at 900.60.
COMEX:HG1!

Coppernice blow out of the wedge. bit of volume to chew thru and up more. Dollar down today also but electric vehicle push is heavy. miners are quiet, usually they lead the metal so catch up day and they wait to see. Newfoundgold halted, up 25 % nyse . Labrador gold the twin of it for area play, hope someone played ncu.
Copper Copper has given breakout and looking good to go long
Disclaimer
I am not sebi registered analyst
My studies are Educational purpose only
Please consult with your financial advisor before trading or investing


𝘾𝙤𝙥𝙥𝙚𝙧 𝙁𝙪𝙩𝙪𝙧𝙚𝙨 (𝙃𝙂1!) — 𝙀𝙒𝘼HG1!: 🕐 6h
A big review of this asset is planned for the first half of next year, but decided to make a small update to the count, as the current sideways formation looks very much like a bullish contracting triangle that is about to be completed. On completion of the final wave E of (B) , there will be a good trading setup for a long position.
The wave marking in the double circle parenthesis corresponds to the green marking in the circle on the chart.


nice breakout on copper !breaking top trend resistance, should be back to new highs by mid 2022 in my opinion ! look for a retest of the pink line it just broke recently. good luck traders ! :)

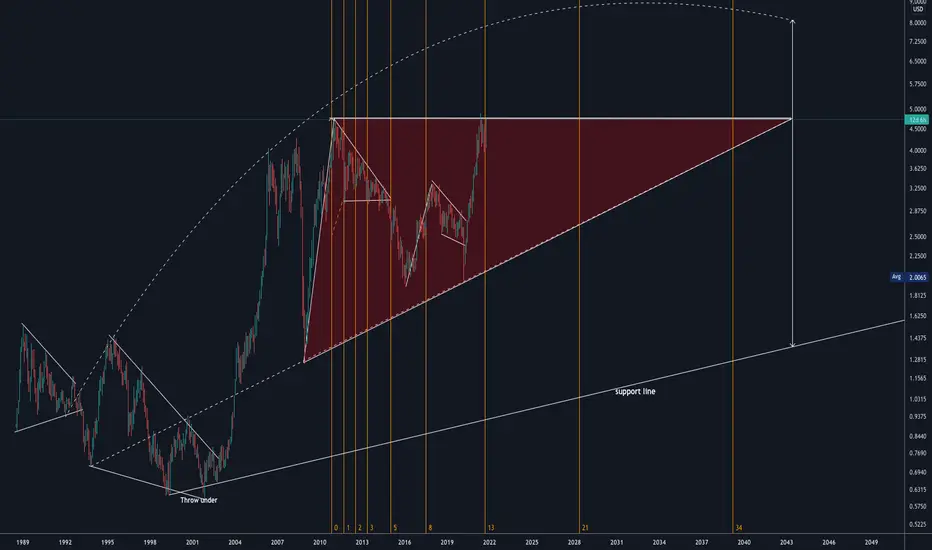
Copper bit of a bear marketHello, I see copper is in a bear market and a leg down could happen.
Not going to provide a full in depth analysis.
Here is a quick overview of this industrial commodity.
Here is the 30Y chart compared to gold you should notice a few things:
Copper could drop to 3.5-3.85.
3.85 is an extension of 1, 3.5 or 1.618.
Those extensions are really very common.
Gold bear market extended to 1.618 (for now):
Copper, assuming this is a bear market, is no stranger to 1.618:
The price extends 1 to 2 all the time.
Sometimes it does more than "correct" it makes a whole downtrend.
But it rarely does so (ever) without big retracements first.
The old saying goes "don't trade corrections".
Here this is something that repeats itself often so...
And in the short term there are nice enough trends.
I think trade corrections, but only if you are skilled.
Newbies that struggle in 3 year straight line trends...
Well of course they best stay away.
As long as you have strong hands but don't overstay either,
it should work out in the long run.
The inflation trade is sleeping. Ah lumber has dropped so much.
Too many people noticed it so they cut half the planet's trees.
It dropped so much. And it had gone up so much.
So much actually, that gamblers got caught up in lumber ponzis.
I don't see the US going hyperinflation or even 15% a year.
But people could buy commodities. In the short - medium term.
Better something that returns 0 rather than say a -8% return.
Disclaimer: I am long Soybeans and short Copper.
To look for in the following days (to my knowledge):
- China plans to release the state supply
- China plans to monitor (translation: manipulate) the market
- The US plans to "monitor" their economy (FED easing)
- China industry has shown signs of slowing down
Remember China buys half of the world Copper production (I think).
China had bad numbers in particular their industrial production dropped hard.
And As George Soros said, Housing Sector aïe aïe aïe.
Since they learned, to their surprise (somehow) they had a 1 child policy,
well there is no need for houses now is there? China doesn't take migrants either.
And the rural exodus has slowed down.
Economy contracts, demand goes down. Whole world contracts.
China and the EU follow Japan. The US follows the EU.
No reason for copper to go up. Supply is big an growing.
Demand has no reason to grow.
Only reason for the price to go up is inflation.
For now the USD goes up as silly as it seems.
Boomers worldwide all want to be safe.
Safe with the greatest ponzi scheme in history.

Copper Down Market down for chat pattern bear pattern on 15min candle chart
I think market goes down for 3 to 6 point
this is my only opinion and yours

New trading strategy upgrade - CopperHi traders, this is my personal trading idea only. Please give an AGREE/ LIKE, my trading strategy is Price Auction - using Chart only, your comments are highly welcome. My chaos drawing is not to predict and guess the further, it is my plan where we are on the chart and how we shall trade on what we see. Good luck guys.

✅COPPER BULLISH PENNAT|LONG🚀
✅COPPER has retested an important price level
And is now consolidating below it
In a bullish pennant pattern
I am bullish on the metal
As the transition to the "Green" economy
With EV's and Wind Turbines will require massive
Amounts of this commodity, so I am waiting for a breakout
And then will be expecting a bullish wave
With the first target being the recent high
But I am sure the price will go much higher still
LONG🚀
✅Like and subscribe to never miss a new idea!✅

Copperlooks like the divergent high has burnt off the excess energy and coiling, trying to move up in a weekly downtrend. Depends on the dollar and stimulus bill of multi trillion. Govt wants to install ev charging stations thruought usa. Lots of copper and electric cars so there is good reason for the push.

MCX Copper Shortmarket over heat .Right time to short your position
every market lose own control for bull ..this time is copper
This is My Opinion and your's ?
Copper Double zigzag within wave 4.
Wave X assumption here is a triangle.
Wave Y to head down as zigzag abc.
Invalidation of the triangle in wave X is wave e top.
GOODLUCK!

HG (COPPER) DAILY -- OUTLOOKThis metal has been in corrective mode for nearly five months and formed a triangle pattern. This triangle formation is up to reach its climax and an impulse journey is ahead to start. cheers...
DISCLAIMER: This publish is just an outlook and purely meant for educational purpose.
This is not a financial advisory since trading involves huge risk,
so trade with proper money management and expert advise..
