Copper On the fence two possibilities Long or shortI'm on the fence with Copper so you can choose I guess.
Current trend - Sideways.
2 possibilities.
1. Cup and Handle - target $4.24
2. Rising Wedge - Target $2.65.
Which way do you say Up or down?
QC1! trade ideas

Metals Copper idea (08/09/2022)Copper futures
The rise of the metal depends on the support point 3.1315, and we expect the correction to end in wave 2. We expect the start of the rise again, but this depends on trading remaining above the support point of 3.3620, and the rise may reach 3.7130 prices or extend to 3.8915, but this depends on the support point at 3.3620 prices.

Copper Futures (HG1!), H4 Potential for Bullish RiseType : Bullish rise
Resistance :3.5000
Pivot:3.4735
Support : 3.4170
Preferred Case: On the H4, with the price pullback from the support, breaking the descending trendline, MA10 is above MA30, combined with the fundamental news, we have a short term bullish bias that the price may rise from the pivot at 3.4735, where the current price is to the 1st resistance at 3.5000 where the previous swing high is.
Alternative scenario: Alternatively, price could drop to the support at 3.4170, where the swing lows are.
Fundamentals: Because of Chinese administration, the decline in copper production in Peru, and a steep fall in the DXY, copper shows a pull back trend from the support.

Copper Trading The CorrectionIn this update we review the recent price action in the Copper futures contract and identify the next high probability trading opportunity and price objectives to target

Metals Copper idea (05/09/2022)Copper futures
The rise of the metal depends on the 3.1315 support point to achieve the metal’s decline to end the correction in wave 2. before expecting the bullish rise again, and the decline may reach 3.3425 prices or it may extend to 3.2480 and may have already started to rise, but this depends on the support point at 3.3645 prices

Metals Copper idea (01/09/2022)Copper futures
The rise of the metal depends on the support point 3.1315 to achieve the bullish movement, and we expect the metal to decline to end the correction in wave 2 before completing the rise again, and the decline may reach 3.3450 prices or it may extend to 3.2510

COPPER FUTURES (HG1!), H4 Potential for Bearish DropType : Bearish Drop
Resistance :3.5785
Pivot: 3.4160
Support : 3.2760
Preferred Case: On the H4, with price breaking the trendline and moving below ichimoku indicator, we have a bearish bias that the price will drop to the pivot at 3.4160 where the swing low support, 78.6% fibonacci projection and 161.8% fibonacci extension are. Once there is downside confirmation that price has broken pivot structure, we would expect bearish momentum to carry price to 1st support at 3.2760 where the pullback support and 78.6% fibonacci retracement are.
Alternative scenario: Alternatively, price could rise to 1st resistance at 3.5785 where the pullback resistance is.
Fundamentals: No Major News

Metals Copper idea (29/08/2022)Copper futures
The rise of the metal depends on the support point 3.1315 to achieve the bullish movement, and we expect the metal to decline to end the correction in wave 2 before completing the rise again, and the decline may reach 3.3450 prices or it may extend to 3.2510

Copper Futureshead and shoulders pattern
Big Picture - Uptrend
Target Price - 4.0180
Entry Price: Around 3.5245
Stop Loss: 3.2945
Risk/Reward Ratio: 2.58

Copper on buy mode Copper may be bought on above 640 target may come as shown in chart ..Get out of all long position if goes below 598..
Happy Trading...
For next week from 25th July to 29tj July 2022
Idea expressed for analysis and tutorial only..

Copper OutlookFirstly, historical trends on Copper price are extremely important to understand. As we can see from the chart, Copper has been in an ascending channel with an 8% trend angle since 1988. In March 2020, a well-developed bullish triangle ended a decade of corrective action. Corrective waves of the same degree are more closely related to each other than impulses are and this can clearly be observed here. In addition, both primary corrective waves (2 & 4) lasted for nearly a similar period, the 2nd correction with a flat ABC structure lasted for 12 years (1989-2001) while the 4th correction (2006-2010) nearly lasted14 years.
There are five waves in a major movement that can be identified. Completion of the fourth implies that the fifth impulsive wave is now underway and this simply gives an early signal that Copper prices could be pointing towards amazing highs. The intermediate count is a lower degree illustrating a possible completion of the second correction in a lower degree and this is always an amazing sight to see since the next wave (3) of 5, may be equal to, or 1.618 times the length of (1) in 5, cannot be the shortest wave and is usually steeper than the first wave.
As a result of the anticipated thrust, we may see an overthrow from the main ascending channel over the next few years, driving prices to $7.80/lb or at least $6.69/lb (1.618 Fib retracement level). A confirmation level is highlighted in chart at $4.88/lb.
Disclaimer: The information provided here is only for educational purposes and should NOT be taken as investment advice.

Copper remains defiantFollowing up on earlier heads up on copper.
Battling here (hourly) with the 38.2% Fibo retracement but it also, possibly, seems to be building on an I-shs. Somewhat remarkable given the context of risk markets. Next hurdle is test of the 50% Fibo at 3.85 but the size of that I-shs suggests we may be in for a test of 4.25 (close to 75% retracement)

Sell setupThe narrative: There has been a lot of talk about inflation and a china reopening but coppers recent collapse indicates something more ominous may be brewing.
The model-
Sell: 3.6525 or higher
Stop: 3.7200
The Ingenuity Trading Model is a Geometric Hidden Markov Model with specific inputs related to Price, Time, Volume , and Volatility. The model attempts to predict local minimums and maximums (reversals) on a daily and weekly basis... stay curious

Recessions are rocket fuel!When US equities start breaking down vs inflation, recessions are where commodity bull runs are born.
#fintwit #recession #copper #spx #northstarbadcharts

Metals Copper idea (22/08/2022) Copper futures.
The rise of the metal depends on the 3.1315 support point to achieve the bullish movement, and we expect the metal to rise in the near term and also in the long term, it may rise from the current prices and the second wave has ended or the decline continues to the 61% level at prices of 3.3440 and the second wave ends there

GOOD signal to sellwe have a trend line and we have a break in 5 min time frame with volume i expect market will be go down

COOPER TO BUYGreat Opprtunity this week for COOPER
High probability to go long if we break 3.7130, next Target 4.000

You have a STRONG Order block i expect we will break this area . We are waiting for the break with volume and poolback to entry next week

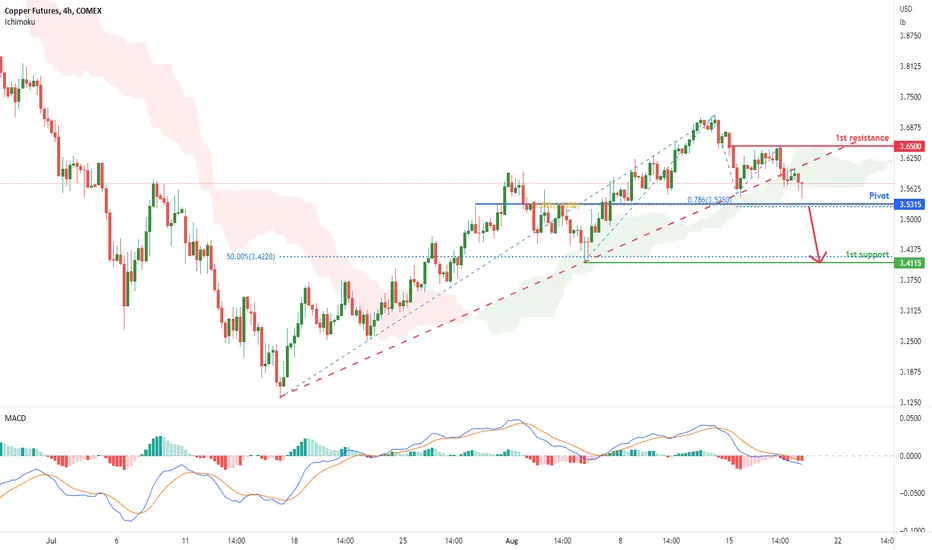
Copper Futures (M6E1!), H4 Potential for Bearish DropType : Bearish Drop
Resistance : 3.6500
Pivot: 3.5315
Support : 3.4115
Preferred Case: On the H4, with the price breaking the ascending trendline and ichimoku cloud , we have a bearish bias that the price may drop from the pivot at 3.5315, which is in line with the 78.6% fibonacci projection and 61.8% fibonacci retracement to the 1st support at 3.4115, where the 50% fibonacci retracement and swing low are.
Alternative scenario: Alternatively, the price could rise to the 1st resistance at 3.6500, where the pullback resistance is.
Fundamentals: The copper price fell as the market worries about demand in China surfaced due to weak economic data and a firmer dollar. Meanwhile, Chinese property developers sharply cut investment in July, while new construction starts suffered their biggest fall in nearly a decade.

Copper Futures (M6E1!), H4 Potential for Bearish DropType : Bearish Drop
Resistance : 3.6500
Pivot: 3.5315
Support : 3.4115
Preferred Case: On the H4, with the price breaking the ascending trendline and ichimoku cloud, we have a bearish bias that the price may drop from the pivot at 3.5315, which is in line with the 78.6% fibonacci projection and 61.8% fibonacci retracement to the 1st support at 3.4115, where the 50% fibonacci retracement and swing low are.
Alternative scenario: Alternatively, the price could rise to the 1st resistance at 3.6500, where the pullback resistance is.
Fundamentals: The copper price fell as the market worries about demand in China surfaced due to weak economic data and a firmer dollar. Meanwhile, Chinese property developers sharply cut investment in July, while new construction starts suffered their biggest fall in nearly a decade.

Copper Commodity USA Sun Storm Investment Trading Desk & NexGen Wealth Management Service Present's: SSITD & NexGen Portfolio of the Week Series
Focus: Worldwide
By Sun Storm Investment Research & NexGen Wealth Management Service
A Profit & Solutions Strategy & Research
Trading | Investment | Stocks | ETF | Mutual Funds | Crypto | Bonds | Options | Dividend | Futures |
USA | Canada | UK | Germany | France | Italy | Rest of Europe | Mexico | India
Disclaimer: Sun Storm Investment and NexGen are not registered financial advisors, so please do your own research before trading & investing anything. This is information is for only research purposes not for actual trading & investing decision.
#debadipb #profitsolutions

Copper Trading The Corrective SequenceIn this update we review the recent price action in Copper and identify the next high probability trading opportunities and price objectives tot target
