Monthly Silver New ATH IncomingCOMEX:SI1!
Silver new ATHs en route.
Get long and hold on for the ride.
Screenshots of bullish catalysts below.
Fat_Fat
QI1! trade ideas

DeGRAM | SILVER in upward channelSilver is in a bullish trend.
Price is coiling up before expansion by creating a consolidation zone following bullish momentum.
The market is moving sideways, and we expect a breakout of the resistance and then a further bullish move.
-------------------
Share your opinion in the comments and support the idea with like. Thanks for your support!

heythis strategy executes when it breaks the high of previous candle and takes short entry when it breaks the low of previous candle

Silver short (NEW)We have identified a rising wedge. We expect the price to hit the previous resistance but expect it to be reject and drop-down back to the previous support levels.
We also noticed the bearish cross-over on the MACD-line and bearish divergences.
Short on the 4h timeframe -
Entry price 24.54
Exit price 23.275
Stop loss at 24.8
Risk reward ratio: 4.87

Vedic trading indicatorAre you looking for an effective trading indicator that can work across multiple markets? Look no further than Najoomi ji's Vedic Ema cloud, Vedic deviation ballinger band, Vedic support resistance based on RSI, and Vedic psychological level indicators!
These indicators are based on a powerful combination of deviation bands, market volatility, and support/resistance levels, making them ideal for trading in Nifty, Bank Nifty, Forex, and other markets.
One of the key benefits of these indicators is their ability to help traders identify potential trading opportunities and make more informed decisions. By using the Vedic Ema cloud, for example, traders can track price trends and spot potential breakouts or reversals. Meanwhile, the Vedic deviation ballinger band helps traders gauge market volatility and identify potential price targets.
The Vedic support resistance based on RSI indicator, on the other hand, helps traders identify key support and resistance levels based on the Relative Strength Index (RSI). This can be particularly useful in markets that are prone to sudden price swings or reversals.
Finally, the Vedic psychological level indicator helps traders identify key psychological levels in the market, such as round numbers or price levels that are particularly significant to traders. By keeping an eye on these levels, traders can better anticipate potential price movements and adjust their trading strategies accordingly.
So if you're looking for a versatile trading indicator that can help you navigate multiple markets and identify potential opportunities, consider giving Najoomi ji's Vedic indicators a try!

SILVER MICRO WEEKLY CHARTThis is silver weekly chart which is indicating a bullish sign, as good closing is given on breakout of pole and flag pattern .
Plan your traders accordingly


Silver Futures March April Challange Hello my friends! How is going your trading week? I hope that is doing well, anyways lets talk about this operation!
Bulish: We are preparing for a trend continuation after the break of the resistance level that we are currently in, for entrys we gonna wait a strong candle, a pattern cadle or something like that.
Bearish: Here for the bearish operation we are waiting a retest in our candle, rejecting the resitance level and then going back to support, we gonna also pay attetion if the price after the retest in the resistance will not go directly to the next suport zone, but is gonna restest at a fib level.

Wave 3 is brewing!!As expected, the front end of the USD yield curve collapsing triggered a tipping point for silver to reverse higher, and now we are at the cusp of a higher move in precious metals. Enjoy the ride

SILVER1 BULLISH FALG PATTRENSILVER1 BULLISH FALG PATTREN.NO DIVERGEN SEEN.
The bullish flag pattern shows that the price will go up. And the chart will make new HH& HL.
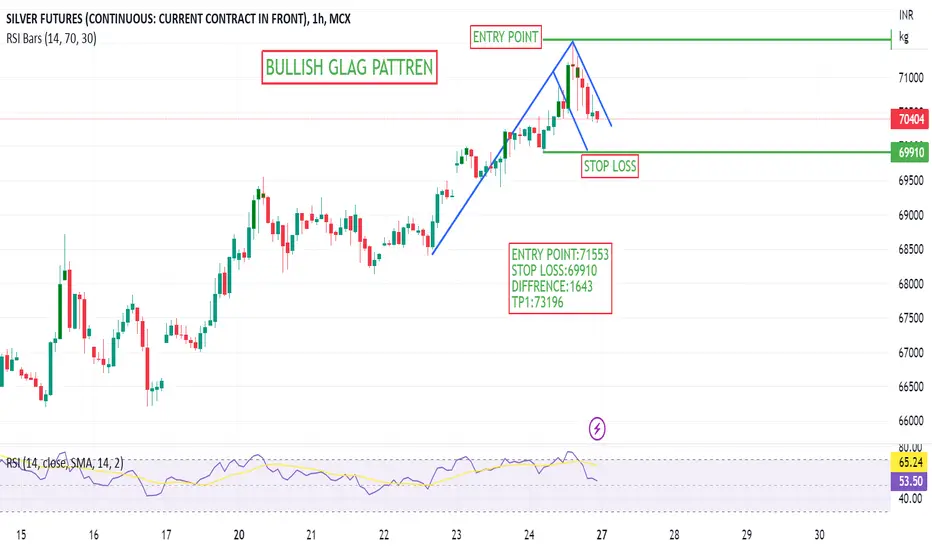
SILVERShort Trade may be initiated with SL of 71551 may be initiated. Some pull back can be expected here and 61% Fib retracement is also pending so if it works well target of 60k can be expected.

DeGRAM | Silver deceleration at resistanceSilver is decelerating while approaching the resistance level.
The market shows massive divergence on the 4H timeframe and pinbars.
We anticipate a short-term pullback and even further movement down if price breaks and closes below the ascending channel.
-------------------
Share your opinion in the comments and support the idea with like. Thanks for your support!


Silver Targeting A Test of Daily & H4 HVN'sIn this update we review the recent price action in the Silver futures contract and identify the next high probability trading opportunity and price objectives to target

DeGRAM | Silver pullback from resistanceSilver reached the resistance level at 23,00.
If the market makes a double top or pinbar the resistance at 23.00, we can look for selling opportunities.
We anticipate a short-term pullback from the resistance.
-------------------
Share your opinion in the comments and support the idea with like. Thanks for your support!

An elusive quest for a silver liningSilver is underperforming gold. The gold-to-silver ratio is over 1 standard deviation above the historic average since 1990. In fact, the gold-to-silver ratio has not been close to its historic average since August 2021.
Silver falling more than gold
Gold prices in February 2023 gave back almost all its gains (-5.2%) from January 2023 (+5.8%) as the US dollar resumed an appreciation path and bond yields rose sharply1. However, silver fared even worse in February (-11.7%), after falling in January as well (-0.9%)2. As gold is often seen as a hedge for economic and financial uncertainty, it is receiving greater support than silver.
Silver, as a precious metal with more industrial uses than gold, is weighed by the uncertainty in the global economy as developed central banks are tightening monetary policy at a pace we have not witnessed in decades.
Good news is bad news
Complicating matters, today good economic news is often interpreted as bad news because markets are pricing in a reaction from central bankers that could sap economic growth from the future. Take the last Global Manufacturing Purchasing Managers Output index reading for example. The February 2023 reading rose to above 50 (50.8) for the first time since July 20223. A reading of 50 and above should be interpreted as manufacturing in expansion. Other things being equal that report should have been positive for industrial sentiment and silver prices. However, because markets interpreted this as cue for central banks to raise rates further and delay monetary loosening, silver prices reacted negatively.
This could be a sticking point for silver this year: being flanked by falling gold prices when Dollar and bond yields rise, being hurt by expectations of a delayed pivot by central banks, but not sharing enough of the upside for gold when markets are looking for defensive hedges.
Mixed picture in physical markets
Macroeconomic considerations aside, some silver fundamentals look strong. Photovoltaic (solar panel) installations are expected to grow by more than 25% this year according to Metals Focus. In 2022, photovoltaic demand accounted for 11.5% of total silver demand (up from 5.6% in 2012)4. Meanwhile jewellery demand is likely to be sluggish as silver in Rupee terms remain elevated (India is a large silver jewellery market).
Most silver supplies come as a by-product of mining for other metals. MMG Ltd’s Las Bambas copper mine in Peru was put on maintenance in February 2023, following violent protests in the country. A short-lived truce allowed for production to resume, but Andean communities in Peru restarted blockades this week5. The mine produces an estimated 5.7 million ounces of silver as a by-product annually. Lower silver supplies could support prices.
Conclusions
Macroeconomic headwinds have set silver prices back this year and may continue to do so as markets price in tighter monetary policy for longer. Silver may have a hard time catching the same defensive bid gold enjoys. Despite strength in photovoltaic demand, jewellery demand may be soft. Tighter mine supply may be price supportive but overcoming the macro headwinds will be key to silver breaking out of its current lull.
Silver's Price Outlook: Targets for Uptrend and Downtrend ScenarThe resistance level at 67160 is a critical level for silver's trend, as it will determine whether the current uptrend will continue or a downtrend may be expected. If the price manages to break and sustain above the resistance level, it suggests a continuation of the uptrend, with potential upside targets at 68360 , 68760 , and even as high as 69300+ .
However, it's important to note that these targets are not guaranteed and depend on the price's ability to overcome the resistance level. On the other hand, if the price fails to break above the resistance, we may expect a potential downtrend. In this scenario, downside targets may include 65600 and 65060 below the critical resistance level.

DeGRAM | Silver a trend continuation opportunitySilver dropped from the resistance, and it created a descending channel.
Price action pulled back to resistance and fibo level.
If the market fails to break through the resistance level , we can sell from the confluence level.
We anticipate a trend continuation trade.
-------------------
Share your opinion in the comments and support the idea with like. Thanks for your support!

SILVERGenerally, gold and silver goes in tandem. Hence, gold is expected to go up so same may be correct for Silver. But here problem is that it has not yet broken the consolidation zone so there are chances of testing lower side of the line. As gold seems bullish what we can do here is that long can be taken with SL of recent low of the week i.e. around 61000. If that is broken no long trade should be kept.

SILVER FUTURES Stock Chart Fibonacci Analysis 0308231) Find a FIBO Slingshot
2) Check FIBO 61.80% level
3) Entry Point > 20.1/61.80%

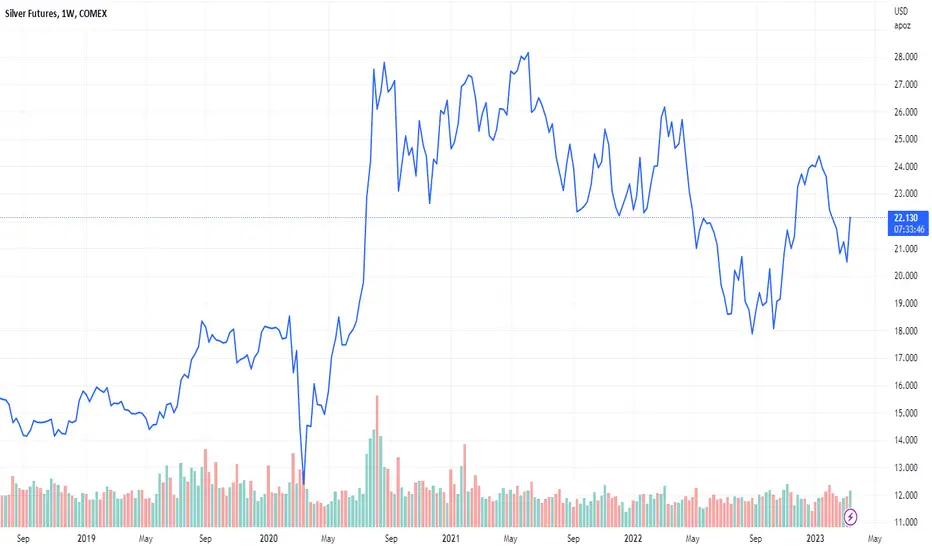
Silver Futures Monthly Log Chart"How to covert resistance <=> support"
For all those looking at sub $18 silver...
In march 2020, #silver had not yet converted the 18$ level from resistance to support.
Now that is a "wall" (previous resistance turned support).
That is a big difference.

Silver: Profit can be made by short selling in this area
Time is fair. Whether you are lazy or hardworking, time will gradually give you the answer that belongs to you. Those who cherish time will be cherished by time!
Currently, the pressure on silver is concentrated in the 21.5 area, where short selling can still be repeated. Silver has not followed the recent rise in gold prices, largely due to previous pressure. Currently, silver is more closely following the trend of commodities, similar to oil. After all, there will only be industrial demand in the later stages of economic recovery.
At present, it is still in a period of economic recession, so there is naturally no significant upward movement. However, after the stabilization of gold adjustments in the later stages, if they both rise simultaneously again, silver's rise will definitely be greater than gold's.
Furthermore, there is a possibility that the dark horse will continue to test historical highs in the future. Currently, short selling is still recommended at the 20-21 area with a stop loss at 22, and long positions can be tentatively initiated in batches near 19.5.
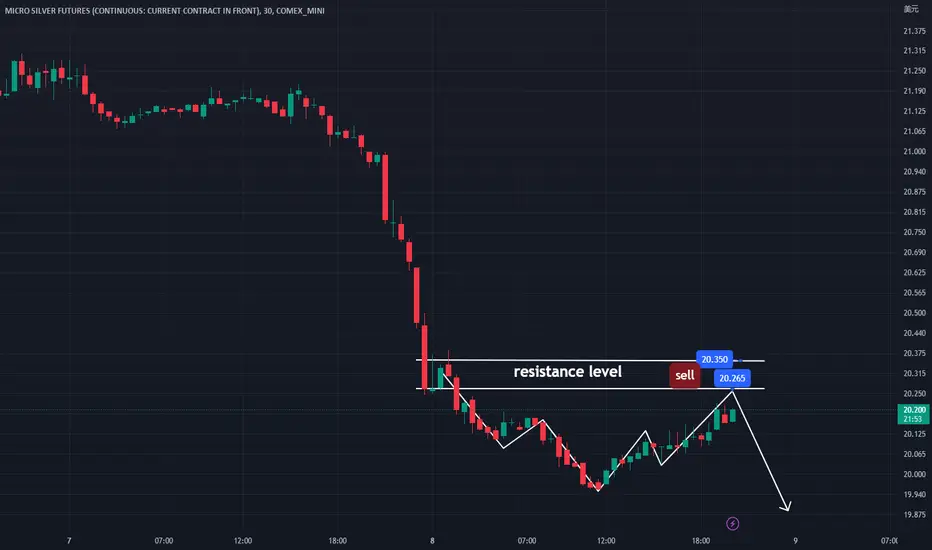
U.S. rate-hike expectations send silver back on the road
Everyone should have the mind of a valley and the tolerance of the sea. The reason why Jianghai can become the leader of all small rivers is because it is good at being in the downstream of all small rivers. That is the magnanimous person who is open to all rivers. Such a person can open the door to success.
Federal Reserve Chairman Bernanke's speech caused an uproar in the market, dragging down the price of silver, and the second drop came earlier than expected. In the short term, silver will continue to move downwards and continue to be bearish. Silver operation suggests selling at 20.23, risk control at 20.39, target 19.80~19.45~19.20.
Silver is bearish for several reasons:
1. Silver's bullish rebound was prematurely affected by the data yesterday, and the bottoming trend is still continuing.
2. According to my personal analysis, the decline of wave 2 has not been completed, and the market will continue to bottom out.
3. The intraday pressure is 20.23~20.41, supported at 19.45~19.20.
Traders, if you like this idea or have your own opinion about it, please write in the comments. I will be happy 👩💻
