Compound | Wishful Thinking? Simple Signals & 740% PotentialHere is another chart that is not ready, I mean, based on the signals.
If we go by our conventional approach, it is way too early, the signals are not strong enough. But knowing that they are there, the fact that we can see them, means that the potential for a reversal is already in the making.
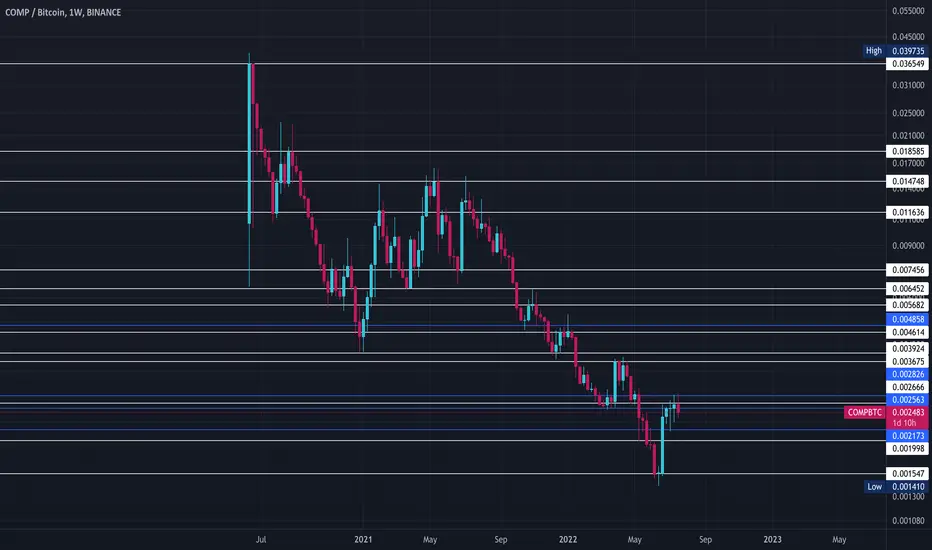
Bearish volume has been declining since February 2021 for COMPBTC.
The main signal supporting the end of the bearish trend, would be the fact that the lowest point this pair hit in early August, also produced the smallest bear volume.
The weekly RSI bottomed in June 2023 and the MACD in November 2021, so we have a very strong double-bullish divergence, double referring to the fact that it is happening with two oscillators.
These divergences are really strong, one is more than a year long and the other almost three years old. Divergences anticipate trend reversals.
Couple these signals with marketwide action and the market cycle, and we have a case for the bullish side.
Compound is ready to grow against BTC.
Namaste.
COMPBTC trade ideas

COMP | A Buyers Market: The Accumulation PhaseWe are now in the accumulation phase; a great opportunity for the avid cryptocurrency trader.
In this chart we have a long-term lower low.
This lower low is a bullish development based on the volume.
The first "low," on the left side of the chart, is really high volume.
The lower low on the right side of the chart has no volume.
The first low is short in duration while the second low is long in duration; compared to the first one. This fits Elliotts law of alternation.
We know what follows... There is more.
I am doing a close-up on the daily so you can see this candle...
➖ This is a reversal signal.
➖ 13-April comes the main low (far left).
➖ 18-June comes the double bottom.
➖ 28-June we have high volume buying.
➖ Today's candle (5-July) has above-average volume buying, a long lower wick and ends up green. So bears sold but bulls bought everything up.
These are indications that this market is starting to turn.
There can be another drop, a shakeout, etc. If this happens, this can be used as an opportunity to accumulate. If it takes time to turn bullish, focus on the long-term.
Accumulation for the next few months.
Buy and hold long-term.
Easy win.
This is a buyers market.
Namaste.

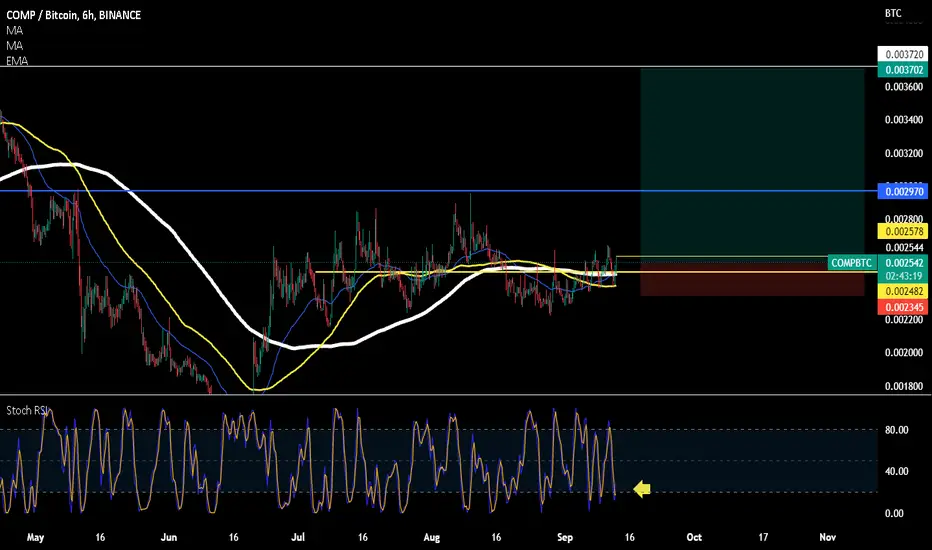
Smart Trading Moves: Navigating COMPBTC Potential RallyIn August, COMPBTC exhibited a precise bounce off the 78.6% Fibonacci support level, marking a significant turning point. Subsequently, the price has primarily traded within a range, all while staying below the downtrend trendline. However, a noteworthy development is the emerging pattern of higher highs and higher lows, hinting at potential preparations for an upward rally.
With the ongoing respect of the Fibonacci support, the scenario suggests a potential price surge towards the crucial supply zone, aligned with the 78.6% Fibonacci resistance level. We've established our trade setup, which boasts a favorable risk-to-reward ratio. As we closely monitor price action, we'll keep you updated on any noteworthy changes.

✳️ No Bullish Signals | Compound vs BitcoinSome charts have great signals, very strong signals.
Some charts have such strong bullish signals that when you see them you become anxious and you want to sell your house to buy the pair... FOMO kicks in.
Some charts have no bullish signals yet, I am still bullish...
✔️ Compound vs Bitcoin (COMPBTC) is trading below EMA10 (bearish).
✔️ The MACD broke below zero (bearish).
✔️ The RSI is below 50 (bearish).
✔️ Trading volume is super low (bearish).
✔️ But I am super bullish on this pair.
Sometimes we ignore the charts and go with experience.
You see (or hear, feel, sense... depending on your type), you can have very strong charts, very strong signals and things suddenly change for the worst.
You can literally see something really great developing, feel 1,000% certain and still the market turns... It also works the other way.
You can see a pair that is completely bearish and out of nowhere, suddenly, things can change.
This doesn't mean that I have to be right in this specific instance, I am just sharing how things work.
Compound can have some bearish signals, most of them, but if you can look between the "lines", I should say between the "candles", the classic signals are not all.
My money is on Compound going up.
What about yours?
Namaste.


COMP / BTC (bottom here)hello dear trader
What Is Compound (COMP)?
Compound is a DeFi lending protocol that allows users to earn interest on their cryptocurrencies by depositing them into one of several pools supported by the platform.
To learn more about this project, check out our deep dive of Compound.
When a user deposits tokens to a Compound pool, they receive cTokens in return. These cTokens represent the individual’s stake in the pool and can be used to redeem the underlying cryptocurrency initially deposited into the pool at any time. For example, by depositing ETH into a pool, you will receive cETH in return. Over time, the exchange rate of these cTokens to the underlying asset increases, which means you can redeem them for more of the underlying asset than you initially put in — this is how the interest is distributed.
On the flip side, borrowers can take a secured loan from any Compound pool by depositing collateral. The maximum loan-to-value (LTV) ratio varies based on the collateral asset, but currently ranges from 50 to 75%. The interest rate paid varies by borrowed asset and borrowers can face automatic liquidation if their collateral falls below a specific maintenance threshold.
Since the launch of the Compound mainnet in September 2018, the platform has skyrocketed in popularity, and recently passed more than $800 million in total locked value.

Compound (COMP) formed bullish Gartley for upto 14.50% pumpHi dear friends, hope you are well and welcome to the new trade setup of Compound (COMP) token with US Dollar pair.
In previous trade setup, the priceline of COMP moved slightly down than potential reversal zone but recovered soon and then pumped well:
Now on a 4-hr time frame, COMP has formed a bullish Gartley move for another pump soon.
Note: Above idea is for educational purpose only. It is advised to diversify and strictly follow the stop loss, and don't get stuck with trade

#COMP/BTC [Compound]: T.Line_Breakout_+_ConfirmationWe've detected a Trendline Breakout and Confirmation on the $COMP/$BTC chart. The price has broken above a key resistance level and has been confirmed by a strong bullish candle, indicating a potential bullish trend. We may consider buying at the current price zone and targetting higher level.

COMPBTC - A Chance of a Quick 10% ShortWe've had some massive gains with COMP over the last few years, plenty of 30%, 40% and even larger trades, a bit of confusion recently during a slightly more choppy period but profit's profit!
Crypto Tipster v2 is currently showing a Short signal and we could expect to see the price at least reach the nearest level of support at a few percent down, maybe reaching the incoming upward trend line which would take the price to around 10% below where it's currently sat.
If you enjoyed or agree with this idea - drop us a comment, like & follow! :)

✳️ Compound Descending Channel Followed by Bullish Wave (120%+)This little pattern here reveals what is coming to Compound.
#1 | Descending channel leads to rounded bottom followed by...
#2 | A bullish wave.
Now we have a strong higher low, a bullish RSI and market conditions improving.
#1 | The descending channel is present and lead to a failed consolidation that ended in a rounded bottom. This rounded bottom can be followed by...
#2 | A bullish wave.
40/50% potential on the first jump.
A total of 120% for the entire wave mapped on this chart.
Thank you for reading.
Namaste.

COMP / BTC Wyckoff Accumulation Pattern IdeaNot a financial advice but Comp may be in a accumulation, and reversal occur as pattern gives.

Compound (COMP) - OversoldOn the above 3-day chart price action has corrected over 80% since last May. A number of reasons now exist to be long, including:
1) A buy signal has printed.
2) Price action and RSI resistance have broken out.
3) Price action is now testing the golden ratio following breakout.
4) Stochastic RSI crosses up 20 on 2-week chart (below). Do not ignore! This version of the Stochastic RSI function I’ve specifically coded to indicate the green shaded area during extreme oversold conditions. It does not always trigger.
Is it possible for price action to fall further? For sure.
Is it probable? Very unlikely.
Good luck!
Ww
Type: Trade
Risk: <=6% of portfolio
Timeframe: 1-3 months
Return: 500% minimum
2-week chart

Major Pump Coming for $COMP due to Golden Cross? 100MA & 200MA Looks like the 100 MA on the daily chart is curling sharply upward, about to cross the 200 MA. The price is still below the 200MA on the USDT chart but I would expect the price would begin to pump there once this chart took off as well. They seem to basically be moving in tandem.

$COMP $COMPBTC #COMPBTC #COMPUSDT Bull Flag in Progress Here?I'm eyeing both the BTC & USDT pairing of COMP (Compound), which, although a little different, seem to be telling a similar story. COMPBTC in particular has my attention because the price has finally made it's way over the 200 MA on the day chart, which is huge. All the MA's are curling up nicely under the price, and it's making me think we've got just a few more days of consolidation (within a bull flag) before making a move up, possibly coming back and touching it, and then moving up higher.
I think the USDT pairing will likely take off when the BTC pairing does, and probably spend the next few days consolidating as well, as the 100 day MA is crossing nicely upward with some other smaller time frame MA's on that chart.
My target is appx 240, which represent some major price levels that can be seen on the month charts.


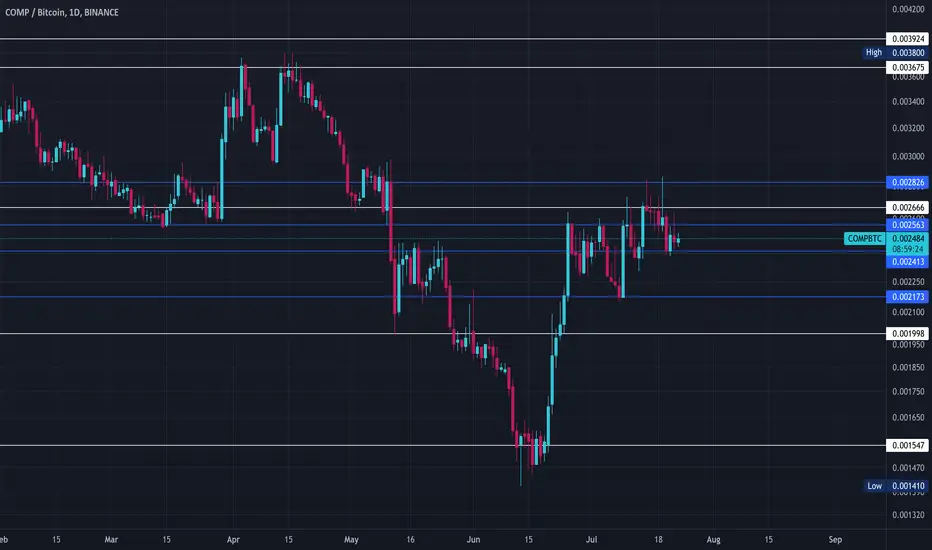
COMPBTCin daily time fram the situation is different you can take a risk a little more to reach 2666 sats but it not worth it
Compound vs Bitcoin Long-Term (Bullish Confirmed)The bullish bias has now been confirmed for Compound.
We are looking at COMPBTC but also COMPUSDT has gone bullish.
Notice the candle marked 13-June.
The Doji with -8 TD Sequential count marks the low.
The full green candle that follows confirms the low.
The current candle with a long wick below EMA10 (0.002376) just to recover and close the week above this level confirms the bullish bias.
With these signals in, the low, bounce and test of short-term support, we can expect prices to start moving up.
A change of trend = Long-term growth.
Long-term growth = Higher highs and higher lows.
Namaste.

$complooks promising , H4 MACD cross , painting a flag
sl below 200 on H1
assuming everything is gonna pump this is a good bet
nicked it off of simon hayes

Compound vs Bitcoin | Triple ReversalGood Sunday my fellow cryptocurrency trader, we will focus on 3 signals only for Compound vs Bitcoin (COMPBTC) today.
Feel free to support our work in whatever way you see fit!
Let's get started!
COMPBTC 3X Bullish Chart Signals
(1) Full Green Candle (Break above EMA10)
Today's candle is full green on rising volume.
This candle is also breaking a downtrend;
Breaking above EMA10 after a Doji...
(2) Doji Candlestick
-8 Doji at a new low closing green predicts this weeks candles.
(3) RSI Bullish divergence
A very strong divergence on the RSI with more than a year in place.
Compound looks good vs Bitcoin.
Namaste.

Compound Bullish BreakoutCompound is now starting to move vs Bitcoin.
We can see a strong recovery yesterday which pushed prices above EMA50 and EMA10.
We are seeing grow now...
We have potential for higher.
EMA50 is the support/stop.
Namaste.

Compound High Potential For Growth, Strong Bullish Signals 700%+Compound (COMPBTC) is looking really good, we will focus on the main/classic signals once more.
The classic falling wedge, beautiful.
The TD Sequential went through a perfect -9 and is starting to turn.
We have bullish divergence with the MACD and RSI (this is the weekly timeframe).
We have a bullish cross also on both indicators mentioned above.
The compound developers team are also changing the projects structure to reduce its rewards by 50%, which is also stimulating its prices growth.
The above signals are all bullish, we are looking at over 250% potential and up to 725% for the full bullish jump.
Namaste.
