COMP/BTC at SupportCOMP/BTC at Support with Divergences
Not according to my usual strategy, as I normally just trade trends. But COMP is at 100 (psychological price level) with Bull divergences on COMP/BTC and COMP/USDT
I'm buying with Stop/Loss around 97
COMPBTC trade ideas

Compound (COMP) vs BTCOn the above 1-day chart price action has corrected 40% since early July. A number of reasons now exist to be bullish, they include:
1) Price action resistance sees breakout after 63 days (pink line).
2) A ‘incredible buy’ signal was recently printed.
3) Price action made an impulsive move to the upper side of the Bollinger Band (not shown here).
4) Multiple oscillators are diverging with price action (purple circles).
5) The weekly chart (below) is printing an ascending triangle. It has yet to breakout, however I would have no issues going long based on the daily chart alone.
Is it possible price action falls? Sure.
Is it probable? Very unlikely.
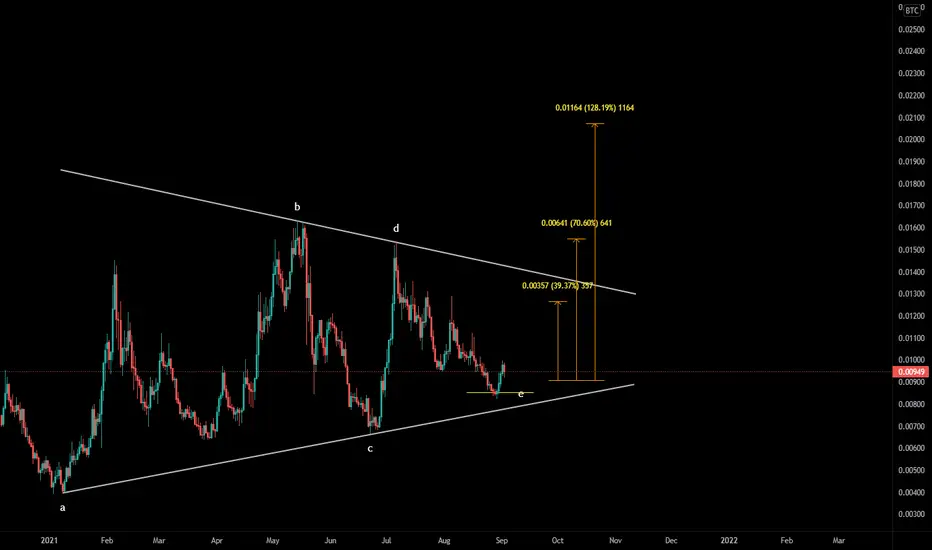
1st target is 14k sats
2nd target? That happens after the weekly chart breakout. I’ve no idea.
Good luck!
WW
Weekly chart

COMP/BTC COMP is getting strong horizontal support on daily chart. Could be nice entry for swing trade position.
Falling wedge is not validated yet.

COMP BTC pair new idea COMP BTC pair new idea potential after 40 days it must be 150 % as on history lets see this time how growth it ll my opinion it ll be go 850-900 in btc pair

Great on the BTC pair.Bottoms. Nice long MA downward slopes recently, just what you want to see. Cant really argue on this one from a TA perspective for a buy. With BTC on a downward short term, could get worse, but its not a turd project and one of those that might rally like it did before, or at least a more optimistic gain from here. Like the 20 MA, just upturning and price challenging the area. Usually a good at least short term price action reversal. Not a lot to dislike here when you see the pink bottom and possible inverse H&S that didnt play out last time, but right idea and good sell area on the last missed trade. Might just fly from here as well like before. Making higher lows, higher highs last week or so and still 10% gain if it headbutts the 50MA, double the BTC if it hits the 200MA.
Oacillators also look good for some continuing upward action.


COMPBTC time to break the resistance?It seems COMPBTC has bottomed (finally) and is ready to break the line of resistance.. Wait for the breakout there's a huge potential to the upside


$COMP, Something to watch$COMP
Something to watch as its trying to break from a long descending trendline
#COMP

Alts pump stated - Ex CompHello,
Here is what I have identified, based on one of my own custom indicator.
My indicator called DCA Daily Buy (but also working on 12, 4h, 1h, with adujsted settings), supposed to help me identify bottoms on big coins : BTC, ETH, LINK, LUNA, COMP, SNX, and some others, vs USDT.
I have found by mistake that vs BTC, my indicator was already flashing sigals to buy.
And when I compare for example compusdt and compbtc, I see that when compbtc start to move up, compusdt also moving up, soo I have set some buy order... :)
compbtc :
compusdt :
CompBTC Compared to CompUSDT :

COMP TrendlineAnother good altcoin to watch. COMP trying to break trendline and we can expect another run.

COMPUSD - COMPBTC - Falling wedgeKeep an eye on Comp in the next days.
On the COMPBTC chart, Comp hasnt yet broken out. The red box serves as support.

Buy COMP/BTC, descending wedge formation COMP/BTC descending wedge formation, when it breakouts in rsi its gonna explode
Buy COMP/BTC, descending wedge formation

compbtcstoploss
0.00810
target
..................
0.01170
..................................................................after this target we updat
very good


Compound COMPBTC - Bullish rectangle + Descending channel- Compound - COMP Rank #57 on coinmarketcap.
- On the chart we can spot a huge bullish rectangle, which will break up very soon!
- Also we can see a descending channel, which is also ready to break up!
- Profit target is below ALL TIME HIGH
- For expected duration of the trade, probability, stop loss, profit target, entry price and risk to reward ratio ( RRR ) - please check my signature below ↓
- If you want to see more of these ideas, hit "Like" & "Follow"!
- See my related idea about COMPUSDT below in the related section.


COMP thoughtsYOUR LIKE OR COMMENT IS MY FUEL FOR NEXT ANALYSIS :) IF U HAVE ANY QUESTION REACH ME HERE
This is not a financial advice. Always do your own research and always put stoploss in your trade (SL) :) If you want more detailed info how to study and read charts or just need help with some coin, just write to me here a comment, i will try to answer to everybody... i can help you :) all for free, don't worry, BE HAPPY!

COMPBTC Buy SignalThe price has reached the bottom of the channel. We will be looking for the reversal here and teste the top of the channel. The best strategy is to start with small position and add more as the reversal is confrimed

#COMPBTC [ COMPOUND ] imminent Breakout#COMPBTC
I see several bullish patterns on its charts (1D, 4H):
- Failure Swing
- Bollinger Breakout
- Super Trend
- T/W Breakout

COMP Really loves this formationI recently made a post on COMPS affection for the inverse H&S
This current one, a bitcoin pair is showing the same signs however with a slight difference on the positioning of the head
Hopefully a bounce back into the channel and further upsides to come
I am long COMP

COMP BULLISHComp is one of the altcoins that have been left behind the BTC pump.
Take entry for ~%30 profit. (Current price $502.46)
