COMP Compound the Swings Up to 53-61 then down to 18-22? Watch!!Not financial advice.
Please like comment and follow
Simple pattern recognition
Play the swings
Up to 53-61.75 then down to 18.00-22.00?
If history repeats itself this would be the play.....
COMPUSD trade ideas

COMPUSD (1H) - Bullish reversalHi Traders
COMPUSD (1H Timeframe)
Waiting for the upward break of 40.95 resistance level, which will complete a bullish trend reversal pattern to go LONG. Only the downward break of 38.99 would cancel the bullish scenario.
Trade details
Entry: 40.95
Stop loss: 38.99
Take profit 1: 42.17
Take profit 2: 44.16
Score: 5
Strategy: Bullish reversal

COMPUSD (1H) - Bearish breakoutHi Traders
COMPUSD (1H Timeframe)
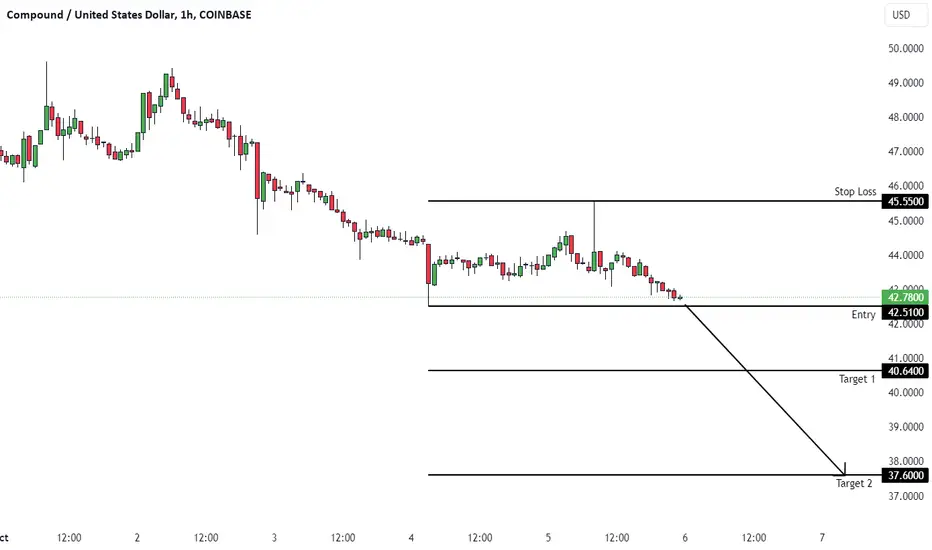
The market is in a downtrend, and we are waiting for an entry signal to go SHORT below the 42.510 support level. Only the upward break of 45.550 would cancel the bearish scenario.
Trade details
Entry: 42.510
Stop loss: 45.550
Take profit 1: 40.640
Take profit 2: 37.600
Score: 6
Strategy: Bearish breakout
Long Comp to $58Got stopped out of my last position in COMP due to a trailing stop. Not mad tho. Ended up with 21% profit in the pockets. I hate to be out of this trade esp. since the MM's have been moving everything up during off hours. This bull flag here looks primed and prepped. Additionally, we have a hammer candle on the daily. Entry was 43.73. I'll target 58. SL will be 39 but trail upon profit as always.
Not fin advice.
Best,
Stew

flagsThis could be a bull flag and we could see a retrace up to around $64 before a retrace. Keep an eye out and well see how this thing plays out. Long term hold overall on COMP/USD.
This coin has a lot of potential to go a lot higher than $100 from its low point which we were at this past week with the rest of the market.
good scalp profit at $64 but over the long term this will be a highly profitable coin. Keep it on your radars.

COMPUSD Huge bullish divergence can take it to 130.COMPUSD is consolidating under the MA50 (1w) since mid August with the RSI neutral/ borderline bearish.
There is a Rising Support on the RSI (1w), which is filled before every rally.
The Support Zone has priced all 3 of those RSI bottoms.
Trading Plan:
1. Buy the next pull back on the Support Zone.
Targets:
1. 130.000 (Rising Resistance as well as slightly under Fibonacci 0.5).
Tips:
1. The RSI's (1w) Rising Support is a huge Bullish Divergence. Those are typically formed during long term market bottoms and usually an aggressive break out follows. The next rally can be even stronger than we expect.
2. The MA100 (1w) is the last Resistance standing and its crossing can potentially accelerate the rally we just talked about.
Please like, follow and comment!!

[C-006] CompoundTrading idea number C-006 | Compound could raise to 43/45 USD area.
The RSI is below 50. The MACD is above its signal line and is negative, price is below its 20- and 50-period moving averages. In addition, the pair is trading below its lower Bollinger band. All this shows a state of strong oversoldness following yesterday's price collapse that brought prices back to the support line of the lateralization channel from which we expect a rebound. To support our bullish thesis we also see a first bullish divergence
📈 Long Entry at 40.74
💰 Take Profit at 43.00
💸 Stop Loss at 39.85

COMP Trade UpdateTraders,
Just realized I wasn't able to post the very fortunate trade entry that was made by me during our most recent flash crash a few days ago. I missed this post due to being briefly banned by TradingView for inadvertently violating House Rules.
Long story short, I happened to be sitting at my computer that evening and was perusing the charts per the usual manner. I noticed that COMPUSD had reached its target down from the recent Head and Shoulders pattern seen. But because the selling pressure was so heavy I decided to set my buy order even lower per chance I might get the order triggered and filled. Therefore, I looked for the next best level down and found that level at 35.55. This is where I set my buy order. Lo and behold it was filled! In fact, my chart which gathers data from the Coinbase exchange here, shows the candle wick bottomed only a few cents lower at 35.43! This, traders, is why charting levels, trends, and patterns can be very helpful.
Technical analysis is not always right. In fact, we have to count on a good percentage of our analysis being wrong. Such was the case in quite a few of my last entries which were stopped out during this flash crash. But TA gives us much better insight into what the probability of the trade becoming profitable might be. Pair TA with some fundamental analysis and you are well on your way to becoming a seasoned trader.
Back to this chart. You can see that we remain in the H&S Target box. From a technical perspective, this remains a good re-entry area.
Here are the positives:
RSI back above support
RSI still near oversold
Price in H&S Target Box
Price above good support (red area)
Here are the negatives, including fundamental considerations:
China FUD re: Evergrand bankruptcy
Elon FUD selling BTC
Macro-economic uncertainty = risk-off
Fed Powell Speech Friday
And one TA negative is that current candle is a shooting star
As you can see, technically the trade remains in your favor. But there is a lot of FUD out there. Be cautious. Never risk more than you can afford to lose.
Best,
Stew

COMPUSD (4H) - earish Wave We2Hi Traders
COMPUSD (4H Timeframe)
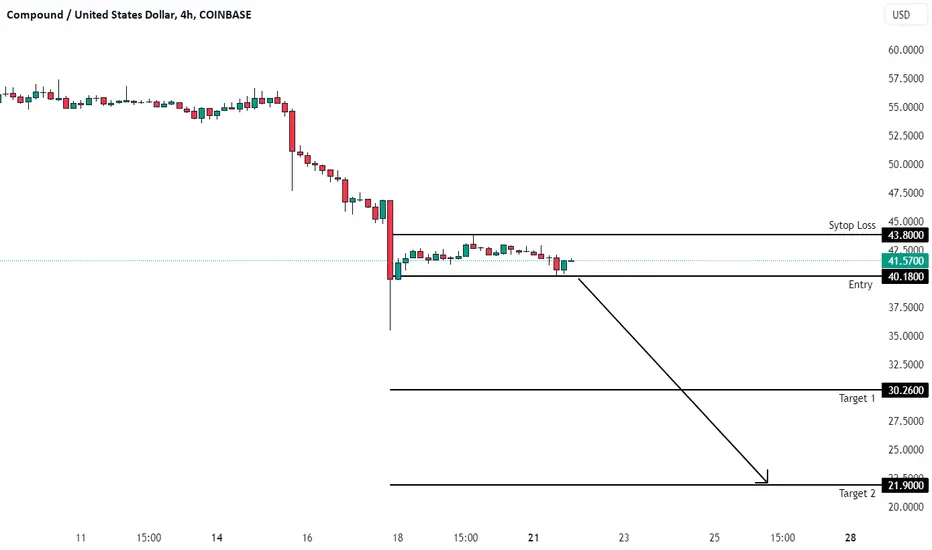
A high probability, entry signal to go SHORT will be given with the downward break of 40.18 after the market found resistance at 43.80. Only the upward break of 43.80 would cancel the bearish scenario.
Trade details
Entry: 40.18
Stop loss: 43.80
Take profit 1: 30.26
Take profit 2: 21.90
Score: 9
Strategy: Bearish Wave We2
.618We’re at the .618 area of retrace,ent which typically has some support but I believe we could se a further drop to $43 or even $38…. $28 is the last resort….Plan to see some movement in these areas, and hold for the long term gain. Once we break back over $78 we could see it follow the strong bull market.
There is a possibility of getting a scalp trade from $61-$63 off this level, but let’s not try to catch a falling knife. Only when we see some more stable support and volume would it be a good idea to scalp.
Good luck and have fun with it

COMPUSDStron divergence at the level of 100 % FIB EXTNS. and between 50% and 1%.I am waiting short term bounce from this level.I am long

✴️ Compound Update | Looks Promising, $88 Target Next?Compound ended June on a positive note and continued growing all the way through the 4th July, then came the correction.
6 days closing red but a bounce is happening exactly at EMA300 (grey line on the chart).
The question is this, can COMPUSD resume growing or will the correction continue?
Compound moved ahead of the others, as it moved ahead the others started to follow, slowly but surely.
If the correction ends for this pair, it is likely that it will also end for the other pairs. Let's see what the chart has to say.
EMA300 is a very strong level so is normal to see a retest before additional growth can happen.
With the strong candle we have today, it is likely that this is a real move. By real I mean that there will be a follow up.
The volume is really high and this session already cancelled 4 days of red, with the total red days being 6.
I am leaning bullish based on the chart signals and we can expect additional growth but, if prices move and close daily below EMA30 or $52, the bullish signals become invalid and we would need to see more red before up.
Even with more red, the bigger picture would still be a higher high in the weeks to come.
It is looking pretty good overall.
Namaste.

COMPUSD: 1W candle turning green pointing to a rally continuatioCOMPUSD has been a very profitable crypto for us lately (last idea at the bottom) and as it crossed above the 1 year Channel Down invalidating it, the 1W timeframe turned bullish (RSI = 65.140, MACD = 5.050, ADX = 32.042).
If the 1W candle closes green on this bullish pinbar, we will buy again and target the 1W MA100 (TP = 100). The upside potential is significant as the recent Bullish Cross on the 1W MACD was formed under the 0 level.
Prior idea:
## If you like our free content follow our profile to get more daily ideas. ##
## Comments and likes are greatly appreciated. ##

✴️ Compound Renko Confirms Bottom, New Multi-Year Long Uptrend In this Renko chart for the COMPUSD (Compound) pair we have a mixture of signals and systems.
We are using it to spot a bottom and also confirm the reversal of a trend.
The fact that we have a perfect flat correction (3-3-5) based on EW coupled with the highest volume ever, 4 green bricks on the weekly timeframe, all confirm that the bearish trend is over.
This thing can literally change and reverse but as it is now we have a newly developing uptrend.
Compound is entering a new bullish trend that can last for years.
The next All-Time High can go beyond $1,600 or even up to $2,000. This is my projection for late 2024 or early 2025.
Thanks again for reading.
Namaste.

COMPUSD Ranged trading and buy if this level breaks.Compound (COMPUSD) is rebounding after the initial rejection on the 71.500 Resistance that goes all the way back to the August 10 2022 High. As long as it holds, we will trade within that and a Higher Lows trend-line. The 1D RSI pattern is identical to the January 15 - 30 peak formation, which also traded in range before the 1D MA50 (blue trend-line) broke and completed a nearly -40% decline.
As a result, if the 1D MA50 breaks again, we will calculate a rough -40% decline from the last High, most likely that will be around 45.000.
A 1D candle close above the Resistance though, will be a bullish break-out for us and we will target a potential 1W MA100 (red trend-line) test at 100.000.
-------------------------------------------------------------------------------
** Please LIKE 👍, FOLLOW ✅, SHARE 🙌 and COMMENT ✍ if you enjoy this idea! Also share your ideas and charts in the comments section below! **
-------------------------------------------------------------------------------
💸💸💸💸💸💸
👇 👇 👇 👇 👇 👇

Double top.Assuming it’s a double top, if we don’t see a strong breakout with high volume above $71
We can expect a drop to at least $45
A bounce and possibly lower to around $35 but $42-$45 is a good entry point for a scalp
Keeping in mind Comp All time high was $915, we see strong rejection around $71 but is a drop in the bucket compared to what it could be in the next bull run.
With a 52% increase within the week and a 80% increase within the month
Anything above $71 could trigger another push
However on the daily we are currently overbought.
Good luck and have fun with it!

COMP hitting resistanceCOMP is hitting resistance. I dont think it will go higher. I took profit here.

COMPUSD: Closed over the 1D MA200 flashing a strong buy signalCOMPUSD closed the 1D candle yesterday over the 1D MA200 for the first time since April 18th, giving a strong buy signal despite turning overbought on the 1D time frame (RSI = 73.112, MACD = 1.660, ADX = 54.712).
We are taking a buy here, targeting the 0.786 Fibonacci level (TP = 55.000).
## If you like our free content follow our profile to get more daily ideas. ##
## Comments and likes are greatly appreciated. ##

Comp rev'n up or just a burnout? this is looking appealing, recently challenging a DownTrend dating back to May `21 🥸

COMPUSDMy bias for COMPUSD still remains bearish as the previous low is already broken. I was taken out from my first initial trade due to a tight stop loss. A re-entry is taken with my target still my previous target.

COMPUSDI am expecting a drop down to 33.94. Retracement seems to be holding up nicely. A move above my stop-loss will make my bias invalid. I have opened a sell trade already. Let see how it plays out.

Nice risk/reward ratio for COMPCOMP is currently chilling at daily support level and right at the bottom side of the huge triangle, showing RSI divergence on 4h and 1d time frames. Giving possible upside move with more than 50% and small risk with stops below support & trend line could be a nice play.

COMPUSDCOMPUSD is in a mini downtrend, there is a retracement and resistance seems to be holding nicely. I am expecting a further downward movement.
