COMPUSDT trade ideas

Comp analysis (4H)Hi, dear traders. how are you ? Today we have a viewpoint to BUY/LONG the COMP symbol.
comp can go up to targets by breaking the TL line. If it reaches the green box once again, it is suitable for oscillation.
For risk management, please don't forget stop loss and capital management
When we reach the first target, save some profit and then change the stop to entry
Comment if you have any questions
Thank You

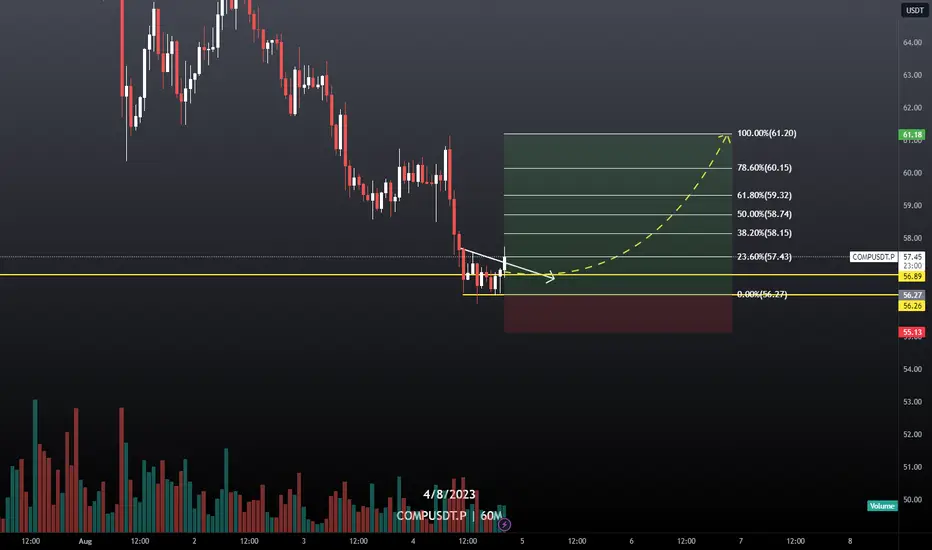
COMP USDT PERP Hello Trader BINANCE:COMPUSDT.P
comp usdt. retail block order area
long position at 56.89 to 56.27
can be limit buy in the area
area because usually bounce back support area
Please add a comment and Positive feedback and
constructive criticism are important to authors and the
community.
Disclamer: Not Financial Advice
COMP/USDT Swing setupSmaller allocation as the entire market is a bit strong on the bearish side. Buying range and TPs mentioned.

✴️ Compound Likely To Recover (Resume Growing)The daily chart looks crappy and it is hard to predict when a correction will end but the 4H chart is starting to show some early recovery signals.
Compounds (COMPUSDT)
We have 5 signals that are pointing towards and up-move.
Remember, if this one moves everything else does the same and many are already breaking bullish.
1) Higher lows. This can be seen easily on the chart so it needs no explanation.
2) High volume on the last session, several times above the average.
3) Double bullish divergence. With the MACD and RSI.
4) Bullish hammer and Doji. Both can work as reversal signal, the Doji with high volume giving strength to the hammer.
5) Altcoins market continues with a bullish bias.
The hammer is invalidated on a 4h close below $54.
The chart in general can change but as it looks now, the bulls are waking up.
Namaste.

Triangle Pattern | $52Daily Chart
Compound BINANCE:COMPUSDT is in the triangle pattern and trading at 63.9x
Compound rejected 3 times from the support. That means it can go up to the resistance around 72 or further higher trend line
If Compound close below 60, it will go down the support around 52
Wait for next move

#COMP_USDElliott Wave count bearish scenario
COMPOUND wave 4 complete wave 5 start now my target usd 10 usd 5

already looks ShortLook at my last idea, I think it has completed wave B and is on its way to wave C.
If this idea is realized, the pattern of the head and shoulders can also be confirmed according to the figure.
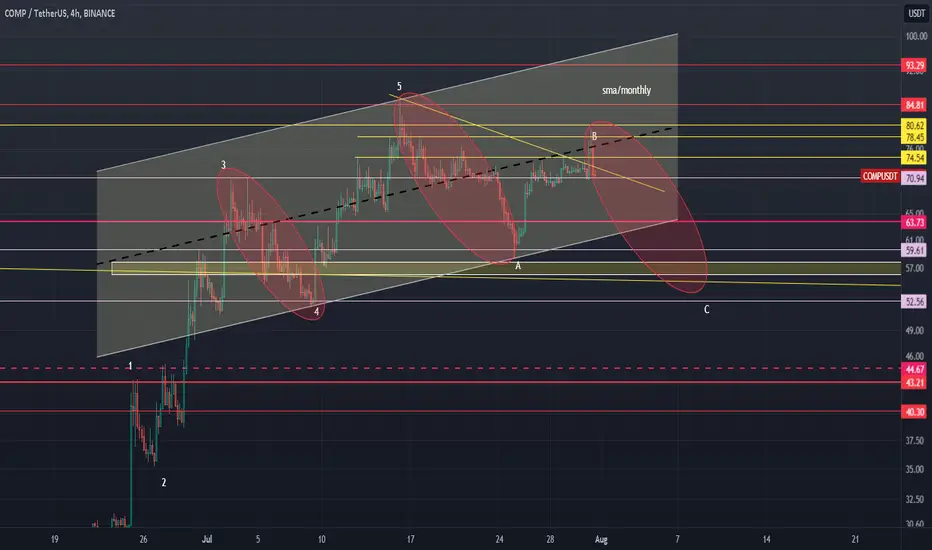
looking for a correctionMy previous idea stoped . Sometimes we have a multiple wave for wave 3. Therefore, the 3rd wave can be completed and we are now completing the 5th wave. Divergence is also evident between waves 3 and 5. The distance between the peaks and the previous bottoms gradually decreases.
Therefore, I still expect that we have a wave-like correction before climbing to the $93-$117 range. In this case, the range of $63 and $52 will play the role of strong supports and it is unlikely that the price will be able to fall below the range of $52.
The general trend of this coin is upward and it pursues high goals, and the period of this analysis is short-term.


COMPUSDTCOMPUSDT Just enter into the bullish phase.
Bullish divergence also form.
Double bottom reversal pattern also form.
This two reversal indicators strongly indicates that the trend is going to reversal from here.
we wait and watch for the breakout of last HH.

COMP come back to monthly supportThe instrument was heavily overbought and has been in a downtrend for a couple of days now, there is a strong support level at 58.50, which we have already hit once, according to the fixed volume profile, we can see that we have already gone beyond the lower part of the trade and soon the support level will be broken. I expect a small trade near the 58.50 level and an impulse breakout into the short.

Beware H&S comingI don't like what compound it's drawing in daily time frame, so beware if the resistance will break, surely we will touch 44/33 USD

COMPusdtThe COMP token has been experiencing a continuous downtrend, and there are indications of a potential (ChoCh) pattern, which could signify a trend reversal. It may be worth considering a long position at this point, with a target set before the entry point for a short position. However, please be aware that trading decisions should be made carefully, considering market conditions and your risk tolerance.

COMPUSDT could be Aiming for 30% Growth in the Blink of an Eye💎The low timeframe analysis of #COMPUSDT reveals that a consolidation phase has commenced after the price broke below the descending channel. Notably, there have been two significant bounces during this phase—one from the 78.6% Fibonacci resistance level at $80, and the other from the 88.6% Fibonacci level near the psychological support at $60. While the overall trend remains bullish, the current stage seems to favor buyers.
💎As #COMP continues to trade near the lower boundary of the formed range, buying interest is likely to increase. However, it is essential to be mindful that before any significant price surge, #COMP may enter the buying liquidity zone, which lies just below the recent low at $58.35. In such a scenario, the bottom of the extended descending channel could be tested.
💎On the other hand, if the extended descending channel is decisively broken, and the price falls below the $51.81 support level, bullish sentiments may wane as increased selling pressure could emerge. In summary, while the probability of an uptrend is currently high, there is potential for a relatively fast 30% price increase. 💎

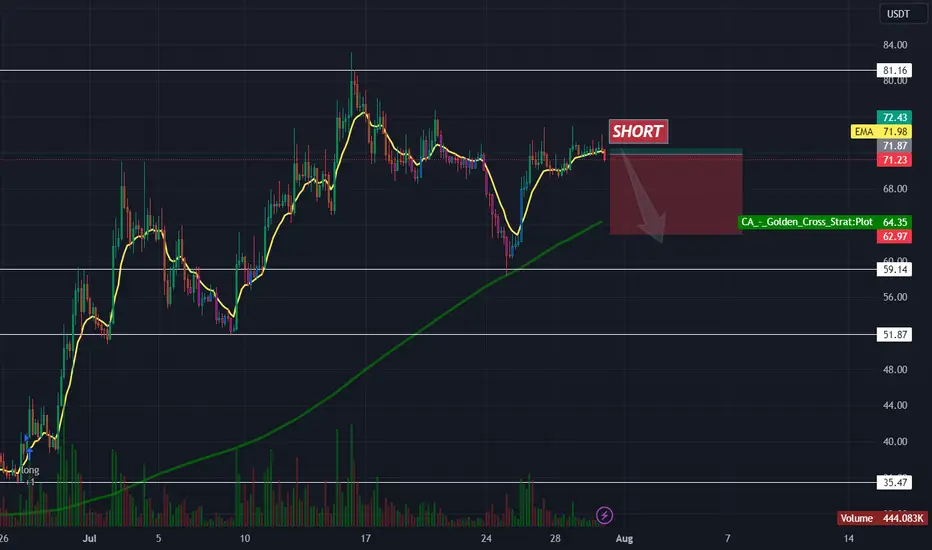
COMPUSDTHello Trader,
Short comp right now as we can see that COMP had made a double top and it is below the 200ma so we can expect a bearish trend from here short it.
COMPUSDT Elliott Waves AnalysisHello friends.
Please support my work by clicking the LIKE button👍(If you liked). Also i will appreciate for ur activity. Thank you!
Everything on the chart.
Entry: market and lower
Targets: 84 - 90 - 95
after first target reached move ur stop to breakeven
Stop: ~59 (depending of ur risk). ALWAYS follow ur RM .
RR: 1 to 4
risk is justified
Good luck everyone!
Follow me on TRADINGView, if you don't want to miss my next analysis or signals.
It's not financial advice.
Dont Forget, always make your own research before to trade my ideas!
Open to any questions and suggestions

Compound COMP price rose from the dead)The Compound project was fundamentally quite strong when it was sold / presented to crypto market participants)
However, over the 2 years of being in a downward trend, the price of t he COMP token has fallen 39 times from a high of $910 to a low of $23.
And now, in the last two weeks, a miracle has happened, the price of CompUSDT has come to life and is showing steady growth. Moreover, it is catching up with the crypto market, which started growing much earlier.
Currently, looking at the chart, we do not believe that the CompUSD price will break through and consolidate above the strong resistance zone above $55-65 at the first attempt.
Unless you have an insight as to why the COMP price should grow non-stop right now, then please share it in the comments)
In all other cases, we consider it safe to buy COMPUSDT only when the price is firmly established above $65
_____________________
Did you like our analysis? Leave a comment, like, and follow to get more

Compound Short Setup COMPUSDT.PCOMPUSDT.P Long term short position open.
Small leverage
Stop = 75.60
TP = 65-58-55

comp sellBINANCE:COMPUSDT is are giving us good profit in sell position risk reward ratio is perfect, lets take it.

COMP: Pullback in UptrendCompound (COMP) technical analysis:
Trade setup : Price broke above 200-day MA with huge volumes and confirmed a bullish trend reversal. It’s also broken above $70 to signal uptrend resumption and hit a high of $87 where some trader began taking profits. Priced pulled back to the nearest support of $60, which also lines up with Fibonacci levels of $62 (38%) and bounced right off of that. Upside potential to $90 next.
Trend : Uptrend across all time horizons (Short- Medium- and Long-Term).
Momentum is Mixed as MACD Line is below MACD Signal Line (Bearish) but RSI > 55 (Bullish). MACD Histogram bars are rising, which suggests that momentum could be nearing another upswing.
Support and Resistance : Nearest Support Zone is $60 (previous resistance), then $47. The nearest Resistance Zone is $70, which it broke, then $93.

COMPUSDT LONG SETUPCOMP is trading above the previous bearish trend line and reclaimed it successfully and there is a bullish continuation pattern of higher highs and higher lows and there is bullish hammer formed on the chart. all signs are bullish for now
This is not a financial advise do your own research before getting into the market

COMP: be carefulDisclaimer
High Risk Investment
Trading cryptocurrencies and Forex carries a high level of risk, and may not be suitable for all investors. Before deciding to trade cryptocurrency you should carefully consider your investment objectives, level of experience, and risk appetite. The possibility exists that you could sustain a loss of some or all of your initial investment and therefore you should not invest money that you cannot afford to lose. You should be aware of all the risks associated with cryptocurrency and Forex trading, and seek advice from an independent financial advisor. Since Any opinions, news, research, analyses, prices, or other information contained on this website is provided as general market commentary, and does not constitute investment advice. The Bibres will not accept liability for any loss or damage, including without limitation to, any loss of profit, which may arise directly or indirectly from use of or reliance on such information. All opinions expressed are owned by the respective writer and should never be considered as advice in any form.
A qualified professional should be consulted before making any financial decisions.
-------------------------------------------------------------------------------------------------------------------
