Compusdt.P Technical analysis BINANCE:COMPUSDT.P Re Enter this position. Use Dca Strategy or Martingale Strategy . Use low margin And Our Take profit Taargets: 75 / 67/60 and Our Stop loss or Dca price : 86$
If Stop loss will filled i will update our Position soon
COMPUSDT trade ideas

COMP/USDT Time For A Turnover! Hey traders 👋
COMP/USDT pair is next on our watchlist with a good potential for a turnover here. COMP had a massive bullish run which resulted in more than 220% of price movement without any major corrections.
P.S. Remember that weekends are not the best times for trading so do keep your risk management in order!
If you like ideas provided by our team you can show us your support by liking and commenting.
Yours Sincerely,
Swallow Team
Disclamer:
We are not financial advisors. The content that we share on this website are for educational purposes and are our own personal opinions.
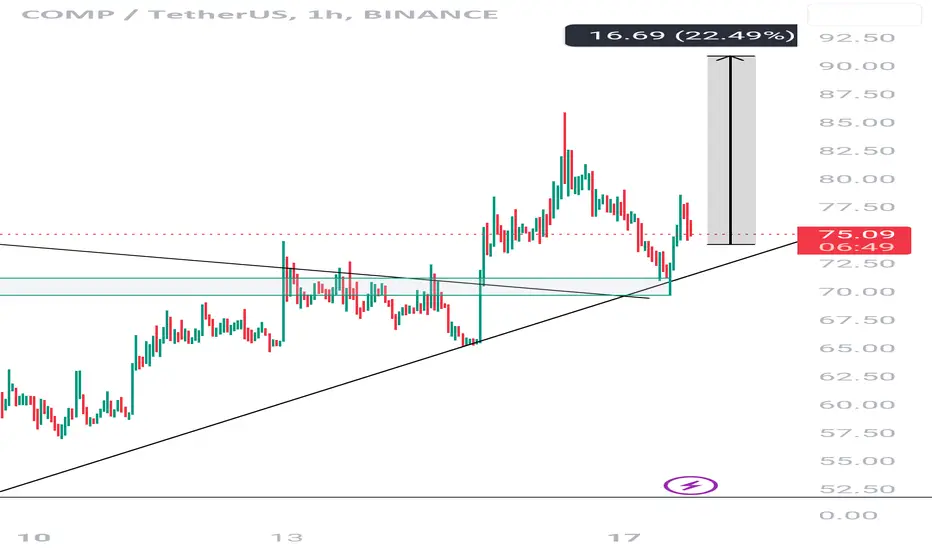
COMP/USDT (LONG NOWWW)Previously i posted my analysis of COMP when it was at 50$ range and clearly indicated the upcoming gains and also the important zones that will be followed.The price action followed our analysis and ranges 100% accurately.It went to the resistance zone of 86$ and now retested to the zone of support 68$.
Now, its time to retest the 86$ resistance again.As indicated in the chart a double bottom is created at the support area of 68$ which is indicating the uocoming retest.So it will be wiser to have a LONG position now.
#COMP/USDT
Entry: 68.5-72
Take profit: 81-86
Stop loss: 63.88
STAY PATIENT
STAY SAFE

COMP is still bullishHi, dear traders. how are you ? Today we have a viewpoint to BUY/LONG the COMP symbol.
For risk management, please don't forget stop loss and capital management
When we reach the first target, save some profit and then change the stop to entry
Comment if you have any questions
Thank You

Brief Analysis ——COMPAs a representative of liquidity, lending protocols are important to Defi. Based on the outstanding performance of COMP last week, we have a brief analysis of the tokens for three major lending platforms today. They are AAVE,COMP and MKR.
Since the second half of last year, the price of COMP has remained below 70, and has broken through 70 after the rising last week. Relative to AAVE, the gap between bulls and bears is wider for COMP. Since late June, the volatility of COMP has risen, long green candles have appeared, and the rise is continuous. While bearish power is visible, the red candles are short and not steep in slope. The bulls took control. On a large scale, it turned bullish.
Conclusion: Mostly fluctuation. There was a more obvious pin-bar last Friday. Bears gain strength. The gap between bears and bulls narrowed. So we come to this conclusion. We set resistance level at 85 and support level at 54.
If you have any ideas, welcome to communicate with us:)
Disclaimer: Nothing in the script constitutes investment advice. The script objectively expounded the market situation and should not be construed as an offer to sell or an invitation to buy any cryptocurrencies.
Any decisions made based on the information contained in the script are your sole responsibility. Any investments made or to be made shall be with your independent analyses based on your financial situation and objectives.

Compound Token (COMP) Analysis 08/03/2021we had our previous Publications TP Achieved
currently we can see a Bullish Hidden Divergence of price with MACD, which is the sign of trend continuation,
using Fibonacci Projection for the Target Specifications.
1TP is the parallels leg of Fibonacci projection and easy to achieve by nest impulse wave after the current retracement.
if 2TP triggered with the first rally then we may have a price correction and our 3 TP is confirmed.

Comp monthlyIn monthly chart.... Comp is in corrective wave..... Wave A complete now wave B has began.... It can go to 140 in FIB 0.5 or 220 in FIB 0.618......

COMPNYSE:COMP will likely dip 55%
1. RSI Bearish Divergence
2. RSI trendline break to the downside
3. Volume Divergence
4. Overbought on Bollinger bands
5. Potential Shark Pattern

Compusdt.P Technical analysis Big short, Bloodbath comingBINANCE:COMPUSDT.P Big short coming in daily timeframe strong resistance zone,
Please make sure your risk managment, and don't open high deposit

Comp Still Strong Compusdt
I am expecting price to bounce again from here
I believe this symmetrical pattern breakout & successful retest is going to push comp price for short term
Let's see
Dyor

Compound 50 ma crossThe 50 ma is about to crossthe200 on the daily the 20 crossed the other week and that gained 🐂 ish momentum we are at 14 month highs and the resistance next is the 95$ area a solid 20percent

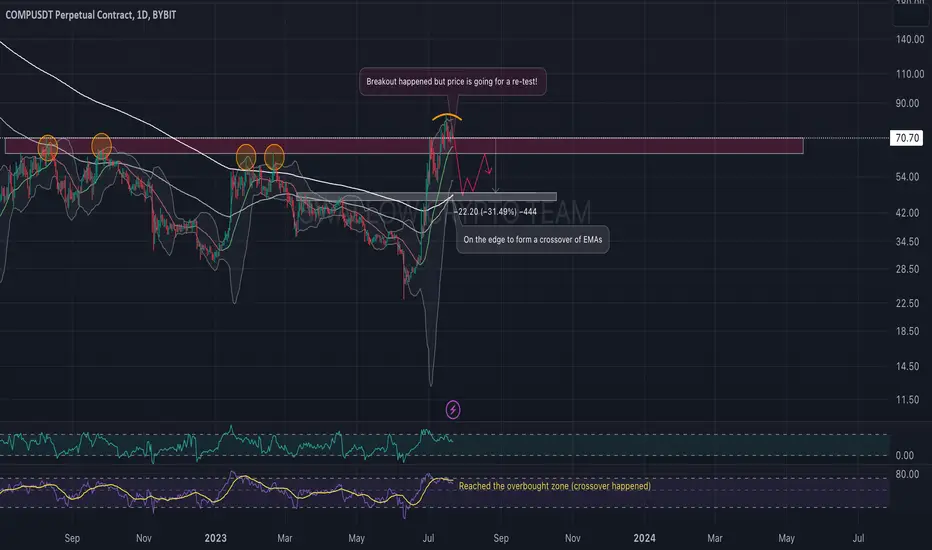
COMP: Resistance BreakoutCompound (COMP) technical analysis:
Trade setup : Price broke above 200-day MA with huge volumes and confirmed a bullish trend reversal. It’s also broken above $70 to signal uptrend resumption, with upside potential to $93 resistance.
Trend : Uptrend across all time horizons (Short- Medium- and Long-Term).
Momentum is Bullish (MACD Line is above MACD Signal Line and RSI is above 55).
Support and Resistance : Nearest Support Zone is $60 (previous resistance), then $47. The nearest Resistance Zone is $70, which it broke, then $93.

COMPUSDT time to shortThe current status of the BINANCE:COMPUSDT is as follows:
The BINANCE:COMPUSDT has experienced a great rally and has moved directly towards one of the historical resistances at $75.
However, we are seeing divergence in the rsi indicator in both the daily and 4-hour timeframes, which indicates a weakening trend and also a good opportunity for those who had long positions to exit.
⚠️"Daily crypto market analyses I provide are personal opinions & not financial advice. Trading carries risks, so do your own research & seek advisor's help."
Don't forget to like and comment

idea on COMP Observing the market for 2 years, when an altcoin is interesting to a big player, when reaching low prices for the asset, there is mostly a strong upward movement (means that it is selected).
Therefore, it is useless to hope that this growth will be endless.

#COMPUSDT #LQR #TOBTC #LaqiraProtocolThe price is in The channel. The confluence of static and fib levels and the channel ceiling Level after confirmation and matching with bitcoin levels can be a good opportunity for sell trades Scalpe support is also clear after confirmation and matching with Bitcoin levels you can open long positions This analysis is not an offer to buy or sell

againts BTC btc goes up but this one it we go down, I think it's gold chance to take it short but as you see we have big SL so please be aware.. goodluck

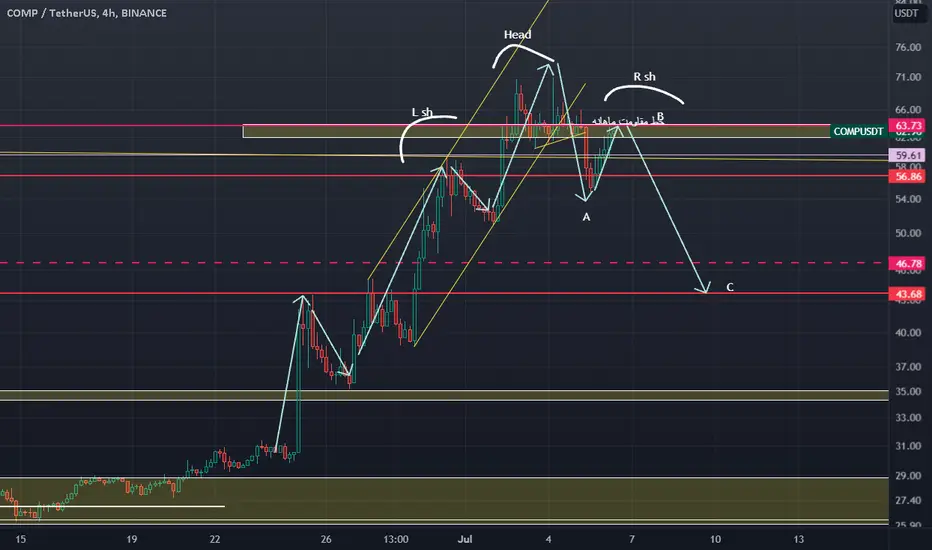
COMP head and shoulderscomp has compeleted 5 wave and it seems is in a correction wave with head and shoulders pattern.
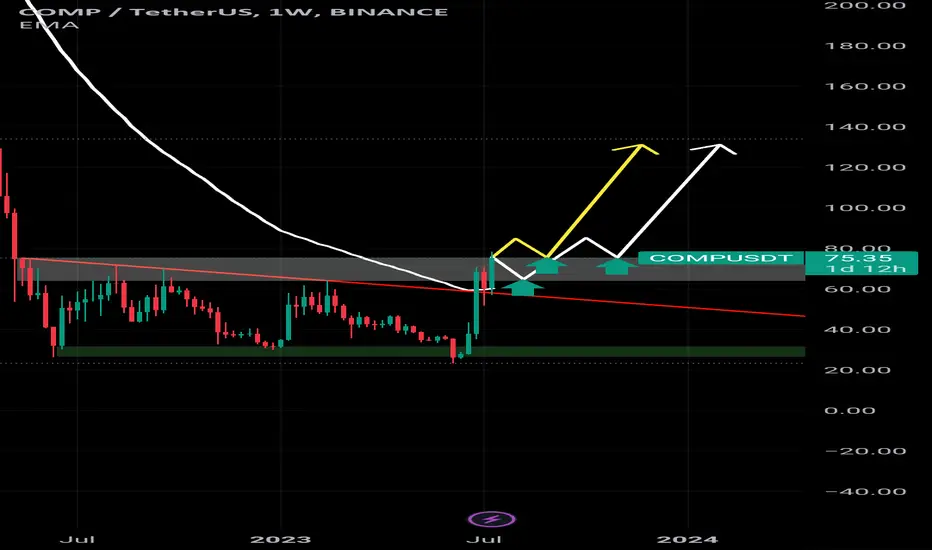
COMP longterm Long SetUpComp looking for huge long opportunity.
Will enter on one of the green arrows
comp towards 90+++after spending some days on resistance COMP is now on its way towards its strong resistance 90++ this is my swing long setup for comp RISK under your control !

Hello Comp, Chaos has come for youEntered comp $70. Comp is superoversold on the rsi on all time frames blown past the elliot wave targets.
Shorting to support taking profit on the short position MM built on this final leg

COMPUSDT - if break goes plummet
preconditions for well break a trendline.
1. Beautiful a trendline
2. Historical level the daily chart
3. Nead confirmation a sell zone
I have two scenarios, and I want to make some money.
if you like the idea, please "Like" it. This is the best "Thanks!" for the author 😊 P.S. Always do your own analysis before a trade. Put a stop loss. Fix profits in installments. Withdraw profits in fiat and please yourself and your friends.

Great Short on COMPUSDT Comp just completed the B Wave and will start the C Wave and it will be fast and aggressive.
