COMP SHORT SETUPHello, dear traders. how are you ? Today we have a setup to SELL/SHORT the COMP symbol.
For risk management, please don't forget stop loss and capital management
COMPUSDT trade ideas

Move towards resistanceHello friends, I hope you are doing well
We have experienced a fake breakout at the bottom of the channel and the price is expected to move towards the top of the triangle.
Entry point: 50
SL: 47
TP: 52.5

COMP : Trend updateIncrease expecting on a small time frame.
we will follow the trend.
Whale volume possible on this coin.

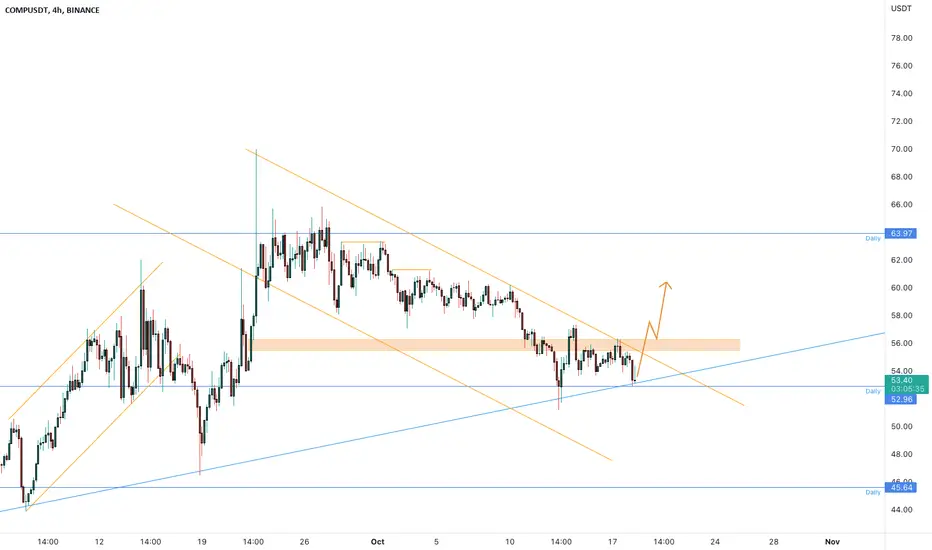
COMPUSDT is inside a massive descending channelThe price is creating a descending channel inside a main ascending channel on the daily timeframe.
Now the price is testing an important support at 53$
How to approach it?
IF the price is going to have a breakout and retest the current resistance as new support, According to Plancton's strategy , we can set a nice order
–––––
Keep in mind.
🟣 Purple structure -> Monthly structure.
🔴 Red structure -> Weekly structure.
🔵 Blue structure -> Daily structure.
🟡 Yellow structure -> 4h structure.
⚫️ black structure -> <= 1h structure.
–––––
Follow the Shrimp 🦐
COMP/USDT Short...COMP /USDT Sell.... This is not signal... Dont risk more than 3% of your account on any trade...

COMPUSDTPSHORT TYPE
•ENTRY: On chart or grey number/line
•SL: (on chart)
•TP: Take profit 50% when reach 100% and set ur SL on BEP, or take profit with ur trading style

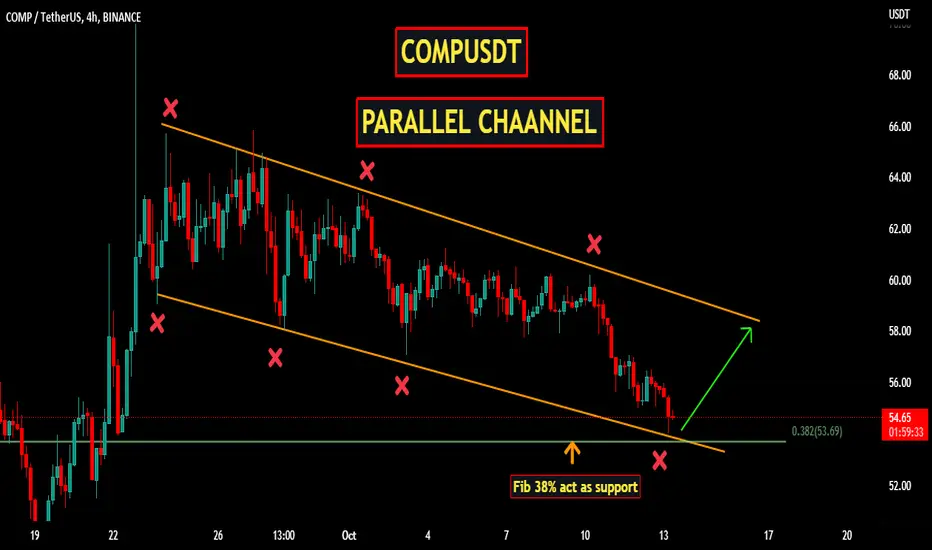
COMPUSDT | PARALLEL CHANNELCOMPUSDT after defining a top around 70. The price action is trading in a bearish parallel channel .
The immediate support lies in 38% fib, where we also saw good bounce.
Trade your levels accordingly.
COMP/USDT longIdk anything about this token, but technical analysis points for a long position with a upward potential of almost 22%. With USA's inflation data coming in today, extra caution is advised.

COMP/USDT potential 200%+ gain!The trade setup is very ambitious indeed. However, we believe that COMP is currently one of the most attractive coins.

COMP Chart AnalyzeAccording to the 15Min chart analyze market will going down by hitting the trend line


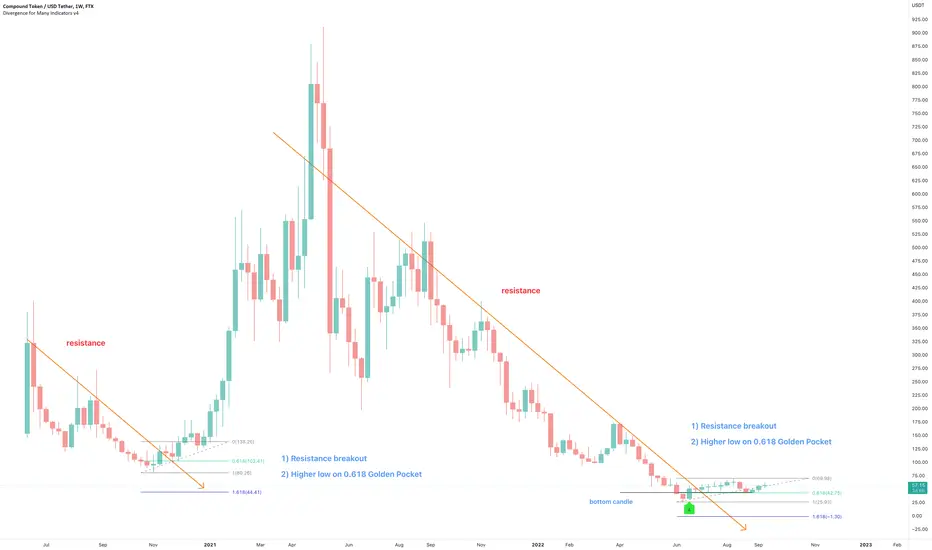
Compound (COMP) - Ridiculous move soonOn the above 1-week chart price action has corrected 95% since May 2021. A number of reasons now exist to be bullish, including:
1) A strong buy signal prints (not shown). If you want to see, just ask.
2) Price action, RSI and MFI resistance breakouts.
3) Regular bullish divergence.
4) Everything that was said above is also true for the BTC pair.
5) Price action prints the higher low on the golden pocket following point #2. Look left!
Is it possible price action falls further? Sure.
Is it probable? No.
Ww
Type: trade
Risk: <=6% of portfolio
Timeframe: Don’t know.
Return: $800 / 1400%
Stop loss: None
COMP/USDT is about to nuke!This is the last warning on this super trade. What you see on the chart is only the nearest target, while the price can go muuuuuuch higher!!!

COMP LEVELS TO WATCH COMP KEY LEVELS TO WATCH FOR REACTION, either a break to the upside to take the sell liquidity or a push down to the demand zone


Comp doesn’t wanna go downCompound recently reached the upper trendline of this pennant pattern, and it broke to the down side but seems like it’s regaining its level back.
Entry $62.40
Stoploss $57
Tp1 $92.67
Tp2 $115.21
Tp3 $134

COMP Long closed @ 60.75 for +20%Scalp trade successful. We're most likely going to see a small pullback here, I may enter another trade soon.

Possible short entry COMPUSDT 1:6.7 RRBINANCE:COMPUSDT
Divergence on Squeeze Momentum LB and RSI, shorting for 1:6.7 RR
Entry $64.78
SL $66.28
TP $54.64

COMPOUND COMP price ready for x2 growth?Today, we liked the Compusdt trading pair on global 3 days chart.
It has not been analyzed for a long time, but now I liked that the Compusd price is moving in its own way, despite the maneuvers of the BTCusdt price.
In general, Compound Protocol is in the top 10 in terms of volumes of blocked resources (TVL) in DeFi protocols
Perhaps the individual behavior of the Compound price is somehow affected by this news: "DeFi project Compound has launched a lending service for institutional investors"
Or maybe something more interesting is being prepared in the project, which we will find out after the COMP price shoots up)
Summing up: while the COMP price is above $55, there is a good chance for x2 growth to the $100 area, where there is a strong liquidity zone.
_____________________
Did you like our analysis? Leave a comment, like, and follow to get more


COMPUSDT | SELL ON BREAKCOMPUSDT has been trading with in a bullish parallel channel.
The price is currently trading at lower boundary of channel.
The break below will give strength to bears.
Manage your trades accordingly,

COMP WAVES ANALYSEWe are in a large diametric. We are now in wave F of this large diametric.
This branch F itself has become a diametric diamond that looks like future fluctuations.

