COMP might explodewe can see a good upside in COMP do look at it BINANCE:COMPUSDTPERP
#DYOR #POV #NFA
COMPUST trade ideas

Short COMPUSDTBearish indications:
LLLH
Rejection from resistance
Bearish engulfer and Shooting star candles
Trade Plan Short:Entry 50.66-50.33
SL 51.45
TP1 : 49.21
TP2: 48.58

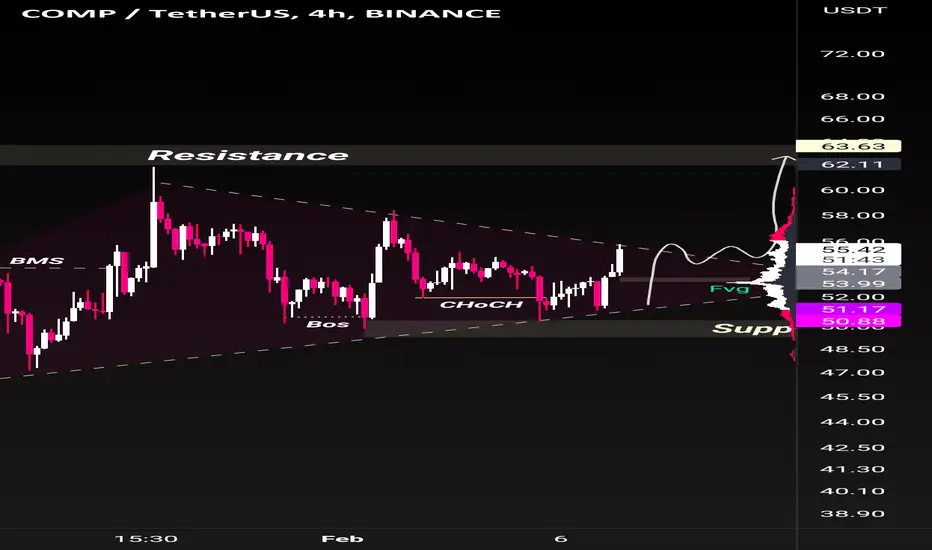
✅TS ❕ COMPUSD: fixed above the channel✅✅ COMP is fixed above the upper border of the channel.
The price held the support level.
I expect that the asset will begin to rebound from the current level. ✅
🚀 BUY scenario: long to 59.84. 🚀
----------------------------------------------------------------------------
Remember, there is no place for luck in trading - only strategy!
Thanks for the likes and comments

COMPOUND - A lot of resistance at long term trendlineCompound can't quite break out of its long term trendline and the 50 SMA right above that. Might have an explosive move upward to break all of these levels.

COMPUSDT...my new sh*t idea!BINANCE:COMPUSDT
nice chart setup
it's bullish since a while
now you can trade a buy if you check the below chart ( or just don't )
disclaimer: NOT MY RESPONSIBILITY
#STOP_BEING_POOR

COMP 20% grow tradeIf you are looking for altcoin which has good entry point - COMP is a good choice.
The support line on 46.14 was not broken.
Took enough liquidity to retest up again.
I expect on 60.

Compusdt Getting ready for Bullish move Compusdt
Breaks successfully lacal resistance & Also forming bullish pennant in 4h time-frame
Better is to wait for breakout confirmation expecting 30% Bullish Move
Do your own research,
Always manage risk

Comp Looks Promising For breakout Seems Like Comp getting Ready For Further Upside continuation
Forming bulish Pennant In H4 Incase Of breakout expecting 35 to 40% bulish move

COMPUSDT Breakout doneComp breakout and successfully retest its trendline line after a long time
Bullish rally expected 2-3x
DYOR
NFA
comment below the coins that you want me to chart
Don't forget to follow and like👍 if you enjoy + comment your opinion about the market or your thoughts, below this analysis

COMPUSDT | APPROACHING TO BUYERS ZONECOMPUSDT previously broken above the long down trend line. The price has been in a bullish trend. Now the price is again approaching to he previous breakout zone which has a confluence point of 100MA too.Th bulls can show strength at this point.
Manage your trades accordingly.

✅TS ❕ COMPUSD: downward channel✅✅ COMP tests the upper limit of the channel.
The price forms descending peaks.
I expect further decline after consolidation in the channel. ✅
🚀 SELL scenario: short to 48.45. 🚀
----------------------------------------------------------------------------
Remember, there is no place for luck in trading - only strategy!
Thanks for the likes and comments

Long COMPThis is no financial advice
Comp holding a structure breakout, against a monthly orderblock, with proper support on the 50 line of the pitchfork, expecting a move to the Median Line, Stochastic also giving some data about sentiment. My target will be the ML which can vary acoording to the timeline, but also eyeing the Breaker on the W and M tf, around 100 usd.
Stay safe

COMPUSDT | BULLISH PARALLEL CHANNELCOMP has been trading with in a bullish parallel channel .
The price has made multiple attempts to break below but bulls keep it holding.
Now price is trading near the falling resistance and bulls need to break above the resistance
The bulls are in control.
Manage our trades accordingly.


#COMPUSDT #LQRUSDT #TOBTC #LaqiraProtocol EMA200 Important EMA200 daily is important resistance
The price involved in dynamic EMA200 daily resistance and there is a possibility of price correction.
first support $50 and $47 $45
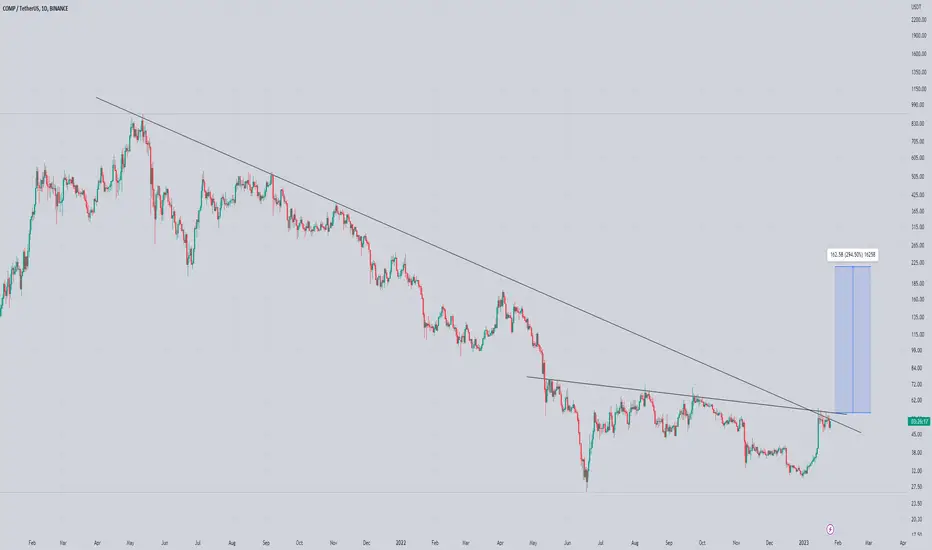
Compusdt Testing 2 Trend line At Same Time
Incase Of Breakout Expecting 300% Bulisih Move
(Note) Always Wait For Confirmed Breakout)
(Comp Will Remain Bearish Untill Its Broke Trendlines)
COMPUSDT | BULLS CHARGED UP!COMP after breaking the falling resistance, the price has been in consolidation near the resistance zone.
Now the price has broken above the resistance zone.
The bulls can take the price higher and can target 70 as well.
Manage your levels accordingly.

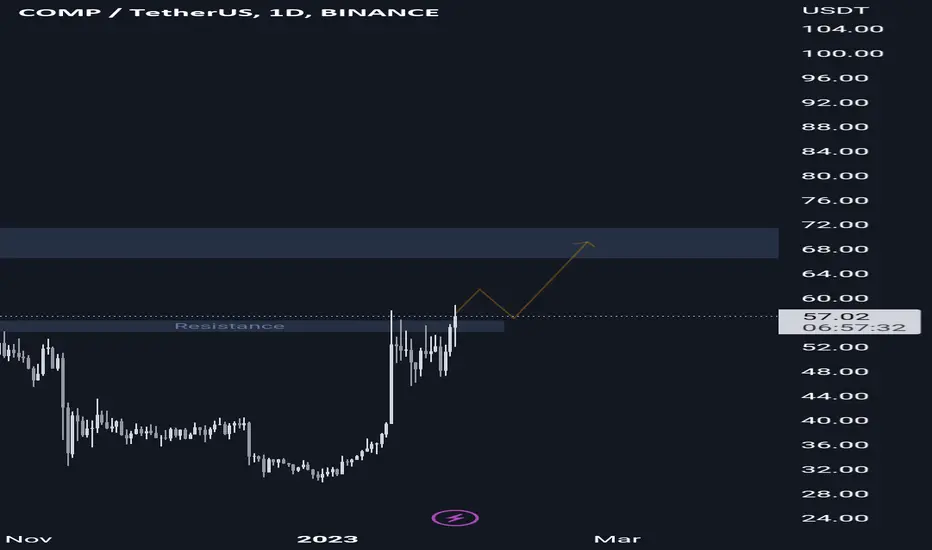
COMP targetsComp is trying to break $57 resistance, break it daily closing above 57 and we are ready for $70.
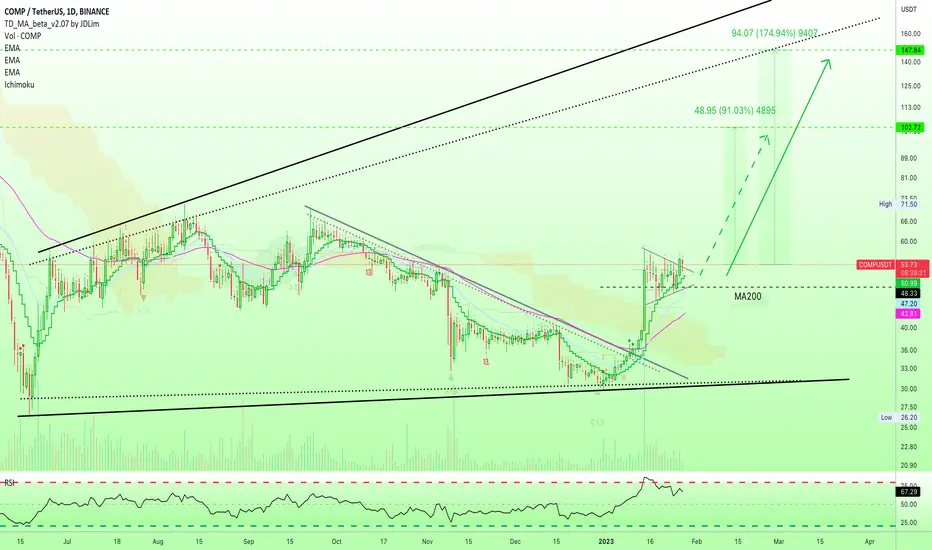
✴️ Compound Is One Of The Strong Ones | $102, $147 Next!We have good and great altcoins projects, we have big, medium sized and small ones... We also have crappy and scammy projects and everything that is in-between...
Based on Technical Analysis, we have weak and strong charts also.
Compound is one of the strong ones, this can be seen easily on this chart.
Its price is already trading above MA200.
In late 2022 and early 2023, December/January, it produced a higher low compared to June rather than a lower low.
14-January we have the highest daily volume ever for this pair.
The RSI is super strong.
The long-term higher low and the ultra-high volume are the heavier signals on this list, while MA200 is also quite good.
You are about to experience the strongest bullish wave in years... Something we haven't seen since March 2022 or even before.
Remember to prepare and maximize profits.
And THANKS for your continued support.
Namaste.

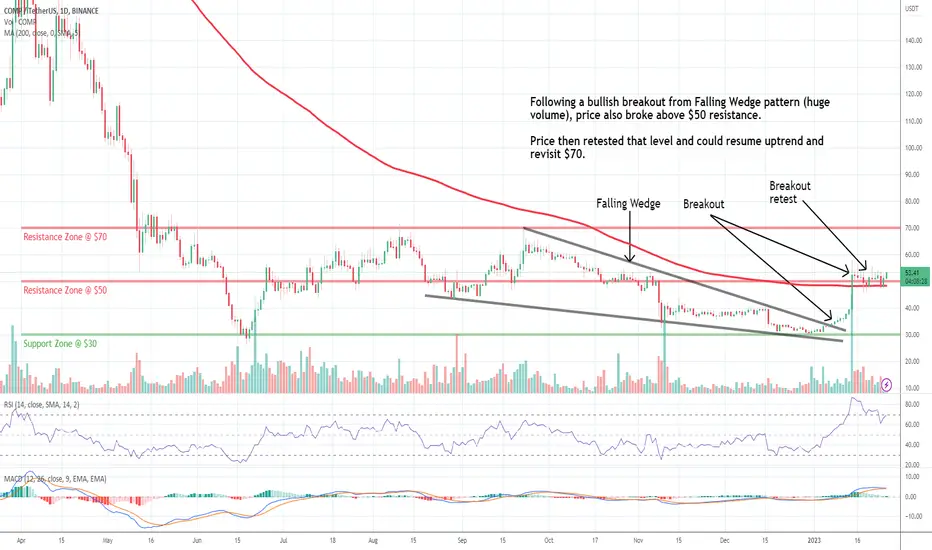
COMP: Resistance Breakout!Compound (COMP) technical analysis:
Trade setup : Following a bullish breakout from Falling Wedge pattern (huge volume), price also broke above $50 resistance. Price then retested that level and could resume uptrend and revisit $70. (set a price alert).
Trend : Uptrend on Short- and Medium-Term basis and Downtrend on Long-Term basis.
Momentum is Bullish but inflecting. MACD Line is above MACD Signal Line and RSI is above 55 but momentum may have peaked since MACD Histogram bars are declining, which suggests that momentum is weakening.
Support and Resistance : Nearest Support Zone is $30. The nearest Resistance Zone is $50, which it broke, then $70.
COMPUSDT Wait for the triangle level to break or buyWait for the triangle level to break or buy at the bottom of the lower side of the triangle
