Compound (COMP)
🔢 COMP Analysis
🔹 Overall Status:
The COMP coin, after following an ascending channel, successfully broke above the channel’s ceiling. At the PRZ zone (which includes the ascending channel ceiling and weekly resistance), selling pressure led to a price correction, pushing the price down to the 0.382 Fibonacci level.
✅ Key Point:
Stabilizing above the PRZ zone can accelerate price growth toward Fibonacci targets.
Trading volume in this area is crucial as it can provide stronger signals about the buyers' or sellers' dominance.
🔹 Support and Resistance Analysis:
1️⃣ Support Levels:
First Support: 0.382 Fibonacci level around $79-$81.
Second Support: 0.5 Fibonacci level around $68-$71.
Third Support: 0.618 Fibonacci level near $60-$62.
2️⃣ Resistance Levels:
PRZ Zone: Weekly resistance and broken ascending channel ceiling (around $92-$103).
Bullish Targets:
First Target: 1.618 Fibonacci level (already achieved).
Second Target: 2.618 Fibonacci level near $300-$330.
Third Target: 3.272 Fibonacci level around $500-$550.
Final Target: 3.618 Fibonacci level near $720-$750.
🔹 Price Movement Prediction:
1️⃣ Bullish Scenario (if price stabilizes above PRZ):
If the price stabilizes above $140 (PRZ zone), it may head toward the 2.618, 3.272, and 3.618 Fibonacci levels.
Increased trading volume above PRZ will confirm buyers' dominance.
2️⃣ Bearish Scenario (if the correction continues):
If the 0.382 Fibonacci level is broken, the price correction could extend to the 0.5 and 0.618 Fibonacci levels.
These levels could offer attractive opportunities for re-entry via laddered buying.
🔹 RSI and Entry Signals:
The RSI indicator on the weekly timeframe is at 72.71 (overbought zone), indicating possible selling pressure.
Positive Note: A bullish divergence between the price and RSI suggests the uptrend may resume after a correction.
The ascending RSI trendline can act as support.
✅ Conclusion and Recommendations:
1️⃣ Key Levels:
Supports: $79-$81 (0.382), $68-$71 (0.5), and $60-$62 (0.618 Fibonacci).
Resistances: $130-$140 (PRZ) and higher targets at $300-$330, $500-$550, and $720-$750.
2️⃣ Entry Strategies:
Laddered buying near 0.5 and 0.618 Fibonacci support levels if the correction continues.
Entry after price stabilizes above the PRZ zone ($130) with rising trading volume.
3️⃣ Risk Management:
Pay close attention to trading volume and price action near critical levels.
Monitor the RSI indicator to assess trend strength and identify potential corrections or continued growth.
💡 Final Recommendation:
In the current conditions, wait for technical confirmations (such as stabilization above resistance or corrections to lower levels) before entering. Prioritize capital management to minimize risks.
COMPUST trade ideas

COMP. DeFi's Hidden Gem. 12/14/24The token price has been trading sideways for a while but recently broke out of this range, signaling potential growth ahead. Additionally, it has broken resistance and performed a textbook retest of this level, providing another positive signal for continuation to the upside.
Personally, I’m expecting a pump from #COMP.
Let’s see how it plays out!
DYOR.

A Snapshot of Recent Trends and Key LevelsThe current price of the COMP/USDT pair on Binance is approximately $109.28, with a decline of -2.21% over the last 24 hours. Over the past month, the price has experienced a significant increase of 117.02%, reflecting strong market recovery. However, recent fluctuations suggest high volatility.
Key Levels:
Support: Around $102.
Resistance: Currently at $109-$110, with potential for upward momentum if this level is breached.
General Trend: Technical indicators show a bullish sentiment with buy signals on daily and weekly timeframes.

COMPOUND #cryptoI don't have much understanding of cryptocurrency. I have purchased this and a few other coins based solely on technical charts. Since it's a very risky investment, I've only invested a small amount.

COMPCOMP-USDT
Buy entry from the current price 🟢
If there is a correction, we support from $109
$142.8
Stop loss:
Close the four hour candle down
$102.45

$COMP/USDT after it shattered an 800-day trading rangeExtremely bullish on DeFi!
Just opened a long on $COMP/USDT after it shattered an 800-day trading range.
Expecting a target of around $200, Look out for Sushi and YFI


Compound At Bottom Prices: Altcoins Accumulation ContinuesThe best time to buy an Altcoin is when it is trading very low, near support and after a strong consolidation phase. One more criterion, with Bitcoin ultra-bullish and rising; the best time to buy the Altcoins is now.
Look at COMPUSDT (Compound), the bottom was hit June 2023. A major long-term higher low in August 2024. More than 900 days of consolidation, bottom prices and ready to grow.
Very easy growth potential of 555% can be achieved when the pair hits $322. New All-Time High can hit around $2,400 (can be more), total growth potential from current price goes beyond 4,700%. Strong project, easy win, there is no way to go wrong with these trades.
A few months ago, say in August or September, I would understand anybody that had doubts about what is coming next year, what comes next, right now, doubt is no longer possible, some pairs are breaking up in the tune of 200% and 300% in a single day. What 2025 has in store for us we all know, Bitcoin continues to move higher and the higher it goes, the stronger the Altcoins will grow.
The confirmation comes from Bitcoin; what Bitcoin does, the market follows.
Bitcoin is the name of the game. If Bitcoin is doing good, great, it means that the Cryptocurrency market is about to experience its strongest ever bullish wave.
Bitcoin can continue to grow 50%, 100%... And this is great, but an Altcoin can grow 500% or 1,000% or more in the same amount of time, choose wisely. Defining your goals and why you are trading is very important to achieve the desired level of success.
Are you in it for money? Entertainment/fun?
Are you in it to increase your capital? To support the market? To support Bitcoin?
Whales trade Bitcoin because it can take billions of dollars in a single trade.
Retail trades Altcoin, because it is the only way to grow big and fast if you have a relatively small capital to start.
All is good as there are many of us, but if you are in it for the money, choose the pairs with the highest potential for growth. Big stable projects that are sure to grow in 2024, 2025 and beyond. The wait might be long, several months, but the end result is worth the wait; patience is key.
Namaste.

COMPUSDT (Compound) Updated till 04-12-24COMPUSDT (Compound) Daily timeframe range. we can see really nice continuous push from its local low. very close to 153.67 it got fuel all it needs a confirm break. a little correction will be healthy here. but needs to stay above 103.24 for later move.

COMPUSDT: Volume Spike & Buyer ZonesCOMPUSDT is showing a serious volume spike, signaling strong market interest and potential accumulation. These green boxes highlight key buyer opportunity zones, where demand could push the price higher.
Why These Zones Matter:
Volume Confirmation: The recent surge in volume suggests active participation, often a precursor to significant price movement.
Historical Support Levels: The green boxes align with areas where buyers previously stepped in, providing strong support.
What to Watch For:
A bounce from these zones could signal the start of a bullish move.
Monitor volume closely; continued strength may confirm buyer dominance.
Patience is key if COMP holds these levels, it might set the stage for a promising rally.
I keep my charts clean and simple because I believe clarity leads to better decisions.
My approach is built on years of experience and a solid track record. I don’t claim to know it all, but I’m confident in my ability to spot high-probability setups.
My Previous Analysis
🐶 DOGEUSDT.P: Next Move
🎨 RENDERUSDT.P: Opportunity of the Month
💎 ETHUSDT.P: Where to Retrace
🟢 BNBUSDT.P: Potential Surge
📊 BTC Dominance: Reaction Zone
🌊 WAVESUSDT.P: Demand Zone Potential
🟣 UNIUSDT.P: Long-Term Trade
🔵 XRPUSDT.P: Entry Zones
🔗 LINKUSDT.P: Follow The River
📈 BTCUSDT.P: Two Key Demand Zones
🟩 POLUSDT: Bullish Momentum
🌟 PENDLEUSDT: Where Opportunity Meets Precision
🔥 BTCUSDT.P: Liquidation of Highly Leveraged Longs
🌊 SOLUSDT.P: SOL's Dip - Your Opportunity
🐸 1000PEPEUSDT.P: Prime Bounce Zone Unlocked
🚀 ETHUSDT.P: Set to Explode - Don't Miss This Game Changer
🤖 IQUSDT: Smart Plan


COMPUSDT 1WCOMP ~ 1W
#COMP There are two buying scenarios that you can do in conditions like this.
Wait for this red resistance line to be successfully broken through with strong volume then buy afterwards or you can buy during the retest of this support block. Minimum target 20%+
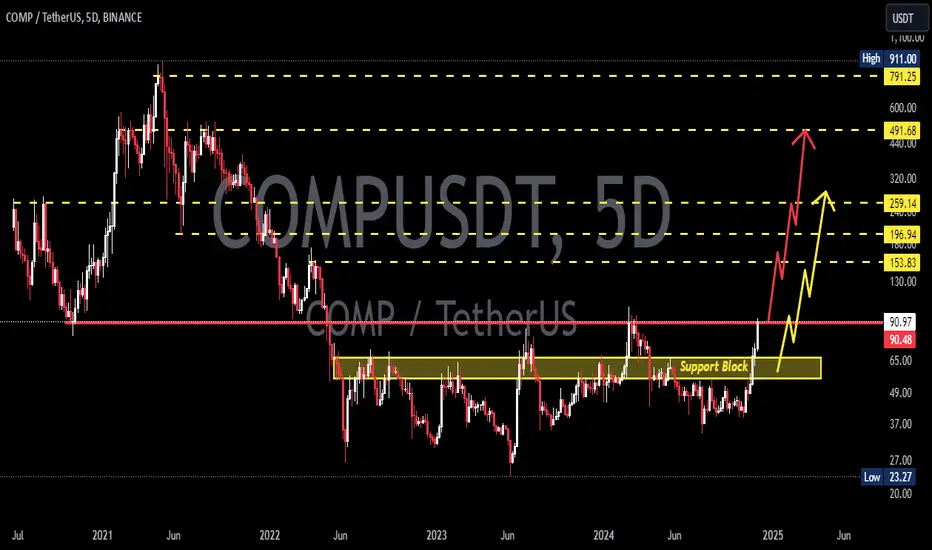
Comp - the box1000 days of accumulation, after the bull in 2021 it merged by -97% of the high. It is being pressed towards the accumulation breakdown, the nearest target is x3 from the breakdown.

Comp - the box1000 days of accumulation, after the bull in 2021 it merged by -97% of the high. It is being pressed towards the accumulation breakdown, the nearest target is x3 from the breakdown.

COMPUSDTCompusdt could go up if it breaks the long term weekly resistance of 97. THe white lines drawn are the targets.
BINANCE:COMPUSDT.P

COMPUSDT is waiting for a pump!!!COMPUSDT is consolidating in a channel since June 2022. If COMPUSDT breaks $85ish, then pull back little bit to create low high, I expect it is gonna shoot up to zone $148.

$COMPUSDT more than 50% gainsHello Traders,
This chart tells me "Im ready and hope on". Agreed on that. Im thinking Comp will do slightly pull back and will start big wave, You can consider to hop on now too.
entry and exit prices on the chart

Alikze »» COMP | Ascending channel - 1W🔍 Technical analysis: Ascending channel - 1W
- It is moving in an upward channel in the weekly time frame.
- According to the correction of the previous wave as 0.38 Fibo, demand is encountered in the area of the bottom of the ascending channel and an ascending candlestick is observed in the area of the bottom of the channel.
- Currently, in the weekly time frame with the buying pressure candle, the dynamic trigger is broken and it can continue its growth with demand in the range of the green box of the next wave at least up to the ceiling of the growth channel.
💎In addition, in case of failure of the first channel, the upward wave can continue to grow up to the specified supply area.
⚠️ Note: If the candle closes below the Fibo 38 range, there will be more possibility of correction and the continuation of the bullish scenario will be invalidated and should be checked and updated again.⚠️
»»»«««»»»«««»»»«««
Please support this idea with a LIKE and COMMENT if you find it useful and Click "Follow" on our profile if you'd like these trade ideas delivered straight to your email in the future.
Thanks for your continued support.
Best Regards,❤️
Alikze.
»»»«««»»»«««»»»«««
BINANCE:COMPUSDT

COMPUSDTPIntention is to snipe the 6hr resistance in the middle of a FVG, and target the length of the source candle in the demand zone below, where I expect a reaction/reversal to the upside.

COMPUSDTHMT v1.0 spotted. Looking good with previous wave up with increasing volume and momentum.
- BOS (Breaks of Structure) at @ 50.94 - 51.52 level
- Trending slow and steady if able to hold above the BOS level
It is at extremely good reward to risk level.

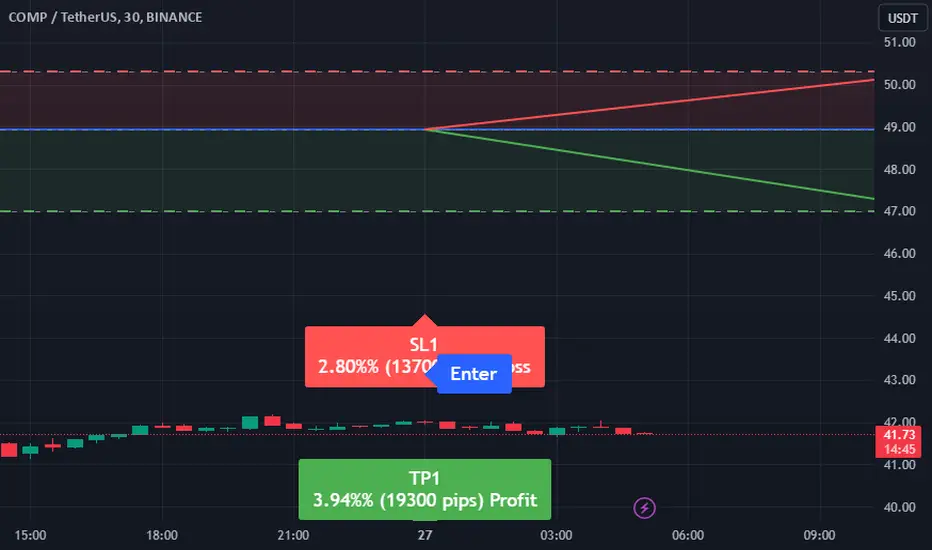
Trade Alert: COMPUSDT Sell SignalAttention traders! We have a new trade setup for the COMPUSDT pair. Here are the details:
Direction: Sell
Enter Price: 48.93
Take Profit: 47
Stop Loss: 50.3
This trade signal is generated using the EASY Quantum Ai strategy, which leverages advanced analytics and market sentiment to provide optimal entry and exit points.
Justification for the Sell Signal:
1. Technical Analysis: Recent price patterns indicate a downward trend with increasing bearish momentum. Candlestick patterns confirming sell signals have emerged, suggesting further downside potential.
2. Resistance Levels: Near-term resistance has been identified around the 50.00 level, with multiple rejections indicating strong selling pressure that may prevent upward movement.
3. Volume Analysis: Decreased buying interest and an increase in selling volume suggest an impending price decline.
4. Market Sentiment: Sentiment indicators show a decline in bullish confidence, aligning with the negative outlook.
Please manage your risk accordingly and monitor the trade as market conditions evolve. Ensure to follow your risk management practices when executing the trade. Happy trading!
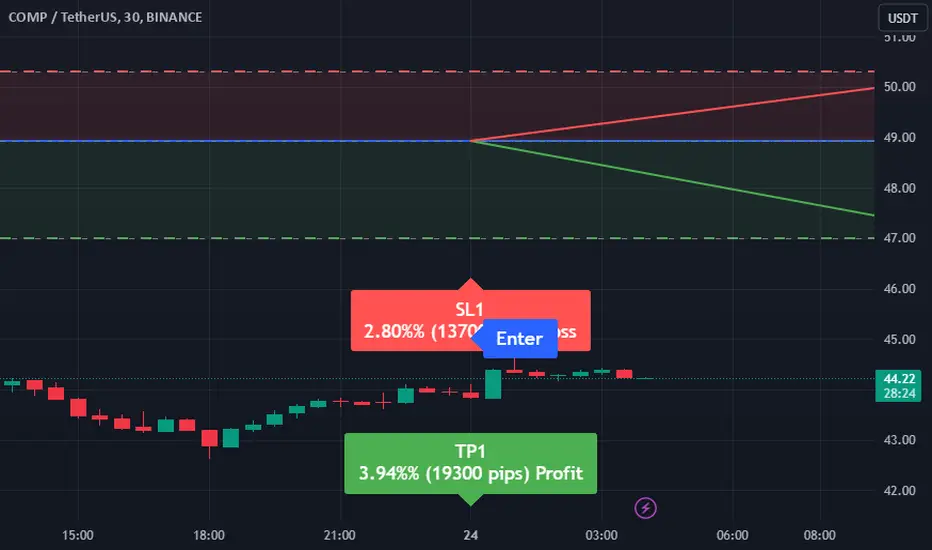
Trade Signal for COMPUSDT: SellStrategy: EASY Quantum Ai
Hello Traders,
We have a new trading signal for the COMPUSDT pair. Based on our analysis using the EASY Quantum Ai strategy, we recommend a Sell position with the following parameters:
Enter Price: 48.93
Take Profit: 47.00
Stop Loss: 50.30
Analysis & Justification:
Our decision to suggest a Sell position stems from multiple analytical factors identified by the EASY Quantum Ai strategy:
1. Technical Indicators : The recent analysis shows a divergence in momentum indicators, highlighting a potential downtrend. The Relative Strength Index (RSI) has shown bearish trends confirming selling pressure.
2. Market Sentiment : There is a noticeable surge in sell orders across major exchanges, indicating a decline in investor confidence for the COMP token against USDT.
3. Support and Resistance Levels : The price of 48.93 is a strategic point below the resistance level, making it an optimal entry for potential downward movement.
4. Volume Analysis : Recent volume spikes have signaled distribution phase movements, often leading to price drops.
Traders are advised to manage their positions according to their risk tolerance and always use Stop Loss to minimize potential losses. Stay alert to market conditions and any sudden price changes.
Good luck and trade wisely!
COMPUSDT 1DConfirm entry after breaking the downtrend and holding above it, with the goals shown in front of you
