COMP/USDT-LongThe price is close to the downtrend line that passes very soon in my opinion. So if the the price could break out the downtrend line, it could touch the next targets ahead. As always, it's not an investment suggestion. Don't remember entry step by step manner.
COMPUST trade ideas


COMP breaks trend line before, and now BEAUTIFULLY retest it !!!in the previous idea, comp breaks descending trend line and now we can see the beautifull hammer candle on trend line and price nicly retest the trend line , personally i buy more in here hold it to the moon, lets see
LIKE AND FOLLOW , THANK YOU

COMP ready for lunch to MOON!!!as we can see comp broke the massive descending trend line and ready for the targets ,this trade is very low risk and we dosnt see many strong resistance ahead and road is almost clear , take your profit at tp1 and tp2 for lower your risk.
like and follow THANK YOU.

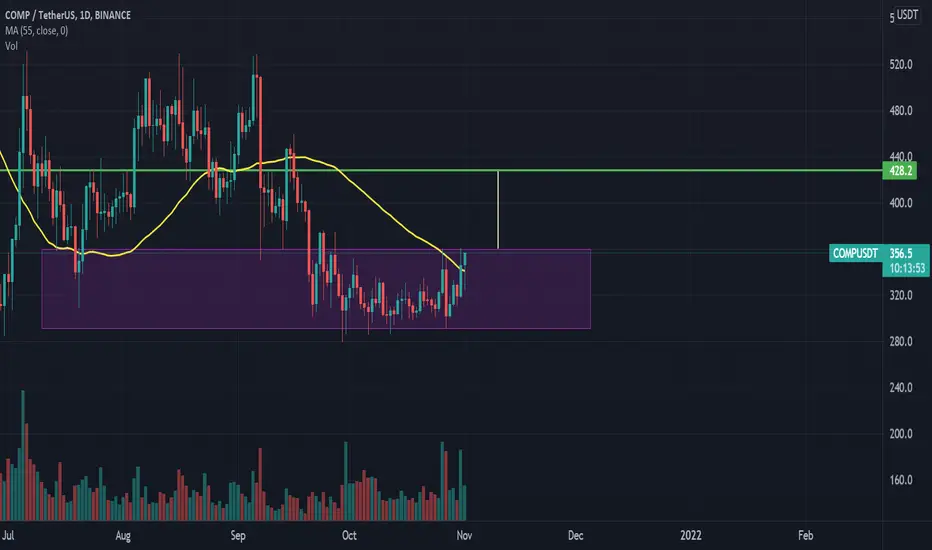
COMPOUND HAVE MORE THAN THIS - ITS ONLY THE START. - BREAKOUT EXHello trading friends,
We did see some breakdown trend with the most of markets, and as we expect that BTC could hold the Time frame for the whale trend there is an option that in coming times the markets could get green.
BAck the main coin COMPOUND and also the coin may be the most did leave or not interesting to have it. and Yes i can understand that. because when a market gets down - it feels not interesting.
Depending on the before study I have seen interest in this coin, and expect the coming we could get a huge breakout what could bring COMPUSDT First above 400 USD, after that even to 600 USD.
# Do always your own study and have a great day.
This view means more that you can see the interest, but you are the one that should do TA to confirm or it's interesting for you or not.
Like and follow for more trends - thank you!


COMP/USD - H&S - Shortsimple use Support and Resistance levels with that H&S pattern
...
find on my chart a slow MA-220 (purple color dynamic line)
...

buy potion in com in time frame daily At the bottom of the trend line and break the resistance and pullback with it

Compusdt long Compusdt is looking good about to break out and move above in ascending channel.
Targets 399 - 420 - 480
DIP BUY BEFORE BREAKOUT COMPOUND - GOLDEN COIN!Hello trading friends,
Expect that this is a DIp buy before Compound will show coming time a breakout.
This coin was found out by the coin view channel scan.
Expect that we can enter soon over 400 usd + with the targets as from 430 USD even to the top ATH 1200 usd +
Have a great day!


COMP - new rocket 🚀🚀Comp is a coin with good potential. A strong project on the fundamental analysis side. On the chart, the coin is in a trading range on the higher timeframes.
On the chart you can see that there is a large volume at the bottom when the lower boundary is tested, it is a bullish signal. A good buying opportunity. The first target is the upper limit of the trading range. The second target is the ATH.
Write in the comments all your questions and instruments analysis of which you want to see.
Friends, push the like button, write a comment, and share with your mates - that would be the best THANK YOU.
P.S. I personally will open entry if the price will show it according to my strategy.
Always make your analysis before a trade.

COMPOUND THE GOLDEN COIN fo 2021/2022 - And this are whyHello trading friends,
The most have seen that this coin was selected depending on Coinview by our channel, this depending on more trends, after we have studied the trend well we found out that COMPUSDT is interesting, normally COMPUSDT was before on way to 1200 usd, but this not happened, on more reasons as the corona time where more markets did crash.
THE RETURN LOOKS ON WAY
The CC Supply of this coin is very low, where it doesn't need much volume to increase to the targets.
One of the targets for fast traders
430
The second target could be 525 USD + 650 + And with a huge all-time high target of 1200 USD +
# The most would maybe say this is not possible now, as the most will not be able to hold COMPUSDT, but depending on expecting, this coin could show that in the long term.
As it looks now to the short term - are COMPUSDT investment, depending on all tools I use on trading scan found this coin out, as positive, and you as trader need and must do your own study to get your data. as you can use my expecting here as an extra.
Have a great day ! and time will show or this coin will have an interest increase as expected.
manage your risk well, this all depends personally expecting where using some tools to track the data and trends.

comp analysisComp has a strong support of 281$ and it ranging in a box of 281-230$ (so you can do future with tight stoploss ).
I am bullish in this coin—-
Compound (COMP) is an ERC-20 asset that empowers community governance of the Compound protocol; COMP token-holders and their delegates debate, propose, and vote on all changes to the protocol.
Its performance is best in past so we can see COMP soon to 520$
Quick scalpel area
Short term target
Long term target
All given in the chart👨🏻💻👨🏻💻

COMPUSDT Take Profit 370 400COMPUSDT
Entry price near 326.0
Stop loss 309.0
Take Profit 350 370 400
Risk Reward 1:4

COINVIEW SHOWS A GOLDEN TARGET AT 430 USD FOR BREAKOUT TREND!Hello trading friends,
We expect into the short term that COMPUSDT can become on target of 430+
This target is very important for a further breakout, and we should follow it with a time frame, we are at this moment still below 400 USD - depending on trend study and TA - We could see as we said above the 430 targets into short term.
Always do your own study as it will stay crypto with their risk. as long you have a trading plan is this coin a great option and it's personally expected.
Let's see coming time the trend, even if it breakdown, i expect there is a volume trend that will bring This coin back to the trend.
# Coinview is a study that shows possible increase coins for the coming time, the same study we did with coin view for Velas, dogelon IOTX and more before coins.
Next expecting target 430 usd for COMPUSDT
Have a great day!

COMP - JUST BUY THIS COIN FOR X10 ✅🚀COMP is the leader in our crypto portfolio. A very promising coin from a fundamental analysis point of view. In a nutshell, Compound is a DeFi lending protocol that allows users to earn interest on their cryptocurrencies.
🔋If we analyze from technical analysis side, this coin has been in accumulation for two months already, and soon we expect exit from accumulation zone and strong impulse growth. But don't discard correction option, the price can go down to support zone, which is marked below.
We bought this coin on the 26th of October at 318$ in the long accumulation zone for 5% of our total equity. This is one of our medium-term positions. We expect a potential of 500% to 1000%.
And of course don't forget to subscribe to our tradingview and other platforms, leave the name of the coin you want us to analyse in the comments. 💚

COMPUSDT is creating a descending channel 🦐COMPUSDT is creating a descending channel below the daily resistance. IF the price is going to have a breakout, According to Plancton's strategy (check our Academy ), we can set a nice order
–––––
Follow the Shrimp 🦐
Keep in mind.
🟣 Purple structure -> Monthly structure.
🔴 Red structure -> Weekly structure.
🔵 Blue structure -> Daily structure.
🟡 Yellow structure -> 4h structure.
⚫️ Black structure -> <4h structure.

COMPOUND LOOKS READY FOR THE MOON ! GOLDEN TARGETS ON WAYHello trading friends,
The best scan of the week is COMPOUND. and even if this happens with dollar-cost avenging. what means if price breakdown there could be new entering for the high targets.
I do more times coins study, Compound shows an amazing trend, where it can show unexpected increases.
I believe that we are at the start of increase - and this is my personally expecting, do always your study, and manage your risk well, as at last, it's your money.
If I scan a coin and that coin increase coming, it means I have done this for myself also, and I will share only info where I expect it has a high chance to happen, into crypto there is noting called 100%, but there is something called also good Data and trends study, and that's what I do. there is also noting in trading that wins always, but as long you win more than lose.
# some time the trends can return, but even then a breakout is still possible. some whales waiting for an exact limit order to enter. but does not mean that you should wait as a day trader, if you do cost averaging, then you have long term plan.
I hope for you all to make great profits, but same time I hope also for all to have at last a plan with risk management.
For those finding this coin interesting after you have done your own study, I wish you the best.
TARGETS?
The compound can hit coming time above 400 USD + on way to 500 USD, and even 650+
Like and follow if you like the content, thank you
Have a great day!

COMPUSDT AnalysisHello friends.
Please support my work by clicking the LIKE button(If you liked).Thank you!
Everything on the chart.
open pos: market
target: 365 and 395
after first target reached move ur stop to breakeven
stop: ~284(depending of ur risk). ALWAYS follow ur RM .
risk/reward 1 to 2
Good luck everyone!
Follow me on TRADINGView, if you don't want to miss my next analysis or signals.
It's not financial advice.
Dont Forget, always make your own research before to trade my ideas!
Will be very APPRECIATE FOR UR DONAT/coins :)
Open to your questions or suggestions(Looking for investors!).

COMP|USDTHey hey my friends👋
We are adding more comp to our bags here, only a matter of time before she goes!

Long Comp! Get 300% return!Hi, everybody
We think comp has great potential. Comp will rise at any time, and buying and holding will have huge benefits.
But now I don't think comp will rise too much.
buy zone:330-300
SL:280
target1:374
target2:430
