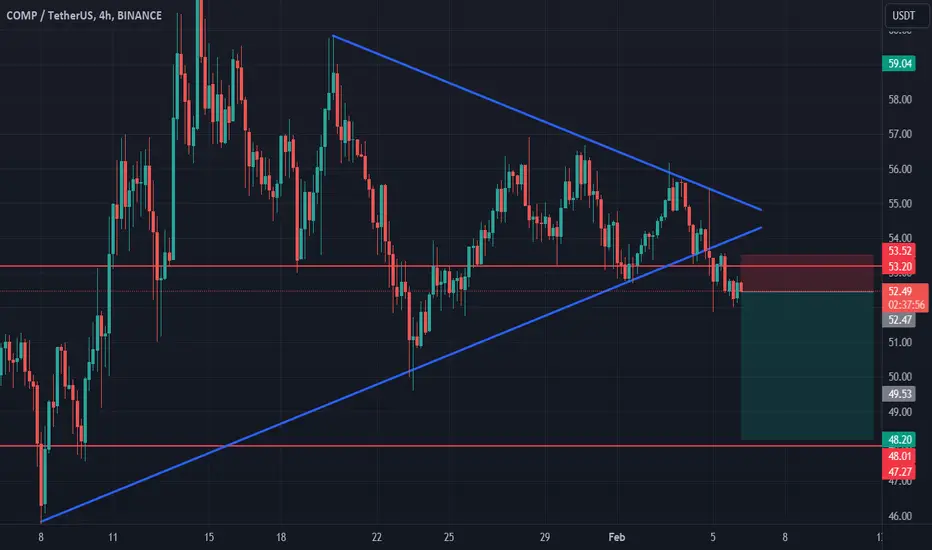
COMP shortCOMP broke trough the ascending trendline. Asset broke trough the support level. Bearish movement to support level at 48.2 is possible.
COMPUST trade ideas
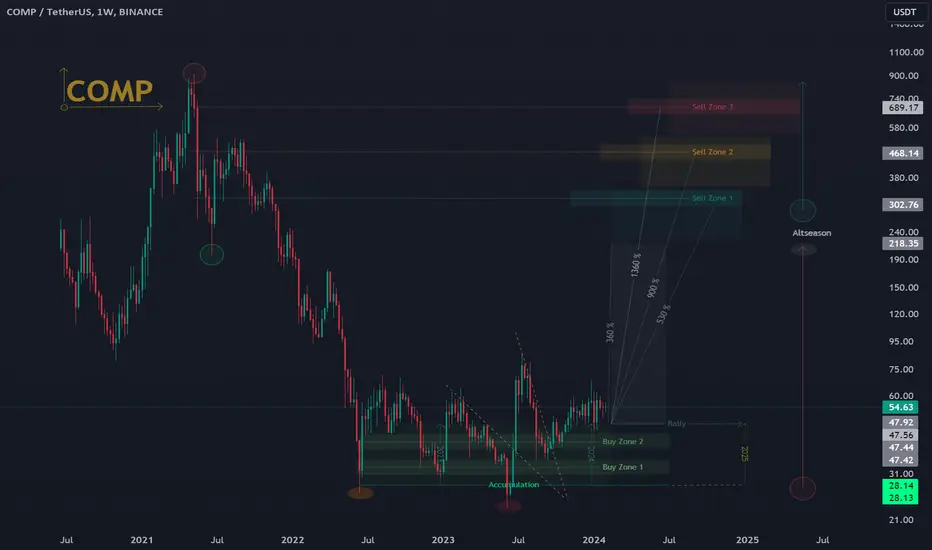
Compound (comp)The time has come to talk about the cryptocurrency representing decentralized finance. (comp) is globally positioned, and I anticipate an impulsive surge from it, ranging between $200 to $250. The structure clearly indicates where one can purchase this currency, and I am in the accumulation zone

COMP - Is the accumulation ending?The accumulation, which has been going on since June 2022, seems to finally end.
I believe we will see $100 quickly with a week's close above $55.53. That's why I care about the weekly closing this week.
let's watch

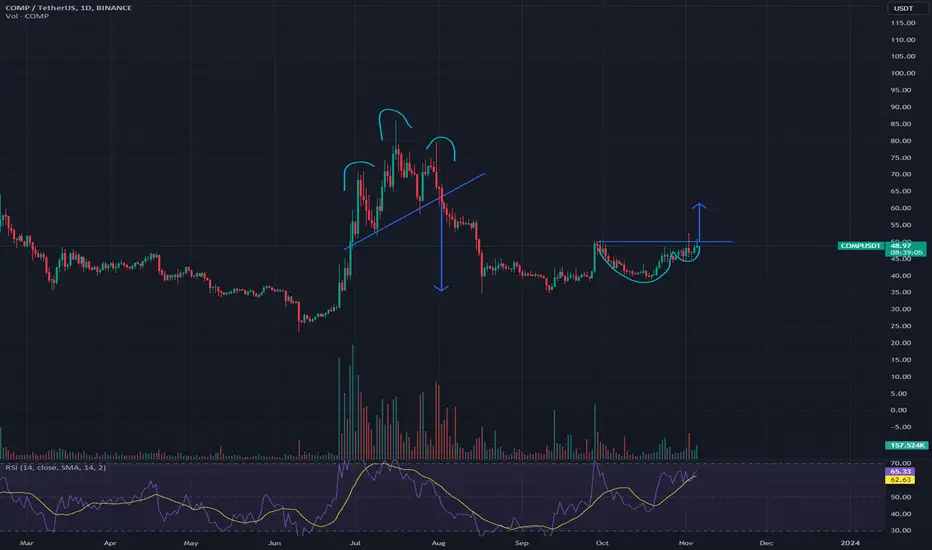
COMP/USDT | Compound |1D 👀Aggressive buying in the range of $30-50, with a long-term outlook! The allocated amount for the trade should not disrupt your risk management and portfolio management.
In 2024, I believe all strategies will be effective, especially averaging down. Averaging down works in any trend; there's a high probability that after a certain period, you'll be in profit.
The idea I'm conveying is that the timing of the purchase is more important than the buying price. It's about the market's predisposition to grow globally.
- Not financial advice, trade with caution.
✅ Stay updated on market news and developments that may influence the price of Compound. Positive or negative news can significantly impact the cryptocurrency's value.
✅ Exercise patience and discipline when executing your trading plan. Avoid making impulsive decisions driven by emotions, and adhere to your strategy even during periods of market volatility.
✅ Remember that trading always involves risk, and there are no guarantees of profit. Conduct thorough research, analyze market conditions, and be prepared for various scenarios. Trade only with funds you can afford to lose and avoid excessive risk-taking.
#Crypto #Compound #Investing #COMP
COMP longCOMP bounced off the ascending trendline and bounced off the support level. Bullish movement to resistance level at 59.8 is expected to happen.


COMP SHORT SETUPAn ABC is seen which appears to have been a bearish triangle wave B.
Now it seems that you are in the final wave of this triangle, i.e. wave e of B
The red box is expected to drop towards the specified targets.
I put the targets on the chart. Closing a 4-hour candle above this level will violate the analysis.
For risk management, please don't forget stop loss and capital management
When we reach the first target, save some profit and then change the stop to entry
Comment if you have any questions
Thank You

Comp usdt Camp currency is getting ready for a big move! It has a very good accumulation and I think it can start a good move. 120 dollars is the first target and it is available. 250 dollars and 320 dollars are the next targets. What do you think?

COMP - tricky situationHi guys, hope you are doing fine. COMP is holding 50$ range for a long time now. We can see drop to ATL or grow to 100$ at least. Its good to buy some on spot and later add if it will drop more. Its low cap coin. It can be pumped very fast. Regards!

Possible downtrend with EMA Cross on 15m COMPUSDTIf you check EMA there is possible downtrend with EMA Cross on 15m COMPUSDT. Also take in mind bearish flag and dont forget to check another timeframes.


Comp spot idea.Considering the volatility ahead, as the market seems to be topped. It seems that the adding a small spot on comp would be a good idea as it still seems to be in the accumulation zone htf. Once the breakout happens it can easily touch 99.

COMPUSDT: Bearish TrendCOMPUSDT.P is forming Rising Wedge pattern and recently, it seems that the Buyers may be getting exhausted as the pair has started to find support within the pattern. Additionally, the current price action is forming a Bearish divergence, which suggests that Sellers may be preparing for a significant downward move.
Will the Bears regain control and push the price Lower?

COMP/USDT Gearing Up for a Bull Run? 👀🚀COMP Analysis💎 Paradisers, turn your attention to #COMPUSDT, as it's currently showing promising signs of an upcoming move from a key demand level.
💎 #Compound is tracing an upward path, indicating a potential bullish breakout from its current demand level. It's anticipated to retest the demand level at $47.5 before continuing its upward trajectory. If #COMP can maintain its position above this level, it sets the stage for an ascent toward the significant supply zone at $84.
💎 Nonetheless, If #COMP encounters resistance in holding its ground above the $47.5 level, a strategic shift in our trading approach might become necessary. In that case, we would adjust our focus towards initiating a bullish movement from a slightly lower bullish OB level at $38.7.
💎 Keeping a vigilant eye on this level is critical, as a drop below could trigger a significant downward move.
💎 Stay alert and prepared, Paradisers. Your ParadiseTeam is committed to offering the latest market insights and strategic guidance to ensure you're well-prepared to handle these market developments.

COMPUSDT Elliott Waves Analysis (Investment Idea)Hello friends.
Please support my work by clicking the LIKE button👍(If you liked). Also i will appreciate for ur activity. Thank you!
Everything on the chart.
Main(investment) target zone: 850 - 1000$
Targets: 200 - 400 - 900
Cancellation of setup - consolidation under ~25
RR: 1 to ~30
risk is justified
Good luck everyone!
Follow me on TRADINGView, if you don't want to miss my next analysis or signals.
It's not financial advice.
Dont Forget, always make your own research before to trade my ideas!
Open to any questions and suggestions

📈🚀 Comp/USDT 200% Bullish Move Incoming! 📈🚀
📅 Weekly Time Frame Analysis:
The market structure of Comp/USDT has recently transformed into a bullish trend, indicating exciting opportunities ahead. In the coming days, we may witness a potentially remarkable bullish move of up to 200%! 🌟💪
🔍 Remember: Conduct Your Research!
Please note that this information is not financial advice. It is essential to conduct thorough research and analysis before making any investment decisions. ❗🔎
Trade wisely and stay informed! Good luck! 🤞💰

comp inteligentassetbullish scenario
resistances 66, 76 upper limit of the channel, 103 in 800 ema
bearish scenario
supports 53.8 in 50 ema, 50 in 200 ema, 48.3

Comp going for $200?Comp is holding the Weekly IFVG which will take comp up for
$85
$120
$175
Buy and hold


COMP UPDATE (4H TF)It seems that from where I entered "Start" we are inside an ABC, which is a diametric B wave and it is over. And now we are in wave C.
If the price reaches the supply range, we will look for sell/short positions in this range
For risk management, please don't forget stop loss and capital management
When we reach the first target, save some profit and then change the stop to entry
Comment if you have any questions
Thank You

compIt has a small resistance in the red box, which can see the above targets if it is crossed. If corrected, it should be seen how it will react to the green lines.

COMPUSDT waiting for breakdownPreviously, the head and shoulders worked perfectly, just like the textbook. Will we continue to learn the next pattern?
COMP: Resistance BreakoutTrade setup : Bullish break out from Symmetrical Triangle pattern, above 200-day moving average, signaled resumption in Uptrend. Bullish break above $60 signals continuation of uptrend, with upside potential to $80 near-term. Stop Loss (SL) at $54. Watch our recent Trading Video explaining a recent trade setup, including Take Profit and Stop Loss levels, and calculating a Risk-Reward Ratio.
Trend : Uptrend across all time horizons (Short- Medium- and Long-Term).
Momentum is Bullish but inflecting. MACD Line is above MACD Signal Line and RSI is above 55 but momentum may have peaked since MACD Histogram bars are declining, which suggests that momentum is weakening.
Support and Resistance : Nearest Support Zone is $47 (previous resistance), then $36. The nearest Resistance Zone is $60, then $80.
