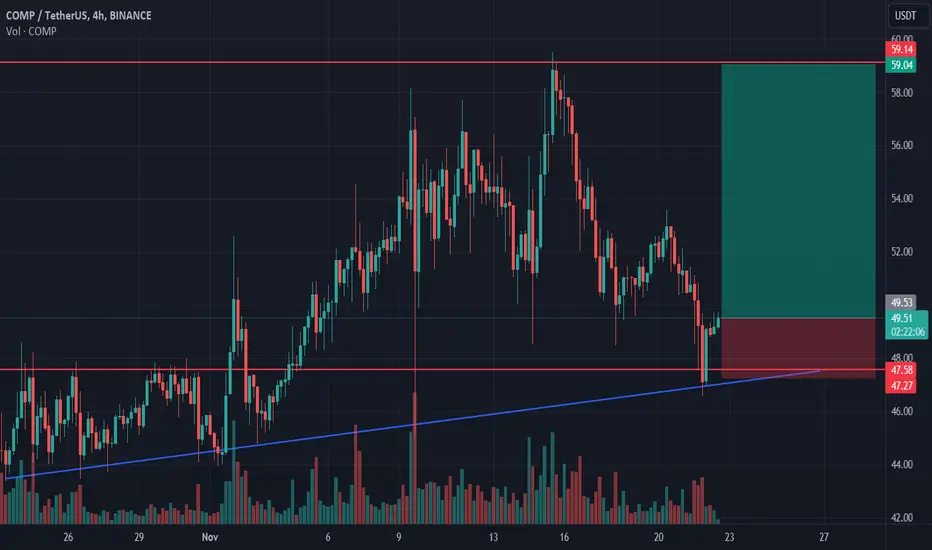
COMP USDT LONG SWING | COMPUSDT | LONG @ 58 - 60 | TP @ 60.5, 61, 61.5, 62, 62.5 | SL @ 54 | PATTERN = DESCENDING TRIANGLE BREAKOUT | BINANCE |
Swing trade idea. Kindly follow targets and stop loss. Will update with new targets once all 5 are achieved. Mostly trading with PNF charts, MACD, RSI, Stoch, BPI, Cipher, MA/EMA, Support/Resistance on hourly timeframes and higher time frames
BINANCE:COMPUSDT BINANCE:COMPUSDT.P COINBASE:COMPUSD GEMINI:COMPUSD BYBIT:COMPUSDT.P KUCOIN:COMPUSDT MEXC:COMPUSDT COINEX:COMPUSDT
COMPUST trade ideas

🚨 Trade Alert: COMP/USDT (3-5x)🚨 New Trade Alert 🚨
✅ COMP/USDT (3-5x)
📈 LONG Entry Zone: 56 - 62.22
⛔️ SL: 53
🔒 Breakeven Move: When it moves close to TP2
🎯 Take Profit:
Short Term: 62.9 - 63.7 - 64.9 - 66 - 68
Mid Term: 72 - 76 - 80 - 90 - 103
📝 Ensure you set entry orders to balance the trade's entry and aim to secure 30% of profits within the first two targets. Once profits are gained, adjust the stop orders to match the entry points or break-even levels.
⚠️ Disclaimer: Historical earnings cannot assure future outcomes. Is there a potential for risk? Certainly. The entire financial market is susceptible to uncertainties; any underlying factor or abrupt shift in market sentiment could overturn the current market trends and lead to losses. Refrain from undertaking undue risks that might jeopardize your financial stability. You are under no obligation to engage in this trade; kindly avoid the trade if you disagree with the trade analysis.
GIS TRADING®

COMPUSDT - Recovery IdeaImportant resistance zones are along the green lines
I have plotted a nice bowl structure that encompasses the bear move and the following bull move that is to come.
A clear double bottom along the bottom green line.

COMPUSDT Elliot Wave Completion and Anticipated 50% UpsurgeOn a daily timeframe, COMPUSDT has exhibited a discernible higher high and higher low pattern, signaling a notable trend structure. Following the completion of wave 3, quite an evident ABC corrective move unfolded, halting precisely at the double Fibonacci support level near $47. This critical support area has proven effective in arresting the downward movement.
As long as this pivotal support remains intact, our analysis anticipates a relatively swift upside movement of approximately 50%. This projected move would complete the 5-wave upward sequence, potentially marking the culmination of this bullish phase before a potential stronger downside pullback.

COMP LOOKS BULLISH (1D)By examining the COMP chart, we can see that this symbol has completed a major double correction. What appears to be the second part of this double correction is a large triangle that is coming to an end By maintaining the green area, it can continue to climb. I have specified 2 targets for this symbol.

COMPUSDT Elliott Waves AnalysisHello friends.
Please support my work by clicking the LIKE button👍(If you liked). Also i will appreciate for ur activity. Thank you!
Everything on the chart.
Entry: Market and lower
Targets: 60 - 63 - 66
after first target reached move ur stop to breakeven
Stop: ~45 (depending of ur risk). ALWAYS follow ur RM .
RR: 1 to 3
risk is justified
Good luck everyone!
Follow me on TRADINGView, if you don't want to miss my next analysis or signals.
It's not financial advice.
Dont Forget, always make your own research before to trade my ideas!
Open to any questions and suggestions

Compound resistance levelscompound has reversed and uptrending, resistance levels are as labeled. will see how things go as market can change at anytime, but as for now the chart looks bullish and is in uptrend.
DYOR, not financial advice.

Comp going to jump soon!BINANCE:COMPUSDT price is boren a major resistance. if we can hold this level soon it will go 70+ area . Also btcdom is going lower. Bullish for all alts in general.

COMP/USDT FLAG PATTERNWe can see perfect bullish trend and now the price like created flag pattern, wait for correction to discount price and bullish trendline and see if there has double bottom or another pattern reversal we can enter buy


COMP/USDT | 1d 👀1. Once NYSE:COMP chooses to break out of this range, the potential for an explosive move is high.
2. Considering the coin is currently 95% down from its all-time high, it presents a favorable opportunity for medium-to-long-term buying in my opinion.
3. Accumulation ranges of this nature often culminate in powerful movements; in this instance, an explosive upside move is anticipated in my opinion.
✅ Stay updated on market news and developments that may influence the price of Compound. Positive or negative news can significantly impact the cryptocurrency's value.
✅ Exercise patience and discipline when executing your trading plan. Avoid making impulsive decisions driven by emotions, and adhere to your strategy even during periods of market volatility.
✅ Remember that trading always involves risk, and there are no guarantees of profit. Conduct thorough research, analyze market conditions, and be prepared for various scenarios. Trade only with funds you can afford to lose and avoid excessive risk-taking.
#Crypto #Compound #Trading #COMP

compMaybe we have such a scenario
First, there is a red box in front of us
If it does not reject, the lower green lines are suitable for buying

COMP/USDT - Compound: Trend Reversal◳◱ On the $COMP/ CRYPTOCAP:USDT chart, the Trend Reversal pattern suggests a pause in volatility, potentially gearing up for a breakout. Traders might observe resistance around 59.61 | 63.45 | 72.81 and support near 50.25 | 44.73 | 35.37. Entering trades at 53.01 could be strategic, aiming for the next resistance level.
◰◲ General info :
▣ Name: Compound
▣ Rank: 149
▣ Exchanges: Binance, Kucoin, Bybit, Huobipro, Gateio, Mexc
▣ Category/Sector: Financial - Lending
▣ Overview: Compound is a lending platform built on Ethereum that enables users to permissionlessly borrow or lend from a pool of assets. Rather than interest rates being set by individuals, they are determined algorithmically based on the proportion of assets lent out.
◰◲ Technical Metrics :
▣ Mrkt Price: 53.01 ₮
▣ 24HVol: 17,942,825.619 ₮
▣ 24H Chng: 4.866%
▣ 7-Days Chng: -5.82%
▣ 1-Month Chng: -9.62%
▣ 3-Months Chng: 30.85%
◲◰ Pivot Points - Levels :
◥ Resistance: 59.61 | 63.45 | 72.81
◢ Support: 50.25 | 44.73 | 35.37
◱◳ Indicators recommendation :
▣ Oscillators: NEUTRAL
▣ Moving Averages: STRONG_BUY
◰◲ Technical Indicators Summary : BUY
◲◰ Sharpe Ratios :
▣ Last 30D: 0.10
▣ Last 90D: 1.52
▣ Last 1-Y: 0.66
▣ Last 3-Y: 0.26
◲◰ Volatility :
▣ Last 30D: 0.78
▣ Last 90D: 0.73
▣ Last 1-Y: 0.99
▣ Last 3-Y: 1.20
◳◰ Market Sentiment Index :
▣ News sentiment score is N/A
▣ Twitter sentiment score is 0.57 - Bullish
▣ Reddit sentiment score is 0.84 - V. Bullish
▣ In-depth COMPUSDT technical analysis on Tradingview TA page
▣ What do you think of this analysis? Share your insights and let's discuss in the comments below. Your like, follow and support would be greatly appreciated!
◲ Disclaimer
Please note that the information and publications provided are for informational purposes only and should not be construed as financial, investment, trading, or any other type of advice or recommendation. We encourage you to conduct your own research and consult with a qualified professional before making any financial decisions. The use of the information provided is solely at your own risk.
▣ Welcome to the home of charting big: TradingView
Benefit from a ton of financial analysis features, instruments and data. Have a look around, and if you do choose to go with an upgraded plan, you'll get up to $30.
Discover it here - affiliate link -

$comp invalidation below red line
looking for above supply zone
on the 21ema so if we hold that line we are good about 3.3% risk from here
COMP/USDT Could COMP break the key area or rejected ??💎 COMP has been a major point of interest in the market, especially as it approaches a strong supply area. Historically, COMP has struggled to break through this formidable resistance. A successful breach of the supply area could lead to a significant upward trend, potentially taking COMP towards our target in the Bearish OB area.
💎 However, if COMP finds itself unable to break out of the supply area and instead consolidates at the resistance level over the next few days, there's a chance it might face rejection again. This could lead to a retracement back towards the support trendline of the bullish, or ascending, channel.
💎 In the support trendline area, COMP needs to demonstrate a robust recovery to attempt another breakout of the supply area. Failure to maintain the support trendline, leading to a breakdown of the pattern, would be a concerning signal. Such a scenario could result in a significant downward movement for COMP, potentially heading towards the demand area.
💎 The demand zone becomes vital for COMP to show a strong rebound and attempt to reclaim support, thereby facilitating a continued upward movement to challenge the resistance area. If COMP fails to respond positively in the demand area and breaks down further, it could signal a shift back to a bearish trend, possibly leading to a descent towards the strong support area.

COMP/USDT Eyeing an Upward Break from Descending Channel? 👀 🚀💎 Paradisers, focus on #COMPUSDT as it presents a noteworthy trading opportunity. Currently, the asset is navigating a descending channel, showing strong indications of an impending upward movement from a crucial support level.
💎 Over the past month, #COMPOUND has adeptly followed its channel trajectory. Now, having touched the internal key support level at 43.65, there’s a substantial likelihood of a bullish reversal, potentially leading to a breakout above the channel.
💎 The VRVP analysis reinforces this sentiment, suggesting that visits to key support levels often precede robust bullish movements. Should this bullish trend gain momentum, COMP is set to target resistance levels at $58.41 and $86.98.
💎 It’s important to note, however, that a decline below the current support level would necessitate a critical reassessment of the trading strategy. Such a movement could imply challenges in sustaining the bullish trend, calling for a strategic recalibration in response to market dynamics. 🌴💰

long trade on COMP/USDT 22% profit long trade as shown on the COMP/USDT , happy trading to u all and enjoy ur day , remember this is my own opinion and not a financial advice

COMP longCOMP bounced off the ascending trendline and bounced off the support level. Bullish movement to resistance level at 59 is expected to happen.
✴️ Compound Bullish Continuation Confirmed (133% Target & More) Another major Cryptocurrency project, trading pair (COMPUSDT) is now moving forward.
Today Compound trades at its highest level moving north since the June 2023 rise.
This is happening after a clear and strong higher low as prices move above EMA300.
With the action we are seeing today, a bullish continuation is basically confirmed.
➖ The day needs to close above $50 for this signal to be valid.
Anyway, there is no need to doubt, too many signals are pointing to the continuation of this massive bullish wave.
Targets can be seen on the chart.
Full trade numbers in the 'Related Ideas' below.
Thank you for reading.
Namaste.

compThe first resistance zone that is ahead is the red box, if it is crossed, the above lines are available, if it is corrected to the green line, it must be checked again for entry.

COMP - getting readyCOMP is a nice asset and a close above EX TP1 is needed for further upside.
I think once that it's done, TP2 and 3 will be achieved asap


The compact analysis of the Currency CurrencyRetained the $ 45 support well and could have climbed some
RSI divergence is observed
A blockblock is observed at $ 60
And there are some sales position at $ 74 in Baynens
I expect to be able to pull himself to the $ 70 resistance after arriving at Ardar Block
It seems to be a low -risk deal, especially as the trend is completely up
When with a powerful candle reaches our loss, Staplas is activated
